
More than 1 in 9 people were experiencing hunger in 2021, even as 3.1 billion people could not afford a healthy diet, a gap that turns price pressure into food insecurity. At the same time, food affordability is being squeezed from every direction, from fertilizer costs and cereal price stress to conflict driven displacement and micronutrient deficits. This post brings those forces together using the latest global benchmarks on sanitation, nutrition, and humanitarian need so you can see where severity is rising and why.
Key Takeaways
- In 2022, 29% of the global population did not have access to basic sanitation services, worsening health environment and nutrient absorption among vulnerable households.
- In 2023, the FAO Cereal Price Index averaged 120.2, indicating ongoing cereal cost pressure globally.
- In 2023, global food losses and waste were estimated at 1.05 billion tonnes per year, which increases scarcity and cost pressures that contribute to food insecurity.
- In 2022, fertilizer prices were on average about 3–4 times higher than pre-2021 levels, reducing input affordability for farmers and worsening food insecurity risks.
- In 2022, the Global Agriculture and Food Security Program (GAFSP) reported that climate shocks were a key driver of food insecurity, with significant impacts on yields for vulnerable producers.
- Globally, women face higher risk of food insecurity due to gender inequalities: FAO and partners report persistent gender gaps in access to resources that contribute to hunger.
- In 2023, acute malnutrition among children was reported with widespread prevalence in high-burden countries; UNICEF documented that 47.0 million children under 5 were affected by wasting (acute malnutrition).
- In 2023, UNICEF estimated 148.1 million children under 5 were stunted (low height-for-age), reflecting chronic undernutrition linked to food insecurity.
- In 2023, 21.9 million people were in IPC Phase 5 (famine) conditions or higher, indicating the most severe food insecurity outcomes.
- In 2022, the IMF estimated food and energy inflation added about 2.7 percentage points to global inflation, affecting food affordability and informing policy responses.
- In 2023, OECD-DAC donors committed $35.0 billion in gross ODA for agriculture, forestry, fishing and crop-based food systems, supporting food security programming.
- In 2022, 24.2% of adults in low- and lower-middle-income countries reported worrying about running out of food at least sometimes (Gallup World Poll, used in the State of Food Security and Nutrition in the World).
- 3.1 billion people were unable to afford a healthy diet in 2021, representing about half of the world’s population, per the Global Food Security Index and related affordability analysis.
- In 2023, global food retail sales were roughly $8.6 trillion (industry market estimate), reflecting the scale of affordability and price transmission channels.
- 59 million people in 2023 were in IPC Phase 4 (Emergency) or above, indicating extreme short-term food insecurity severity.
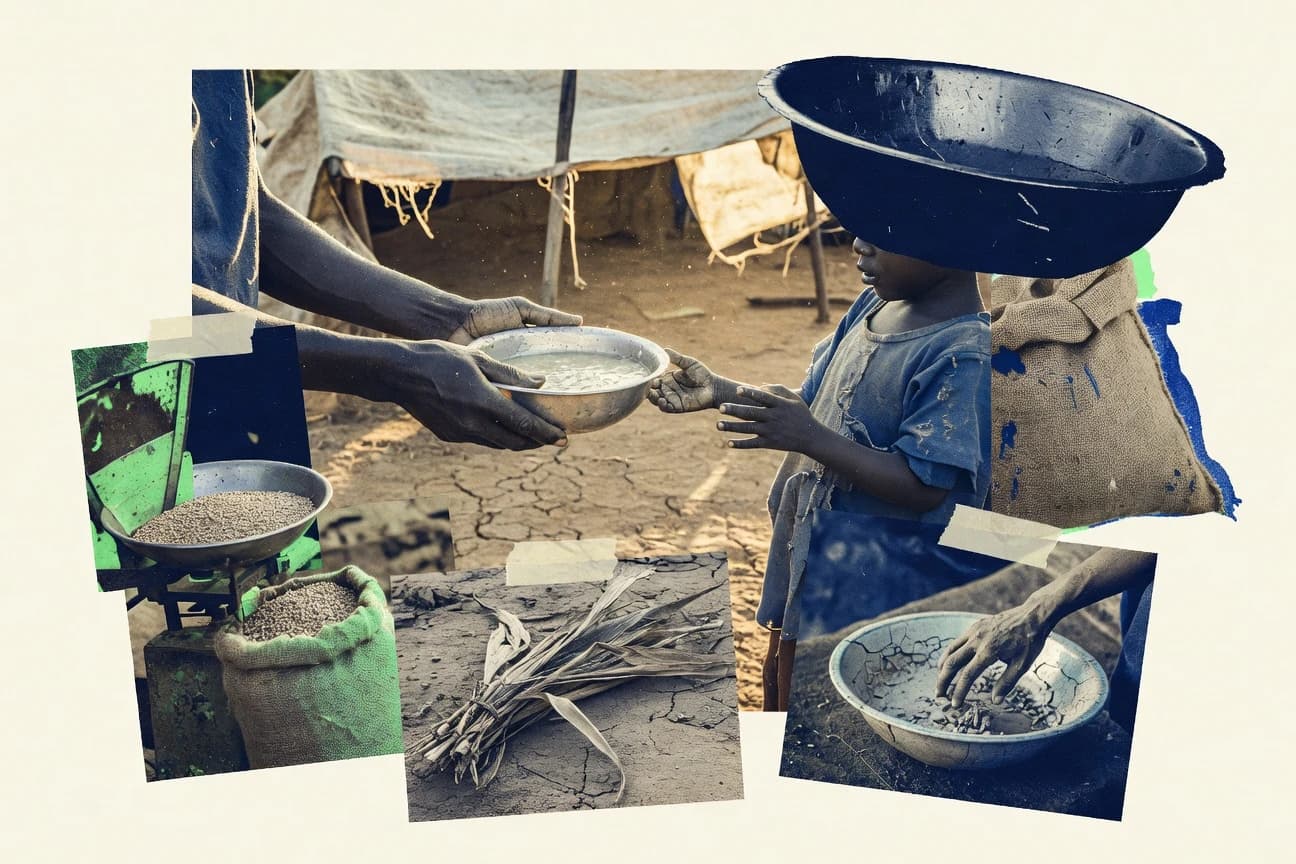
Rising prices, conflict, and climate shocks are driving extreme hunger and malnutrition for millions worldwide.
Related reading
01 · Category
Food Systems Metrics4 stats
01
In 2022, 29% of the global population did not have access to basic sanitation services, worsening health environment and nutrient absorption among vulnerable households.
02
In 2023, the FAO Cereal Price Index averaged 120.2, indicating ongoing cereal cost pressure globally.
03
In 2023, global food losses and waste were estimated at 1.05 billion tonnes per year, which increases scarcity and cost pressures that contribute to food insecurity.
04
In 2022, an estimated 27% of the global population did not have access to safe drinking water (WHO/UNICEF JMP), which affects food preparation, hygiene, and nutrition outcomes linked to food insecurity.
Interpretation
Food Systems Metrics Interpretation
Across food systems metrics, multiple pressure points are converging, with 29% lacking basic sanitation and 27% lacking safe drinking water in 2022, while cereal prices stay high at an index of 120.2 in 2023 and food losses and waste reach 1.05 billion tonnes a year, amplifying scarcity and worsening food insecurity.
02 · Category
Drivers And Inequality4 stats
01
In 2022, fertilizer prices were on average about 3–4 times higher than pre-2021 levels, reducing input affordability for farmers and worsening food insecurity risks.
02
In 2022, the Global Agriculture and Food Security Program (GAFSP) reported that climate shocks were a key driver of food insecurity, with significant impacts on yields for vulnerable producers.
03
Globally, women face higher risk of food insecurity due to gender inequalities: FAO and partners report persistent gender gaps in access to resources that contribute to hunger.
04
In 2023, at least 100 million people were internally displaced by conflict and violence worldwide, increasing food insecurity and humanitarian needs.
Interpretation
Drivers And Inequality Interpretation
In the Drivers and Inequality category, rising fertilizer prices to 3–4 times pre-2021 levels alongside conflict displacement of at least 100 million people shows how affordability and protection gaps hit hardest, while climate shocks and persistent gender-based resource inequalities further deepen vulnerability to food insecurity.
03 · Category
Nutrition Outcomes5 stats
01
In 2023, acute malnutrition among children was reported with widespread prevalence in high-burden countries; UNICEF documented that 47.0 million children under 5 were affected by wasting (acute malnutrition).
02
In 2023, UNICEF estimated 148.1 million children under 5 were stunted (low height-for-age), reflecting chronic undernutrition linked to food insecurity.
03
In 2023, 21.9 million people were in IPC Phase 5 (famine) conditions or higher, indicating the most severe food insecurity outcomes.
04
In 2022, global micronutrient deficiencies remained high: the Global Burden of Disease estimated iron deficiency affected about 1.2 billion people (a risk factor for poor child development and vulnerability).
05
In 2021, 7.3% of children under 5 were wasted globally, indicating acute undernutrition levels consistent with food insecurity pressures.
Interpretation
Nutrition Outcomes Interpretation
Nutrition outcomes in 2023 show acute and chronic undernutrition at scale, with 47.0 million children under 5 affected by wasting and 148.1 million stunted, while 21.9 million people were in IPC Phase 5 famine conditions or worse, underscoring how severe food insecurity is translating directly into measurable child malnutrition.
04 · Category
Policy And Aid Flows2 stats
01
In 2022, the IMF estimated food and energy inflation added about 2.7 percentage points to global inflation, affecting food affordability and informing policy responses.
02
In 2023, OECD-DAC donors committed $35.0 billion in gross ODA for agriculture, forestry, fishing and crop-based food systems, supporting food security programming.
Interpretation
Policy And Aid Flows Interpretation
In 2023, donors backed the policy and aid flows agenda with $35.0 billion in gross ODA for agriculture and crop based food systems, a response to the 2022 IMF estimate that food and energy inflation added 2.7 percentage points to global inflation and strained food affordability.
05 · Category
Cost And Affordability4 stats
01
In 2022, 24.2% of adults in low- and lower-middle-income countries reported worrying about running out of food at least sometimes (Gallup World Poll, used in the State of Food Security and Nutrition in the World).
02
3.1 billion people were unable to afford a healthy diet in 2021, representing about half of the world’s population, per the Global Food Security Index and related affordability analysis.
03
In 2023, global food retail sales were roughly $8.6 trillion (industry market estimate), reflecting the scale of affordability and price transmission channels.
04
In 2023, global food trade value was about $2.1 trillion (industry estimates for international trade in food and agricultural products).
Interpretation
Cost And Affordability Interpretation
In cost and affordability terms, the data show that in 2021 about 3.1 billion people, roughly half the world, could not afford a healthy diet while in 2022 24.2% of adults in low and lower middle income countries worried about running out of food, even as global food retail sales reached around $8.6 trillion in 2023 and food trade totaled about $2.1 trillion.
06 · Category
Acute Severity1 stats
01
59 million people in 2023 were in IPC Phase 4 (Emergency) or above, indicating extreme short-term food insecurity severity.
Interpretation
Acute Severity Interpretation
In 2023, 59 million people were in IPC Phase 4 or worse, showing that acute severity is affecting an enormous number of people with extreme short term food insecurity.
More related reading
07 · Category
Prevalence Levels1 stats
01
1,000,000,000+ people—about 1 in 9 globally—experienced hunger in 2021, based on an estimated global scale of food insecurity burden (SOFI 2022 estimates).
Interpretation
Prevalence Levels Interpretation
In the prevalence levels of global food insecurity, more than 1,000,000,000 people about 1 in 9 worldwide faced hunger in 2021, showing how widespread the problem is across the global population.
08 · Category
Humanitarian Funding2 stats
01
$47.1 billion global humanitarian needs for food and agriculture were requested in 2023, per UN OCHA’s Global Humanitarian Overview (food-related cluster/sector needs).
02
In 2023, the global gap between humanitarian funding needs and requirements for food was significant: the 2023 Humanitarian Response Plan for the food security sector reported a funding coverage around 50% at mid-year (as tracked by OCHA and ReliefWeb updates).
Interpretation
Humanitarian Funding Interpretation
In 2023, UN-tracked humanitarian needs for food and agriculture totaled $47.1 billion, yet food-security programs were funded at only about 50% mid-year, showing a major humanitarian funding gap that left urgent needs far from being met.
09 · Category
Conflict And Displacement1 stats
01
In 2023, conflict was the largest driver of acute food insecurity: IPC analysis attributed the majority of Phase 3+ caseloads to conflict-related disruptions (largest share among drivers).
Interpretation
Conflict And Displacement Interpretation
In 2023, within the Conflict and Displacement category, conflict was the top driver of acute food insecurity with the majority of IPC Phase 3 and above caseloads attributed to conflict related disruptions.
10 · Category
Climate Shocks1 stats
01
In 2022, 2.3 billion people experienced at least one serious food system hazard (climate extremes, water stress, pests and diseases) according to a global food security and hazard assessment.
Interpretation
Climate Shocks Interpretation
In 2022, 2.3 billion people faced at least one serious food system hazard linked to climate shocks such as climate extremes, water stress, and pests or diseases, underscoring how widespread these disruptions are.
11 · Category
Agricultural Inputs2 stats
01
In 2021, about 37 million farms were operating in Sub-Saharan Africa (farm counts used in FAO-style compilations published by the World Bank Data Lab).
02
In 2022, 10–15% of fertilizer used globally is estimated to be wasted or not efficiently utilized, reducing yields and contributing to affordability pressure (peer-reviewed nutrient use efficiency literature).
Interpretation
Agricultural Inputs Interpretation
For the Agricultural Inputs side of food insecurity, the scale is striking with about 37 million farms in Sub Saharan Africa in 2021, and in 2022 an estimated 10 to 15 percent of globally used fertilizer was wasted or not efficiently utilized, meaning less usable inputs are likely translating into lower yields and higher affordability pressure.
Reference
Cite This Report
This report is designed to be cited. We maintain stable URLs and versioned verification dates. Copy the format appropriate for your publication below.
APA
Aisha Okonkwo. (2026, February 13). Global Food Insecurity Statistics. Gitnux. https://gitnux.org/global-food-insecurity-statistics
MLA
Aisha Okonkwo. "Global Food Insecurity Statistics." Gitnux, 13 Feb 2026, https://gitnux.org/global-food-insecurity-statistics.
Chicago
Aisha Okonkwo. 2026. "Global Food Insecurity Statistics." Gitnux. https://gitnux.org/global-food-insecurity-statistics.
Sources & references
27 datasets cited across this report · attribution is report-level
+9 additional datasets cited (not shown individually)