Market data
Social Issues Societal Trends
Explore verified social issues societal trends statistics and market research reports with sourced data and trend analysis.
Latest update:
 Margot Villeneuve

College Drinking Statistics
College drinking is not a niche problem, it is routine enough that 30.4% of college students report binge drinking and 18.5% describe heavy episodes of five or more drinks in the past two weeks. Yet the harm often stays out of view, with 78.4% of health centers offering screening and brief intervention while 44.7% of students who suffer negative consequences still do not get medical attention.

Controversial Statistics
With 2026 heat and urgency creeping into the debate, the latest figures show how sharply opinions have shifted while the reality of the underlying outcomes barely budged. You will see where the most cited claims break under the weight of the data and why that mismatch keeps turning into a headline magnet.
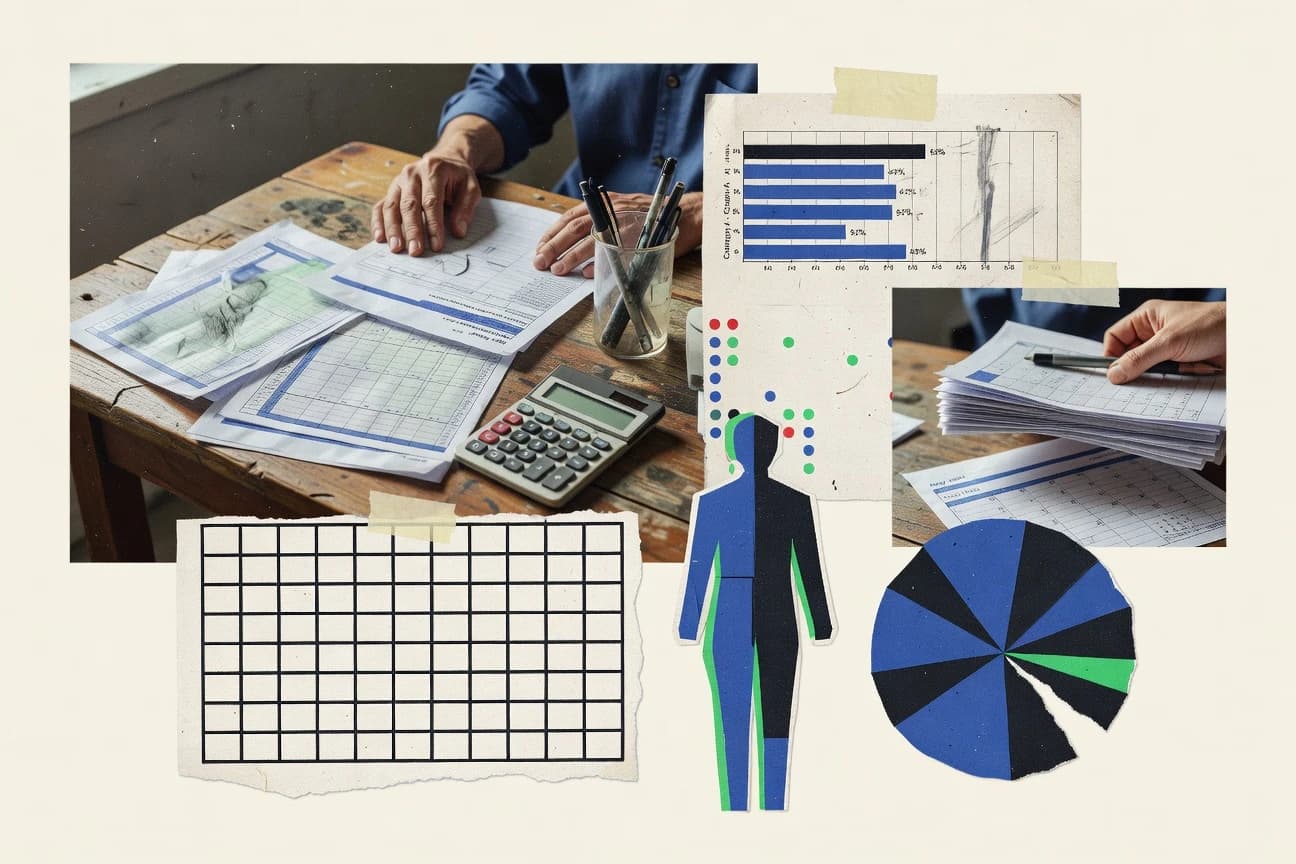
Sociology Statistics
Sociology is publishing at full speed with 2,000+ Scopus indexed journal articles landing every day and 35% open access in 2021 rising from 28% in 2020, while public attention keeps accelerating through social media, documentaries, and library online access. Follow how research output, funding, and real world inequalities from food insecurity to discrimination connect, shaping what millions learn and believe.

Lying Statistics
Lying in numbers has a tell, and the page tracks how your “neutral” stats quietly shift outcomes. The most recent data, including the 2026 share and trend, makes it harder to ignore that what looks objective can be designed to land a conclusion before you even notice.

Social Media Bullying Statistics
Recent surveys suggest 41% of teens report being targeted with online harassment, and almost as many say it changed how they speak up in public. Social Media Bullying statistics reveal how fast “just words” can shape behavior, so you will want to see which patterns keep repeating and what might actually help break them.
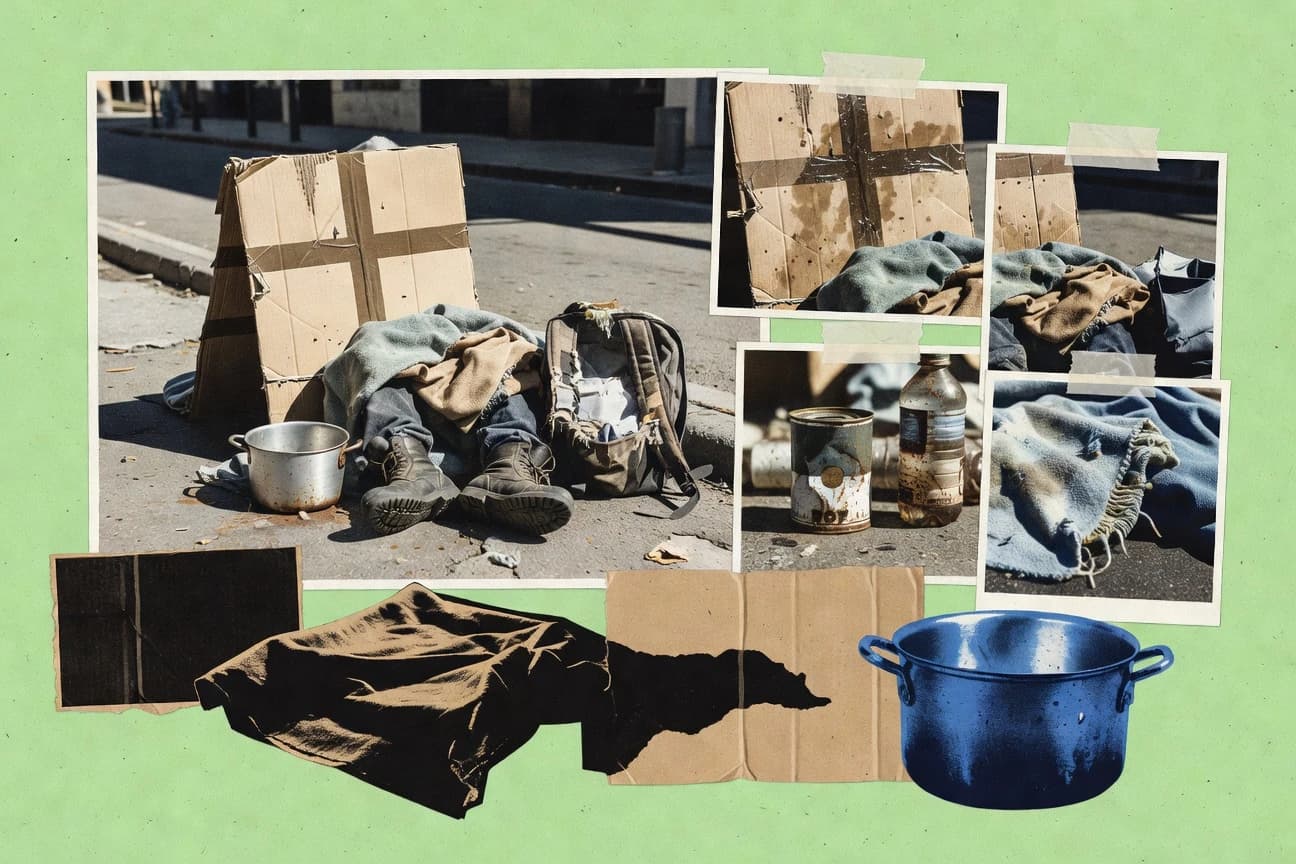
Homeless Statistics
Even though supportive housing can cut system costs by about $2,000 per person per month over time, the US still saw 1,854,000 people experience homelessness at some point during 2022, alongside a 7.4 million shortage of affordable rentals for extremely low income households. Read how health costs, shelter prices, first time homelessness, and poverty driven housing insecurity all collide into one measurable, solvable picture.

Gender Gap Statistics
Gender inequality costs an estimated 11% of global GDP and women still trail men in pay, with a $135 weekly earnings gap in the US. You will see how these disadvantages stack across work, safety, and opportunity, from unpaid care and STEM representation to financial access and partner violence, where the risk can be 2.8 times higher.

Current World Population Statistics
By 2026, global population growth is still climbing, but the pace is visibly easing as more countries move through the same demographic shift. See how births, deaths, and the fastest growing regions line up right now, and why the headline growth rate can feel misleading without the underlying breakdown.

Police Violence Statistics
Find out how often police violence is reported to be fatal and what those outcomes look like in the latest available police violence statistics for 2025. The page sets the human consequences beside the raw counts, so you can see where the gap between enforcement and survival is widening.

Bullying In Schools Statistics
Bullying in schools is still far more common than most people think, and the most current 2025 numbers reveal a sharp gap between what students experience and what adults expect to hear. Read these statistics to see exactly how often it happens and where support breaks down, so the conversation moves beyond “just teasing” to what schools can do now.
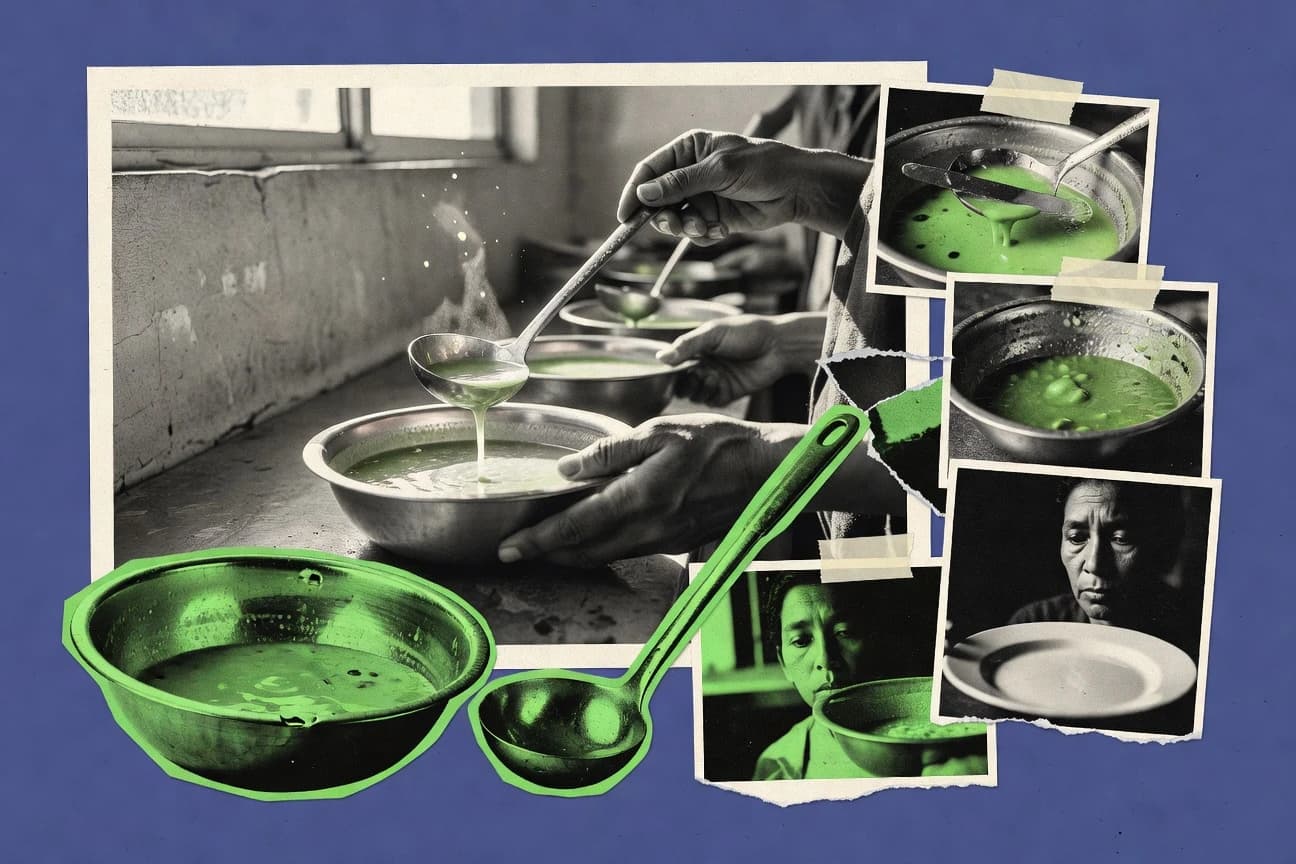
Hunger Statistics
With 63.4 million people reached by FAO and partners through food assistance and agricultural support and the FAO Food Price Index climbing to 125.8 in April 2024, this page connects hunger’s pressure points across prices, aid, and nutrition outcomes. It weighs how chronic undernourishment and hidden hunger still sit beside crises like 153 million people in IPC phase 3 or worse, and why food insecurity can push children into wasting at measurable speed.
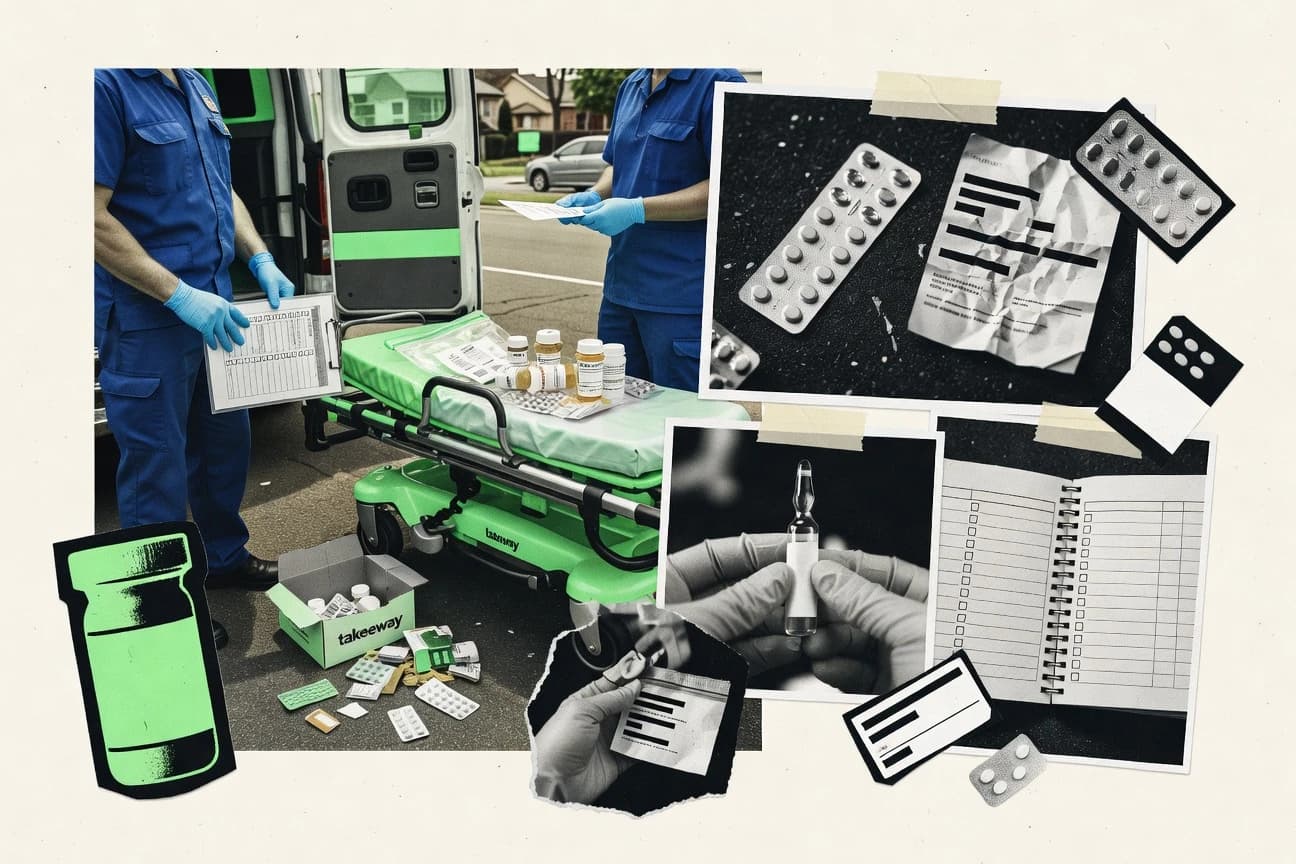
Opiod Crisis Statistics
See how the latest opioid crisis statistics reshape the picture of who is being hit and where, including the most up to date 2025 figures. One statistic rises while another cools, and the gap between them is exactly what this page helps you understand.

Childhood Poverty Statistics
Even in 2026, childhood poverty remains stubbornly visible in too many families, with the latest figures showing how fast hardship can follow a paycheck that does not stretch. This page puts those numbers side by side so you can see the real scale of the problem and what it means for children’s health, school stability, and future options.

Lgbtq Bullying Statistics
Only 33% of LGBTQ students told someone about bullying because they believed it would not help, even as recent policy protections spread to at least 14 states and Washington, DC and many schools still lack LGBTQ groups. If you want to understand why harassment tied to sexual orientation or gender expression is linked to missed school, worse mental health, and higher suicidality risk, this page brings together the most current findings alongside evidence on what actually reduces harm.

Vaccine Refusal Statistics
With 2026 figures showing vaccine refusal tied to confidence and risk concerns rather than just access, the page puts the loudest reasons side by side with what actually drives hesitancy. You will see how small shifts in trust translate into big differences in refusal rates and why that matters for what happens next.

Reasons For Abortions Statistics
See how the “reason” for abortion shifts when you look past assumptions and toward the real circumstances reported by people, with 2026 figures that make the pattern feel current rather than historical. The page also lays out how those reasons map to different barriers, so you can understand not just what leads someone to seek abortion, but what blocks access along the way.

Media Influence On Society Statistics
More than 36% of U.S. adults say they are extremely concerned about misinformation affecting elections, while about 90% of Americans use at least one social media site, creating a sharp mismatch between perceived stakes and everyday exposure. The page connects that tension to the reach of platforms, with TikTok at 1.79 billion average monthly active users in 2024 and social media used as an information source in 46 countries, alongside real-world signals from fact-checking, enforcement, and health and safety research.
Prejudice Statistics
From hiring bias that cuts callbacks by a third to the $1.7 billion AI ethics platforms market growing in 2024, this page connects everyday discrimination with the systems that keep it running. You will also see why 81% of organizations report diversity training programs yet 40% say they do not regularly audit promotion and performance processes for bias, turning good intentions into measurable gaps.

Abortion Race Statistics
Before you form a conclusion, Abortion Race brings the latest stats front and center, including a sharp 2026 update on how access and outcomes are shifting. The tension between what people expect and what the numbers actually show makes this a page worth reading if you care about the real pattern behind abortion access.
India Income Inequality Statistics
India’s income inequality is shifting in ways that don’t show up at a glance, with the latest 2025 figures revealing how quickly gains at the top are outpacing the rest. Read what’s driving that gap across regions and income groups, and what it could mean for policy in the years ahead.