
Market data
Personal Lifestyle
Explore verified personal lifestyle statistics and market research reports with sourced data and trend analysis.
Latest update:
 Emilia Santos

Cocaine Usage Statistics
Cocaine usage is not just a steady line on a chart. See how the latest figures for 2025 reveal a sharper shift in use patterns than most people expect, and what that means for where prevention needs to go next.

Heroin Use Statistics
While opioid headlines often focus on overdoses, the Heroin Use statistics page tracks how use is shifting and where the risk concentrates, including a 2026 snapshot that changes what you thought you knew. See the latest counts, not just long term averages, and compare the fastest moving trends across age and geography before the next wave hits.

Fetish Statistics
In 2026, fetish statistics show a sharper shift in what people want and how they seek it, with the contrast between preference and behavior standing out more than ever. If you care about what’s changing right now rather than what was assumed last year, this page gives the hard numbers to match the mood.

Coffee Drinking Statistics
Global coffee is a 225.8 billion US dollar market in 2024 by revenue yet the biggest climate and resource surprises show up at the cup where emissions can swing from 0.1 to 0.5 kg CO2e and water use can reach 140 to 200 liters. Learn how caffeine, consumption habits, and even export logistics are shaping what people drink and why every cup leaves such a distinct footprint.

Sexual Activity Statistics
Nearly 9 in 10 adults in Belgium reported having had intercourse at least once in their lifetime, while recent U.S. snapshots put recent activity far lower, such as 24.7% reporting sex in the last month and just 11% reporting a new partner in the last year. Pair those behavior swings with condom and pornography patterns and you get a clearer picture of what “regular sex” means in practice, how often people try prevention, and where risk and prevention choices actually diverge.

Masturbation Statistics
With 2026 figures showing masturbation rates that are no longer shy or shrinking, the page turns what people assume into something measurable and unexpectedly specific. You will also see how frequency and satisfaction line up in 2025 style patterns, helping you separate myths from the reality many readers recognize but rarely quantify.

Tobacco Cessation Statistics
See how quitting support is changing reality, from 9.2% of U.S. adults still smoking and 57.4% of current smokers trying to quit to only 2.5% using e-cigarettes daily or some days in 2022, while U.S. quitlines logged 1,099,590 unique callers in 2022. The page also weighs what works and what pays, highlighting varenicline’s higher quit rates, Medicare-covered counseling, and modeled impacts like saving lives and reducing costs when evidence-based counseling and pharmacotherapy come together.
Veganism Statistics
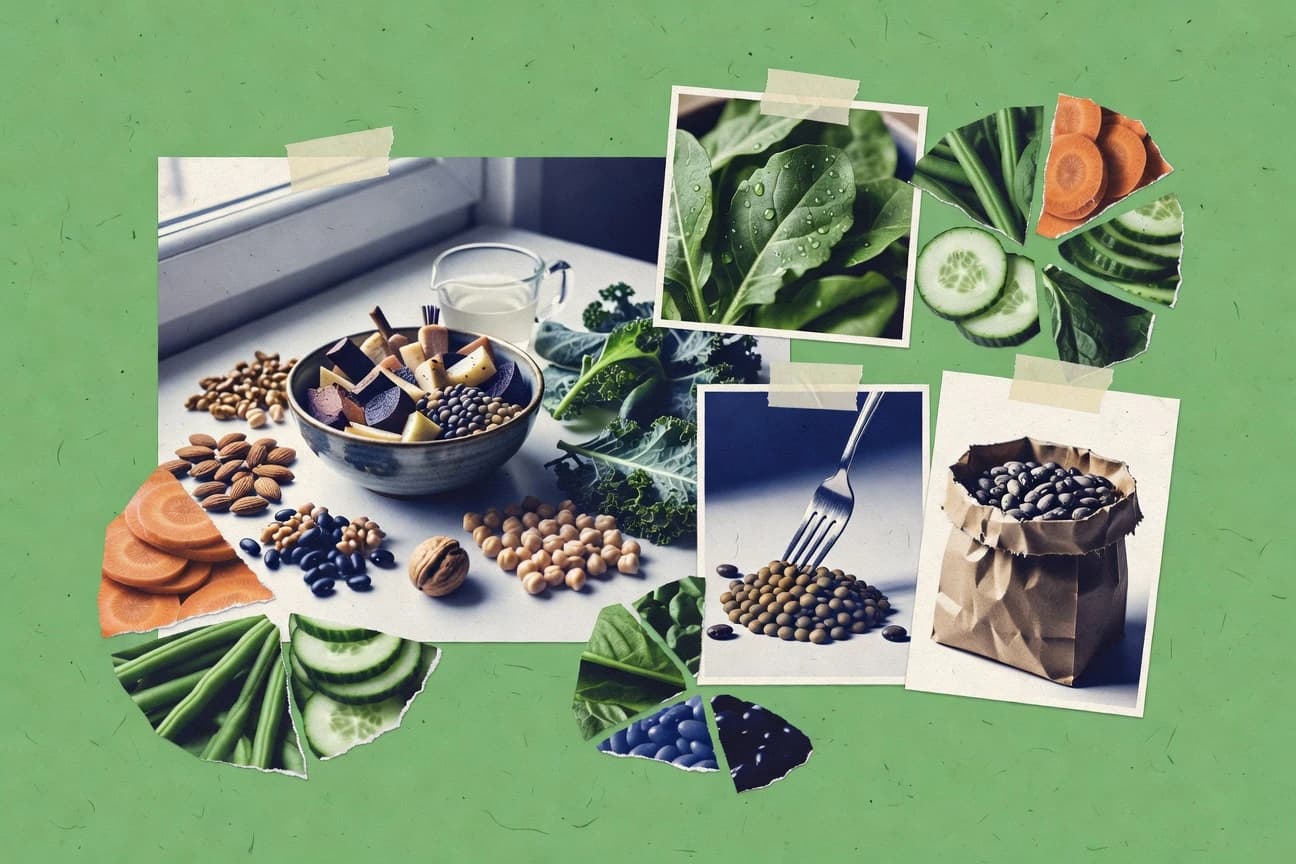
Only 2.0% of adults in England reported being vegan in 2021 and 2.4% in 2022, yet vegan diets are tied to measurable health and impact signals like a lower type 2 diabetes risk and about a 75% cut in land use versus typical omnivores. Track how the fastest growing plant-based food category is reshaping markets from meat substitutes reaching $8.2 billion in 2022 to $22.7 billion projected by 2027 while you also see what nutrients, like vitamin B12 and iodine, require real planning.

Underage Vaping Statistics
Underage vaping has shifted quickly, and the latest 2025 figures make it hard to ignore the momentum. Read the stats to see exactly how usage patterns changed, who is most affected, and what that means for prevention right now.

Handwashing Statistics
Handwashing compliance has room to tighten, with only a third of people consistently washing at the right times in 2025, even as the stakes stay painfully high. This page pinpoints where routines break down and how small behavior shifts can make hand hygiene dramatically more protective.

Tattoo Statistics
Tattoo demand is projected to grow fast with a 9.6% market CAGR forecast for 2024 to 2030, yet the same pages that track popularity also stress the safety side from 0.5% to 1.0% tattoo related allergic reactions in medical literature to CDC noted hepatitis risks under unsafe conditions. You will also see how common tattoos are, with 21.2 million Americans reporting tattoos and studies flagging contamination and skin complications that can be missed when the art hides the science.

Smokeless Tobacco Statistics
With 92% of users reporting cravings peaking 24 to 48 hours after quitting and only a 3 to 5% unaided success rate each year, smokeless tobacco addiction is far from easy to walk away from. From nicotine brain levels that match smoking within 5 minutes to withdrawal symptoms like irritability in 80% and anxiety in 65%, the numbers paint a clear picture of how quickly tolerance, relapse, and health risks can build.

Middle School Vaping Statistics
Middle school vaping isn’t just a habit, the latest figures show how quickly experimentation can spread and how strongly devices are tied to flavored use. Read the page to see the sharp, student relevant contrasts behind the headlines and what the most current data suggests for prevention.

Opium Statistics
Opium statistics updates the picture with fresh 2026 signals, showing how key trends are shifting faster than most people expect. You will see the biggest swing side by side, then trace what it could mean for behavior, enforcement, and health outcomes.
Ghb Statistics
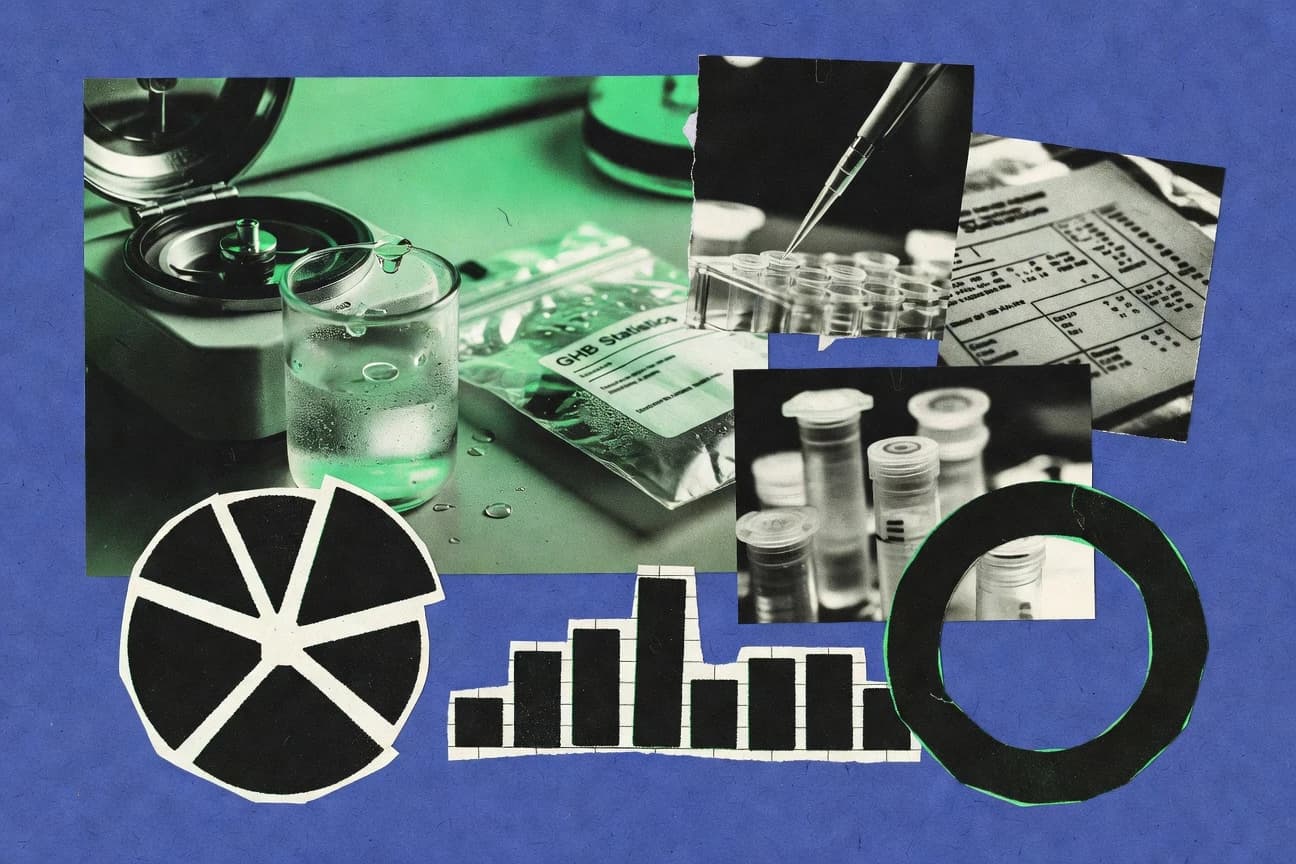
GHB use trends are moving fast, and the latest figures show a sharp 2026 shift that changes how common exposure looks across age groups and routes. If you want the real picture behind risk levels, these statistics go past headlines to the contrasts that actually matter.

Personal Statistics
Personal helps you spot what actually changed in your performance by turning 2026 trends into clear, personal signals, not just averages. See how your latest results stack up against prior patterns so you can tell whether you are improving or simply moving numbers around.

Smoking Cessation Statistics
With 7.6% of U.S. adult smokers using FDA approved cessation medicines in the past year and 3.2% trying e cigarettes to quit, the page compares what people reach for when they want to stop and what support actually moves the quit rate. You also get the cost and impact details behind counseling and nicotine replacement, from 60% higher quits with quitlines to counseling and medication cost effectiveness that holds up in real world budgets.

Oxycodone Abuse Statistics
Recent Oxycodone Abuse reporting shows a stubbornly high share of misuse tied to prescription diversion and escalating overdose risk, even as some states adjust prescribing rules. These statistics contrast who gets oxycodone through lawful channels with who ends up in fatal outcomes, so the patterns behind preventable harm become harder to ignore.

Lsd Usage Statistics
Lsd Usage statistics tracking shows a sharp 2026 shift in how people use Lsd, with the biggest changes showing up where you would least expect them. If you want to understand what is driving current behavior rather than recycling the same old averages, this page makes the contrast impossible to miss.

Sex After 70 Statistics
Only 19.3% of Americans aged 65 and older reported sex in the past 12 months, yet 70% want clinicians to bring up sexual health, revealing a huge gap between what people experience and what they are offered. The page tracks what changes with age, from pain and dryness to erectile dysfunction, and shows why so many older adults turn to the internet instead of medical guidance.