GITNUX MARKETDATA
Browse Our Category
Personal Lifestyle
Latest update:


Premarital Sex Statistics
Premarital sex patterns are shifting fast, and the latest figures for 2025 reveal how much attitudes and timing have changed compared with what many people assume. If you want a clear reality check for sexual health, consent conversations, and relationship expectations, these data points will sharpen it quickly.

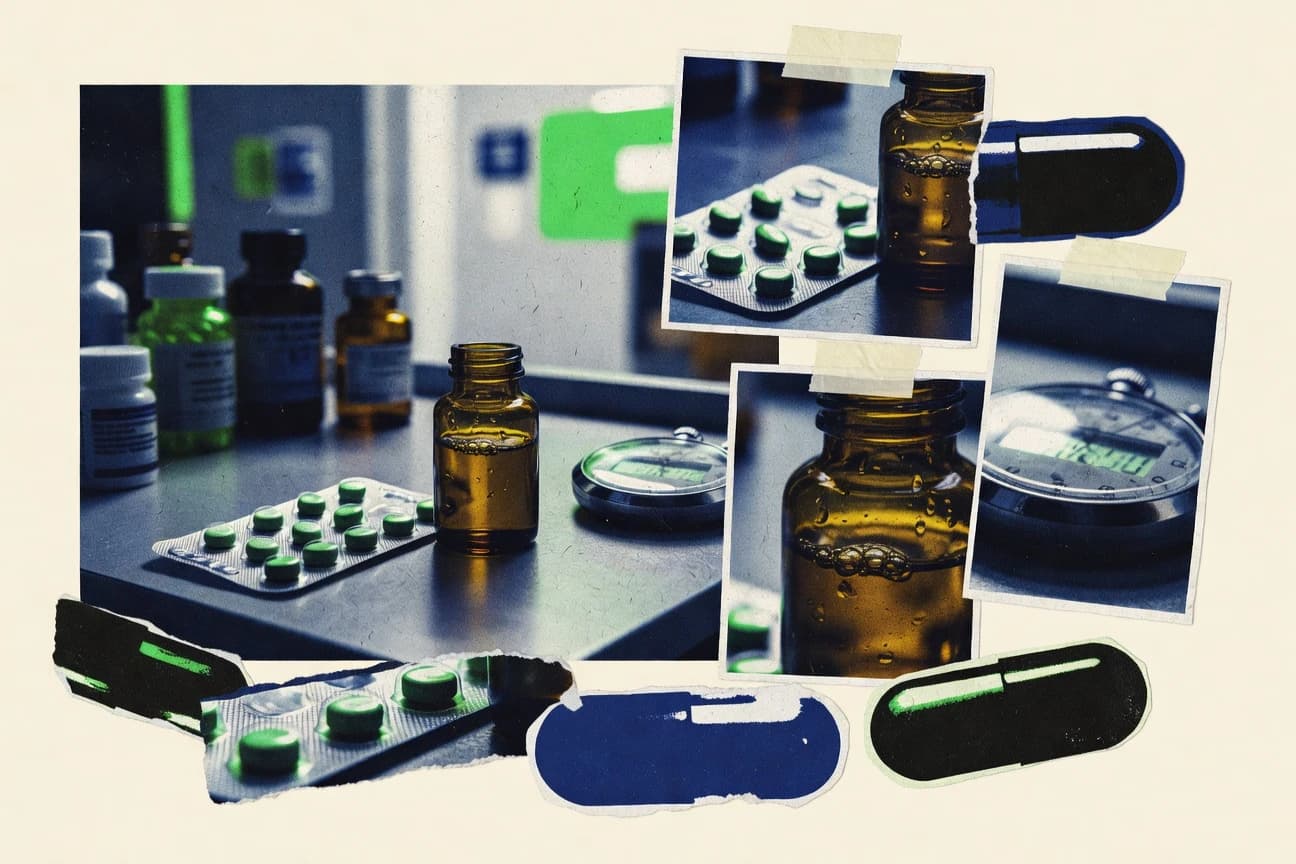
Youth Drug Use Statistics
Recent figures show how quickly youth drug use patterns shift, with 2026 data highlighting a sharp change from the year before. If you thought trends were stable, these numbers reveal where experimentation is rising, where it is slipping, and what that means for prevention right now.

New Years Resolutions Statistics
Only 21% of U.S. adults say they do not set New Year’s resolutions at all, yet research and trials reveal why many still fall short, with about 8% of resolvers actually succeeding and goal planning making adherence jump meaningfully. See which levers work, from structured goal tracking and self monitoring to feedback and implementation intentions, and compare them with the real-world momentum, spending, and tracking habits that surge every January.
Stimulants Statistics
Stimulants statistics reveal a striking gap between how often these drugs are used and how that usage is reflected in real outcomes, with 2026 numbers showing the trend is still moving fast. You will see what changed, who is most affected, and how the latest rates compare to earlier baselines, so the story stops being abstract and becomes measurable.

Sex Statistics
Tell the difference between what people say about sex and what the numbers actually show, with the sharpest 2026 snapshot of sexual behavior, satisfaction, and risk. You will come away with the kind of contrast that changes how you think about safety and intimacy, not just facts on a page.
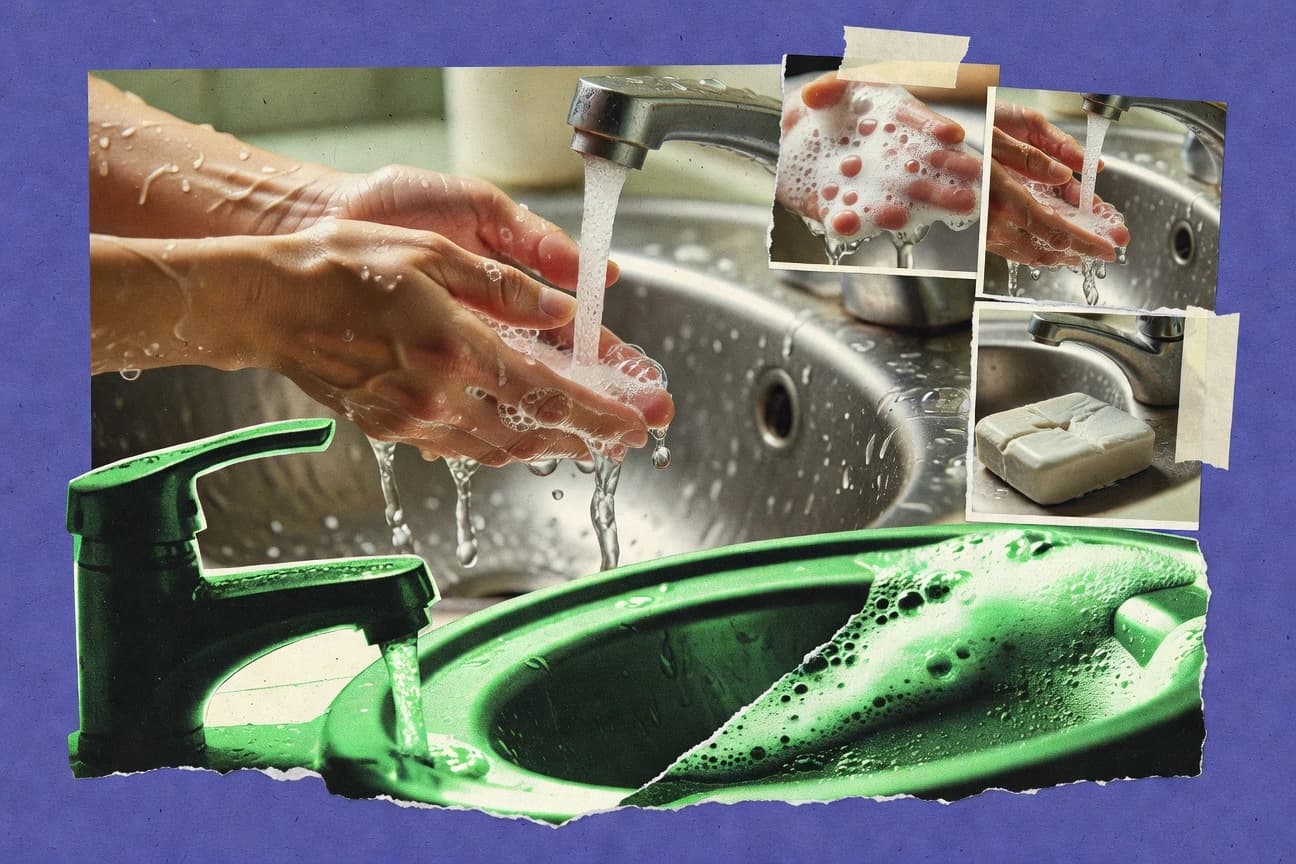
Hand Washing Statistics
Handwashing with soap dramatically reduces diseases and saves lives globally.

Current Vaping Statistics
Vaping statistics are shifting fast, with 2026 showing a clear break from the patterns people learned to expect. This page puts the latest Current Vaping data side by side with what came before so you can spot whether the trend is really moving or just changing its look.

Youth Smoking Statistics
With 2025 made possible by the latest policy and biomarker evidence, youth smoking remains stubbornly measurable at school and health level, from 2.6% of US students aged 13 to 15 who were current cigarette smokers in 2021 to US youth vaping numbers reaching US$7.8 billion in sales in 2023. You will also see how peer pressure, nicotine dependence, and secondhand smoke connect to real outcomes like poorer lung function and higher later disease risk, plus what enforcement and Tobacco 21 changes can shift when they actually bite.
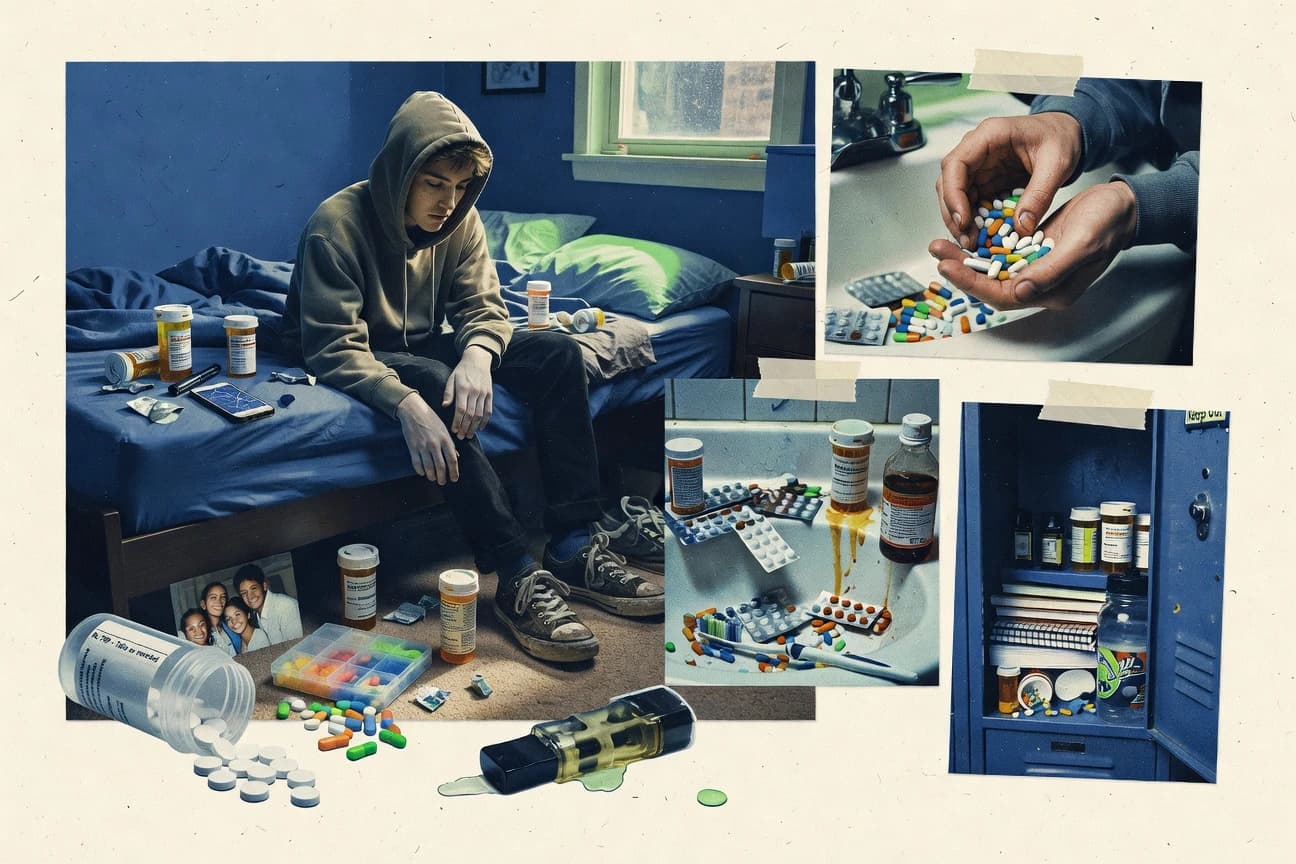
Teenage Drug Abuse Statistics
With only 5.0% of students reporting illicit drug use in the past 30 days and 7.6% reporting alcohol, the overall picture looks less dire than the risk underneath. This page tracks how marijuana stands out at 3.8% for 12th graders and how opioid deaths and overdose care have climbed, including 91.0% of adolescent overdose deaths involving opioids, so you can see what “small percentages” actually cost.

Teen Alcohol Abuse Statistics
Current alcohol use among U.S. high school students is 30.3% in 2022, with binge drinking at 14.1% and heavy use at 6.0, but the more urgent contrast is how many teens still report alcohol is easy to obtain. See the latest trends and the real life consequences behind these shifts, from missed school to drinking related harm.

Pegging Statistics
From Pornhub’s 500M pegging video views to broader acceptance up 60% in the latest Gallup sex poll, this page tracks how a once niche practice is now showing up across media, books, streaming, and real life. It also connects the cultural lift with practical safety and satisfaction figures, so you can understand not just why interest is surging, but what people report when they try it.

Tattoos Statistics
Tattoos still start as identity, with 73% of wearers saying they symbolize who they are, but the page quickly turns from culture to caution with 24% of tattoos linked to allergic reactions and ink MRI complications hitting 1 in 100 patients. You will also see how tastes shift fast, including feminist tattooing up 30% after #MeToo and UV fading that makes tattoos lose 40% of vibrancy while raising skin cancer risk.

Clutter Statistics
Americans spend about $38 billion a year on self-storage and lose time, money, and focus to the stuff they cannot find, from late bill payments to higher insurance premiums. This page pulls together the most revealing clutter stats, showing how disorganization can drain productivity, raise stress, and even cost homes more when it is time to sell.

Body Piercings Statistics
With modern stats in hand, 31% of minors pierced without consent face higher infection risks and DIY piercings lead to severe infections at 22% versus 2% with professionals. From ancient origins to what is trending now, this page tracks both why body piercings stick and what can go wrong during healing so you can make better choices.

People With Tattoos Statistics
Tattoo rates are 38% for US women versus 27% for men, and they climb to 43% among ages 26 to 40, so who gets ink and why is anything but uniform. But the page also follows what happens after the needle, including a 2.5% average infection rate per procedure and 16% of tattooed people reporting allergic reactions, turning style talk into something you can weigh.

Tattoo Popularity Statistics
Tattoo ownership is no longer a niche, with 38 percent of US women ages 30 to 49 tattooed and Gen Z women at 55 percent having or wanting ink. Yet adoption is uneven by identity, income, and geography, from a 20 percent tattoo rate among Asian Americans to only 40 percent for lower income households and a sharp 37 percent urban versus 26 percent rural split.

Personal Development Industry Statistics
Personal development is already going digital fast with 67% of the market shifting online by 2025 and AI powered coaching apps rising 300% in 2023, but the real surprise is who is spending, who is sharing, and what platforms are winning. This page brings together signals like Gen Z daily self help app use, corporate spending doubling toward $100B by 2030, and podcast to course conversion to show where growth is headed next.

New Years Resolution Statistics
Only 9% of New Year’s resolutions lead to lasting habit change beyond two years, yet the page tracks what actually beats the usual drop off. You will see striking shifts by group and goal, from remote workers prioritizing work life balance to mental health surges and performance focused athletes, plus the real failure drivers like unrealistic goals and no accountability partner.

Nicotine Use Statistics
Nicotine hooks the brain fast, with dependence emerging in 10% of first time users under 18 and withdrawal peaking 24 to 48 hours after quitting before fading over up to 4 weeks, yet most smokers do not make it without help since only 7% succeed annually. For a current reality check, 2021 data show tobacco still fuels massive harm worldwide, with 50% of long term smokers dying prematurely and 11.5% of U.S. adults smoking cigarettes, while today’s youth vaping trends and nicotine delivery keep addiction within reach.

Psilocybin Statistics
Psilocybin packs a surprisingly precise pharmacology, from 4.97 ppm phosphate signatures in NMR to psilocin peak levels at 1.5 to 2 hours and 5-HT2A binding at Ki 173 nM, with conversion to psilocin exceeding 90% after oral dosing. This page also tracks why effects can shift fast, including stability at neutral pH but rapid acidic breakdown, plus modern legal and clinical statistics like Oregon Measure 109 and 2025 initiatives that keep redefining when and how psilocybin can be studied and used.