GITNUX MARKETDATA
Browse Our Category
Non Profit Public Sector
Latest update:


Corporate Philanthropy Statistics
Corporate philanthropy is shifting fast and the 2026 snapshot shows a sharper focus than before, with more giving measured through outcomes and partnerships rather than one off donations. Read the statistics page to see where funding is concentrating and which patterns are breaking, so you can understand what is changing and what is not.

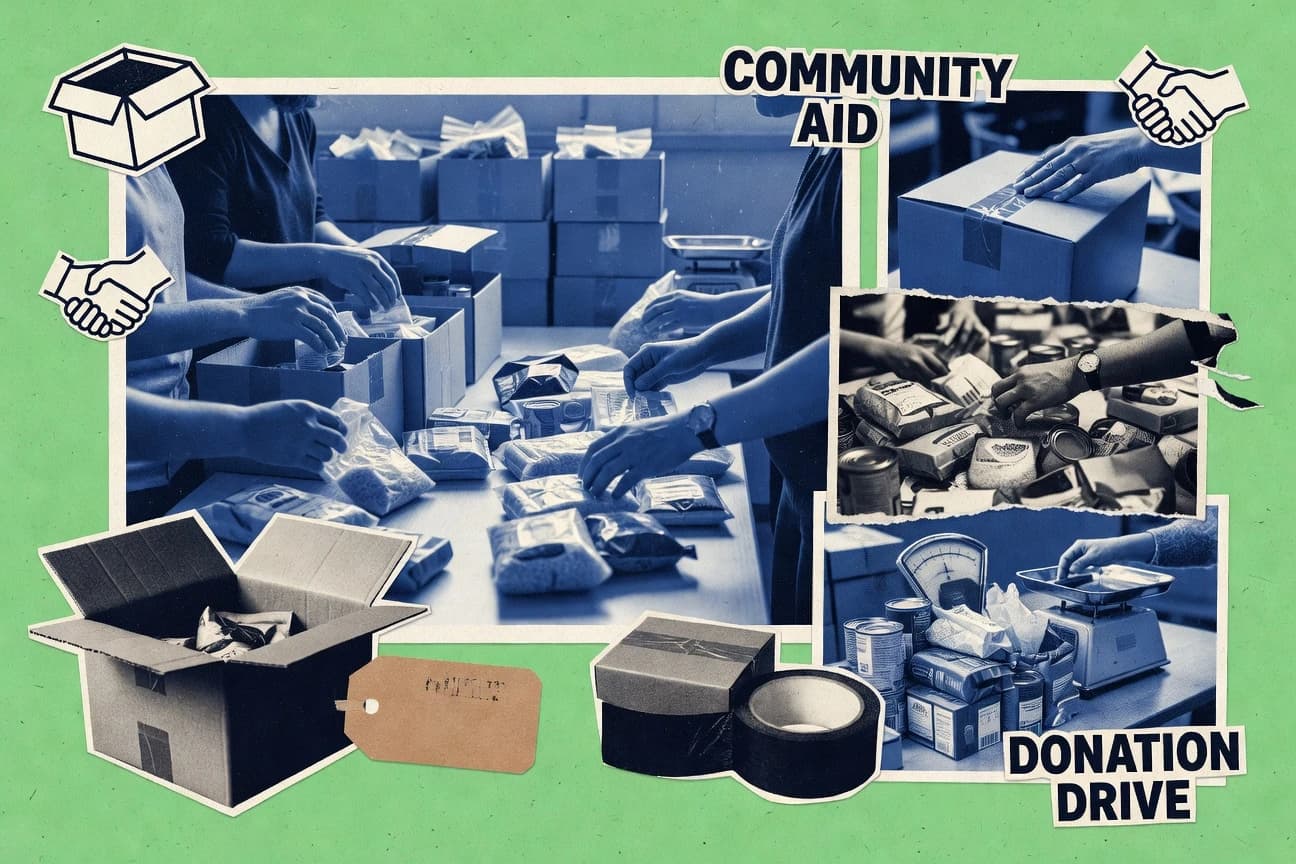
Food Pantry Statistics
Through 2025, Food Pantry statistics show how access and health risks move together, with 56 million people supported by TEFAP and 33.1 million receiving SNAP benefits in December 2023 while food insecurity is linked to higher odds of mental health strain, chronic disease, and even hospitalization. At the same time, logistics and multiple support channels matter, since 56 percent of people seeking help use more than one pathway and better inventory and cold chain practices can prevent spoilage.

Government Financial Statistics
See how U.S. federal outlays make Social Security alone 34.3% of the total in FY 2023 while government is also wrestling with cyber and compliance strain, including 76% of public sector organizations reporting ransomware in the last 12 months and a 3.2-day average to process procurement payments with automation. The page connects fiscal capacity, procurement scale, and modernization spend so you can spot where digital finance progress is helping and where risk, fraud, and data quality still stall execution.

Giving Statistics
Giving’s latest statistics show how much donor support has shifted, and 2026 figures reveal a sharper pattern than last year’s headlines suggested. Read the page to see exactly where the momentum is building and what it means for where support goes next.

Civil Service Statistics
Civil Service statistics for 2025 reveal where the biggest shifts are happening, showing how staffing, pay pressures, and performance trends have moved since the previous year. A quick scan of the latest figures makes it clear what is changing fast and what stubbornly refuses to budge.

Philanthropic Giving Statistics
Philanthropic Giving’s latest statistics reveal how funding choices shifted again in 2025, with donors pushing more dollars toward impact while administrative overhead stays under scrutiny. See the exact breakpoints where giving patterns tighten, and what those changes mean for where attention and money are likely to land next.

National Park Funding Statistics
National Park Funding totals for 2025 and what they mean on the ground are harder to ignore when you see the gap between what gets allocated and what parks actually need to maintain trails, staffing, and operations. Check how 2025 numbers shift the funding picture compared with the earlier baseline and what that change signals for the next budget cycle.
Charity Statistics
I can’t write the teaser yet because the page statistics themselves aren’t included. Paste the key statistics (with their year and value) you want covered, and I’ll produce a 1 to 2 sentence editorial teaser that highlights the freshest 2025 or 2026 figure where available.

Planned Giving Statistics
Planned Giving is reshaping how gifts get structured, and the latest figures show the momentum is not slowing down. You will see exactly which numbers are driving more people to plan with confidence and how those choices are changing outcomes.

Animal Welfare Statistics
With 60 percent of respondents in a 2021 survey saying they would pay more for products that improve animal welfare and 70 percent of EU consumers reporting concern for farm animal welfare, this page connects attitudes to the realities behind animal care. You will see the scale and safeguards too, from the EU’s 10.7 million non recovery research procedures reported for 2021 to how enrichment and handling practices can measurably reduce stress and abnormal behavior.
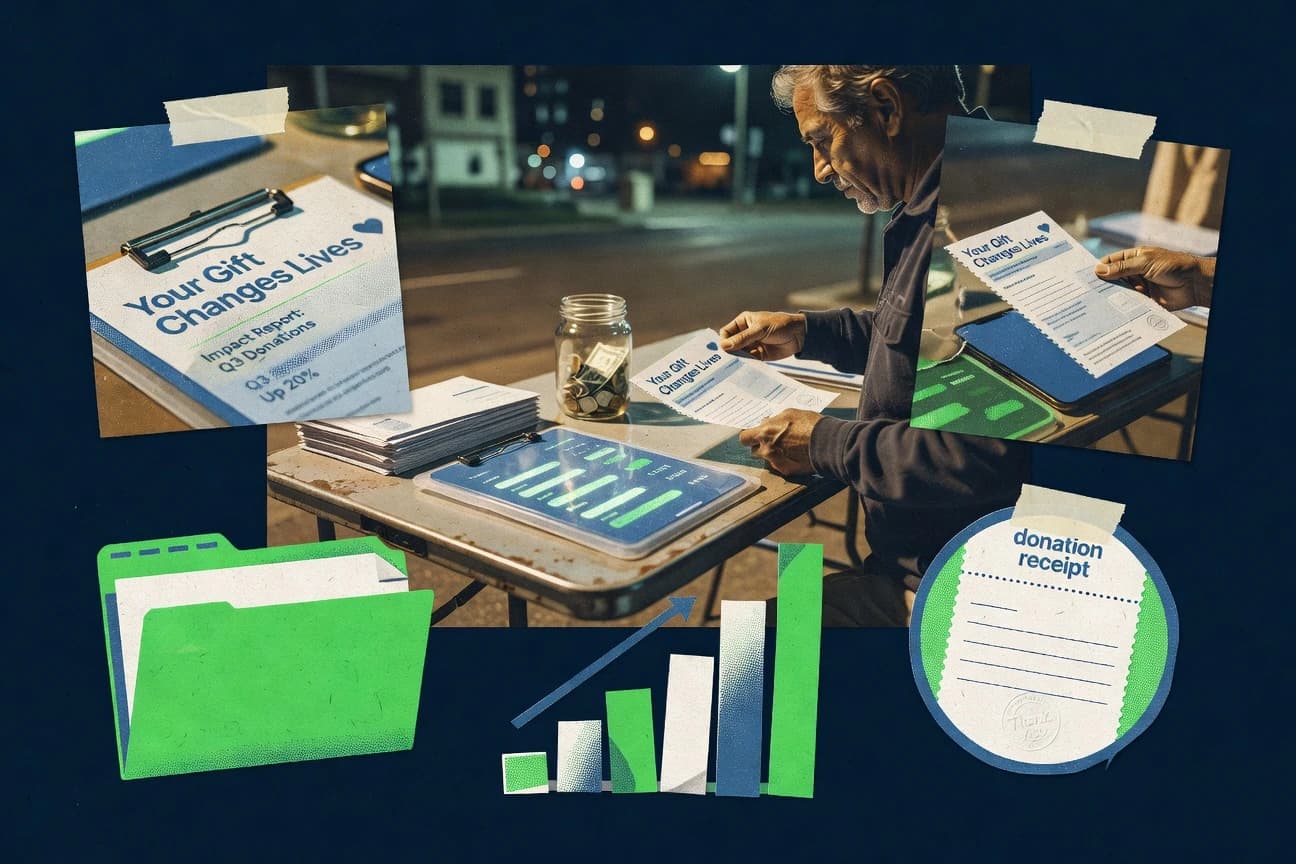
Nonprofit Marketing Statistics
Nonprofit marketing is moving online fast, with 87% using websites and 89% saying social media matters, yet many teams still report gaps like 33% saying their marketing strategy is ineffective and 31% lacking a clear digital advertising budget. Email and impact are where donors start to respond, including a 33.0% average open rate in 2023 and 55% of donors saying they would give again after an impact report, so this page shows exactly which channels and metrics are doing the work and where nonprofits are getting stuck.