GITNUX MARKETDATA
Browse Our Category
Military Defense
Latest update:


Taiwan Defense Industry Statistics
Taiwan’s defense industry picture is changing fast, with 2026 export orders outpacing prior expectations and 2025 contract awards building a clearer pipeline from procurement to production. See how the mix of major programs and shifting partner demand is reshaping where Taiwan’s suppliers are winning, and what that means for the next round of manufacturing capacity.

Hungary Defense Industry Statistics
Hungary’s defense spending choices in 2024 are strikingly operational, with 64.7% of the budget tied to operating costs while only 2.2% of GDP is targeted for defense the same year. The page connects this squeeze to real industrial capacity signals, from the Zrínyi 2026 modernization envelope of about HUF 1,500 billion and roughly €1.9 billion in Patriot-related air defense capability through 2022–2024, to workforce and R&D momentum that jumps 18% from 2021 to 2023.
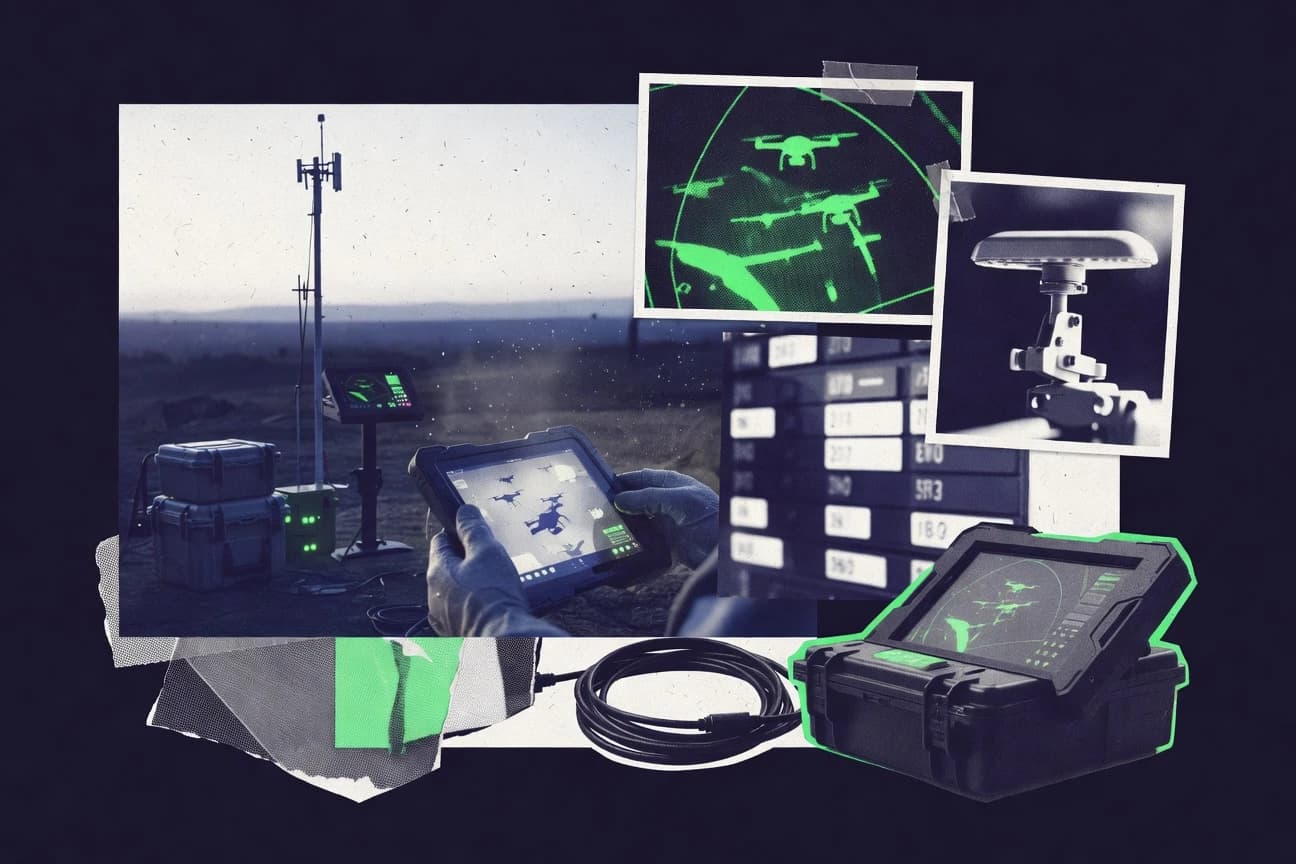
Counter-Uas Industry Statistics
The Counter UAS Industry dashboard brings the 2026 numbers into focus, showing how rapidly real world detection and disruption are tightening against the pace of evolving threats. You will see the contrast between what operators reported achieving and what that still leaves exposed, so you can judge where investment and capability gaps are most likely to emerge next.

French Defense Industry Statistics
France is raising the stakes for defense industrial capability with a €40 billion 2024 to 2030 major defense programs procurement baseline and defense spending planned to climb by €50 billion by 2024 versus the 2017 objective. The same page puts the spotlight on 2023 delivery momentum and the human skills gap too, from 36 Rafale aircraft delivered to 4,200 cybersecurity job vacancies and a 9% hiring share for cyber roles.

Sweden Defense Industry Statistics
Sweden Defense Industry stats put hard figures on a sharp shift in 2025, showing how procurement, exports, and production priorities are moving faster than the public conversation. See which categories are growing quickest and where the momentum is slowing, so you can separate headline noise from what’s actually changing.

Ammo Industry Statistics
With the U.S. aiming to boost 155mm output to about 20,000 rounds per month by 2025, Ammo Industry statistics track how procurement funding and production bottlenecks collide with component realities like lead, brass, and energy driven costs. The page also connects 2022 trade and domestic value added to concrete capacity risks highlighted by GAO and QA requirements tied to lot acceptance, aging tests, and storage performance.

Female Veterans Statistics
Female veterans make up 2,132,860 people in the US and are 9.7% of all veterans, with a median age of 48 years that shapes everything from disability and healthcare needs to work, family, and housing. This page brings those details together in one place, including sharp disparities like 15.3% of female veterans with 50% or higher service connected disability, alongside the lived realities behind the numbers.

Turkish Defence Industry Statistics
See how Turkey’s defence industry numbers are shifting, from production scale to export momentum, and why the 2026 snapshot looks tougher and more competitive than the years before it. This page connects the latest figures behind Turkey’s expanding output, revealing where growth is accelerating and where margins are getting squeezed.

Romania Defense Industry Statistics
Romania’s defense industry is moving fast, with 2026 figures already pointing to a clear shift in procurement and production priorities. See how the latest totals compare with the previous baseline so you can spot what is changing and what is not.
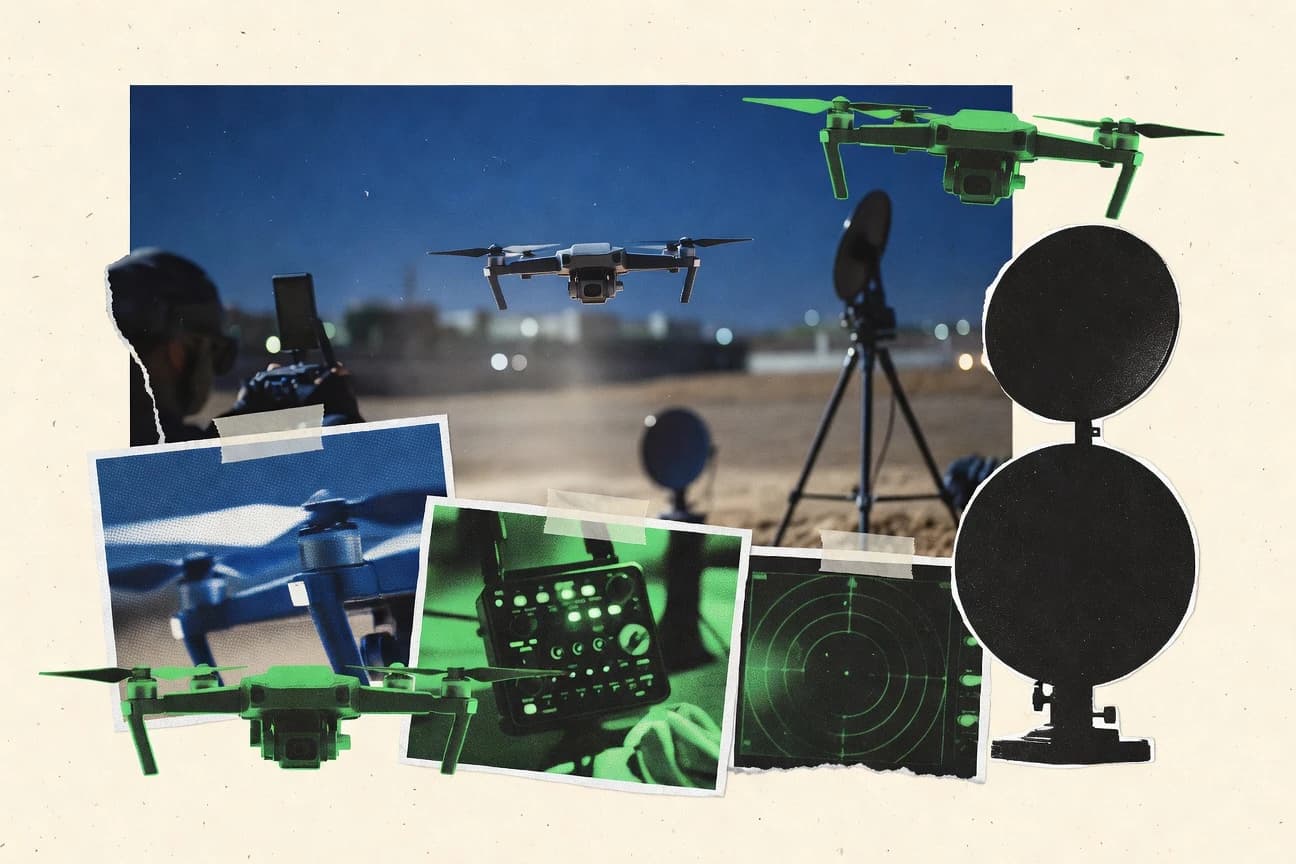
Counter-Drone Industry Statistics
Counter drone markets are scaling fast, with the global counter drone sector projected to jump from $1.9 billion in 2023 to $6.6 billion by 2030 as counter UAS spending climbs in parallel to $8.4 billion by 2030. Read how the US alone logged 10,246 detected and tracked UAS incidents, while procurement and performance benchmarks from detection ranges to neutralization timelines reveal why keeping sensors calibrated and networks interoperable can make or break counter drone effectiveness.

Eu Defense Industry Statistics
No single headline captures how fast European defense industry priorities are shifting, but the 2026 figures do. From procurement momentum to production capacity signals and spending pressure points, these EU Defense Industry stats reveal where the real change is happening and where it is still lagging.

Italy Defense Industry Statistics
Italy’s defense industry numbers for 2025 show where the money is actually going, with a clear shift in procurement and industrial output that separates talk from capacity. Don’t just look at totals, follow the changes behind the latest figures to see which segments gained momentum and which stalled.

Turkey Defense Industry Statistics
Turkey’s defense industry is showing momentum in 2025 and 2026, with output and capability numbers that look markedly different from the slower baselines people expect. Get the key indicators behind Turkey’s shifting spending, procurement, and production performance so you can see what changed and why it matters.

M&A Defense Industry Statistics
By 2025, the Defense Industry is becoming harder to defend in deal rooms, with major shifts in M&A activity and pricing that signal where leverage is moving next. Read the page to see how fast consolidation dynamics changed and which 2025 indicators insiders are using to challenge hostile interest.

Uk Defence Industry Statistics
See how UK defence industry performance is shifting in 2026, with new figures on production, jobs and supply chain pressure that look very different from the previous year. If you have a stake in procurement, investment or manufacturing capacity, these statistics explain what is changing and where the strain is likely to land next.

Gaza War Statistics
The latest Gaza War statistics page tracks the sharp swings in civilian impact and displacement, including the 2026 data point that shows what is changing right now instead of what happened last year. Read it to see how the numbers move across time and what those shifts suggest about the scale and pace of harm.

Russia Defense Industry Statistics
Russia Defense Industry statistics capture how procurement, production, and export momentum are shifting toward 2026, revealing a defense buildup that looks faster on some metrics than on others. See where the strongest 2025 and 2026 figures rise, and where they stall, so you can spot the pressure points behind the numbers.

Nato Defense Industry Statistics
NATO Defense Industry performance is showing a sharper split than many expect with 2026 orders and production activity moving in different directions. This page ties together the latest procurement, industrial output, and delivery timelines so you can see what is accelerating, what is slipping, and why that matters for readiness.

Swedish Defense Industry Statistics
A sharp look at Swedish Defense Industry, where the most recent figures point to a visible shift in delivery pace and production capacity by 2025. See how those changes stack up against the year before and what that means for Sweden’s next procurement decisions.

Military Sexual Assault Statistics
Military Sexual Assault statistics don’t just document what happened, they show how widely the problem persists even after reporting pathways were meant to improve safety, with 2025 figures that sharpen what many service members still feel in their day to day reality. Read this page to see the most current counts, the gaps between reported and unreported experiences, and what that contrast means for prevention and accountability.