GITNUX MARKETDATA
Browse Our Category
Military Defense
Latest update:


Private Military Statistics
This private military statistics page tracks who pays, who profits, and who gets deployed, from $15B in State Department WPPS II awards to Academi’s $92M 2021 contract and Booz Allen’s $10B NSA cyber ceiling in 2023. It also contrasts the scale with the human cost, including 1,225 contractor deaths across Iraq and Afghanistan from 2001 to 2020, and the reality that PMCs take about 40% of DoD contracts above $100M each year.

Israel Iran Strike Statistics
With no Israeli deaths from direct Iranian strikes in 2024, this page tracks how missiles still translated into real injuries and fatalities, from a Bedouin girl critically hurt by April shrapnel to a woman killed in the West Bank. It also weighs the scale of what was fired, with April and October barrages of hundreds of projectiles and near total defense reliance, against the human cost claimed through Iran proxy conflict including 500 plus Hezbollah fighters killed since Oct 2023.

China Military Statistics
China’s force numbers look tightly balanced yet strategically different, from a PLAAF fleet of 3,309 aircraft including 200-plus J-20 stealth fighters and 250-plus H-6 bombers to a land arsenal of over 5,000 MBTs and 3,245 self-propelled artillery pieces. If you want one page that ties air defense, drones, and nuclear delivery capacity to hardware scale and readiness, this current 2025 modernization snapshot and 2023 budget context make the contrast impossible to ignore.

China Navy Statistics
With 3 carriers already in service and more heavy hitters on the way, China’s naval buildout looks less like steady growth and more like a direct push toward carrier aviation at scale, including 300 plus carrier capable aircraft projected by 2030 and 80,000 ton Fujian commissioning with EMALS catapults. This China Navy statistics page also stacks the rest of the force behind that focus, from 200 plus auxiliaries and 60,000 plus amphibious lift plans to 300 plus day underwater endurance and integrated modern shipborne EW across most new hulls.

Taiwan Invasion Statistics
A Taiwan invasion is modeled as a simultaneous shock to chips, cash, and cities with 2025 Bloomberg shutdown analysis pegging semiconductor losses at $1 trillion each year and Rand estimating a $10 trillion world economy hit in year one. It also stacks the operational costs, from CSIS wargames that place Taiwan at roughly 20 percent air readiness within days and a 9 percent US inflation spike tied to chip shortages, so you can see how quickly military timelines turn into global economic ones.

Middle East Conflict Statistics
With Gaza deaths now topping 41,000 and injuries reaching about 93,000 since October 7, 2023, the page tracks the grim arithmetic alongside the scale of displacement and broken services, including 500,000 people at famine-level risk. It also sets the Gaza toll against Lebanon and wider regional spillovers, where more than 2,300 Lebanese civilians have been killed and 93,000 Palestinians injured, showing how fast one conflict becomes a whole geography of strain.

Hypersonic Weapons Statistics
See how the hypersonic race is shifting in 2025 with planning and procurement that could lock in new competitive edges, from France’s €3.8B budget for 2023 to 2030 and the Australia HIFiRE program reaching Mach 8 in 2017 to Russia’s Avangard deployed to the 13th Missile Division. The page pairs hard performance contrasts like Avangard Mach 20 to 27 maneuvering and Zircon’s reported 1,500 km class range with the unglamorous reality of test cadence and failures, including ARRW’s Sep 2021 booster setback.
Turkey NATO Statistics
Turkey’s NATO snapshot puts hard capability against hard constraints, from 2,231 tanks and 206 F-16s to 16 submarines, while air defense priorities show a sharp tension with just four S-400 batteries acquired and Patriot PAC-3 seeking no delivery. It also links today’s readiness to budgets and manpower, with defense spending hitting $15.8 billion in 2022 and a second-largest standing force in NATO with 355,200 active personnel, plus Bayraktar TB2 exports and domestically planned Altay and TF-X programs shaping what comes next.

Iran Nuclear Program Statistics
See how Iran’s centrifuge buildout and stockpile growth moved from gradual enrichment to near weapons grade momentum, including 5,473 advanced centrifuges enriching as of August 2023 and a 60 percent HEU stockpile of 144.8 kg (hex) by May 17, 2023. The page connects the plant level changes at Natanz and Fordow to safeguards and verification friction, showing why IAEA access gaps and production scaling now sit uncomfortably close to breakout estimates.

Tactical Nuclear Weapons Statistics
See how 2024 estimates place Russia at about 1,912 non strategic warheads while the United States holds roughly 230 tactical nuclear weapons, then trace that gap to delivery details like B61-12 hosted in Europe and W76-2 on Virginia class submarines. You will also compare striking accuracy and yield contrasts, from 10 meter precision F 16 delivery to Iskander M options and low yield W76-2 settings, alongside the major treaties and removals that reshaped today’s tactical count.

Israel Defense Industry Statistics
Israel’s defense industry is forecast to keep widening its economic footprint, with defense-related output already driving 25% of manufacturing GDP and creating 250,000 indirect jobs, plus a 30% surge in TASE defense stock performance in 2022. From record exports reaching $12.5 billion to R&D intensity at 8.5% of defense sales and local production cutting IDF costs by $5 billion a year, the statistics page shows how Iron Dome components, drones, and munitions translate into both national security and measurable growth.

Military Recruiting Statistics
With FY2023 shortfalls spreading across services despite a still massive DoD recruiting effort, the Army missed its target by 15,000 and the overall active and reserve accessions still topped 150,000, while waivers, disqualifications, and recruiter capacity are quietly reshaping what “success” looks like. This page puts the fulfillment gaps, the marketing push, and the quality tradeoffs side by side so you can see exactly why the pipeline is struggling even when the budgets and impressions are rising.

Greece Defense Industry Statistics
Greece’s defense industry is spending at NATO-mandated pace and scaling local capability alongside it, with 2024 targets at 3.5% of GDP and planned spending of about 7.2 billion euros tied to advanced procurement like F 35 planning. From 8.2% of defense sales going into R and D and major missile and naval technology work to 45,000 defense related jobs in 2023 plus arms exports rising to 1.1 billion euros in 2023, the page maps how money, manufacturing, and upgrades are reshaping Greek power projection.
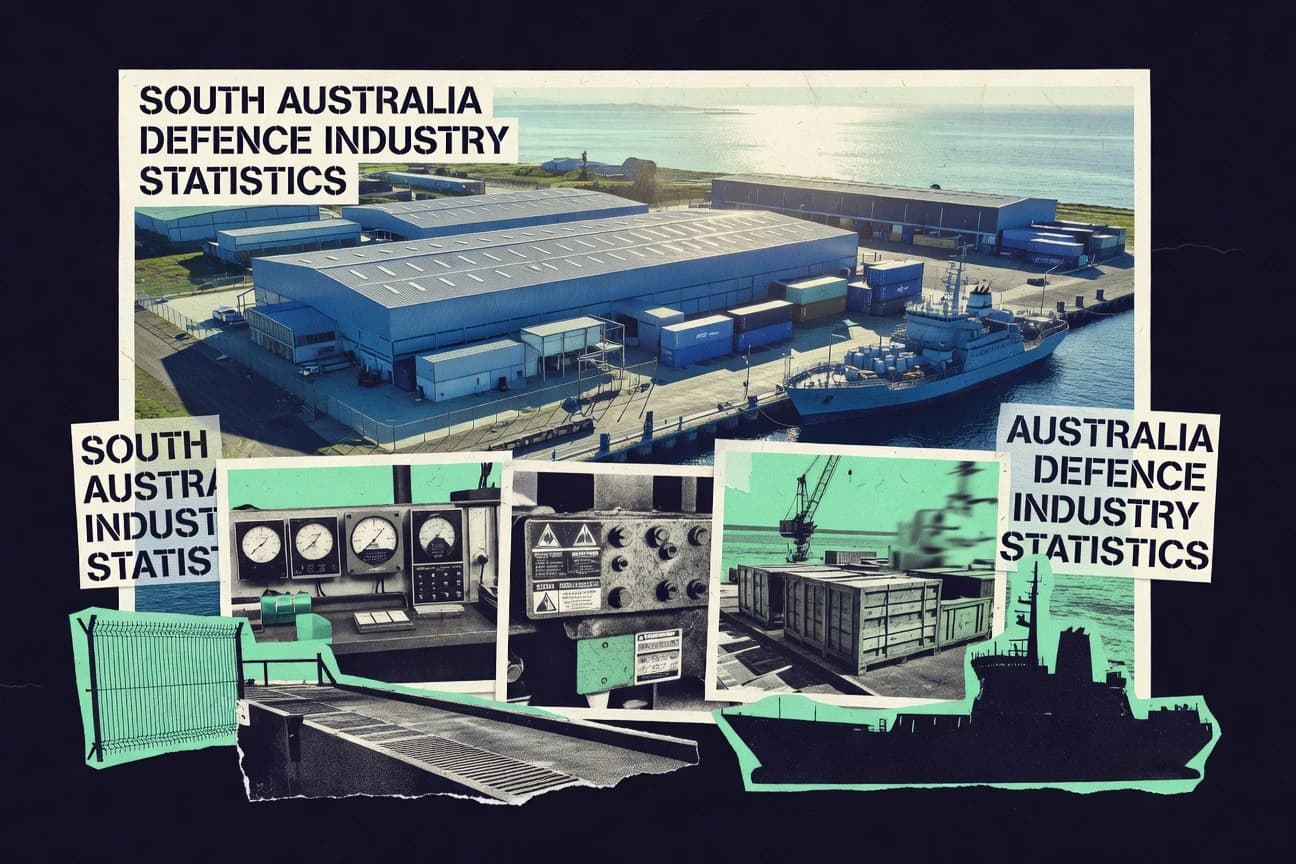
South Australia Defence Industry Statistics
South Australia’s defence industry pumps $12.4 billion a year into state output, with $1.2 billion in defence exports and $3.5 billion in contracts awarded to local businesses still pulling economic weight. Behind the headline growth, the state’s multiplier effect lifts $2.80 per direct dollar into 45,000 indirect jobs, while defence R and D reaches $450 million in 2023 and the AUKUS submarine pipeline adds a projected $2.3 billion GDP uplift over the decade.

Germany Defense Industry Statistics
Germany’s defense industry is scaling fast, with €35 billion in orders in 2023 up 40 percent on Ukraine-driven demand, while total turnover sits at €60 billion after a 10 percent jump to 2022. Follow the details from Rheinmetall’s defense sales surge to €7.2 billion and a 70 percent share of the €47 billion Bundeswehr procurement budget flowing into industry contracts, and you will see how Germany’s supply chain, jobs, exports, and R&D are tightening together.

Nuclear Weapons Statistics
As of 2023, the world holds 12,121 nuclear warheads in military inventories, split across deployed strategic forces and thousands of additional reserves, with Russia at 5,580 and the United States at 5,044. The page pairs that stockpile math with the hard constraints of delivery systems and nuclear test and treaty history, so you can see how weapons count, warhead types, and verification regimes shape what deterrence and risk actually look like.

Czech Defense Industry Statistics
With 35,000 people directly employed in Czech defense manufacturing in 2022 and 2023 exports still stacking up, this page tracks how rockets, radars, ammo, and aircraft translate into real market presence, including $800 million of NATO bound ammunition in 2023 and radar deliveries to 12 allies totaling $120 million from 2021 to 2023. It also connects production scale to pressure on people and capacity, from 7,000 R and D engineers to a workforce that stays large enough to ship thousands of rifles and armored vehicles while Czech arms exports reached $2.16 billion in 2022.

Eu Defence Industry Statistics
EU defence work still pulls toward scale and speed as 620,000 direct jobs in 2023 sit alongside 1.2 million indirect roles in the supply chain and €12.5 billion in defence R and D. From women at 18% and 35,000 apprentices to export earnings of €85 billion in 2023 and a €250,000 average turnover per employee, the page charts how staffing, production and funding are reshaping capability across the EU.
Obama Drone Strikes Statistics
How many people did Obama era drone strikes actually kill and how much of that toll was civilian. Across Pakistan, Yemen, and Somalia, estimates run up to 806 total civilian deaths and 384 to 807 civilians in Pakistan alone, while strike counts and casualty shares shift in ways that do not match the usual militant only narrative.

Serbia Defense Industry Statistics
With 2025 level clarity into Serbia’s defense output, the page connects sharp production milestones like Utva’s 25 Super Galeb modernizations and Sloboda Uzice’s Nora B 52 howitzers to the less visible ecosystem behind them, including a workforce of 25,000 across 2023. If you only know Serbia for export headlines, the surprise here is how quickly ammunition scale, missile and UAV upgrades, and growing employment footprint move together.