GITNUX MARKETDATA
Browse Our Category
Military Defense
Latest update:

Ukraine Russia War Statistics
Russian losses are pegged at about 650,000 killed and wounded since the full scale invasion, while Ukraine reports 67,000 soldiers killed and 130,000 wounded by December 2024 and civilian deaths reach 12,162 by October 2024. Track how confirmed battlefield damage, global economic shocks, and the widening humanitarian toll add up against each other as the war grinds on.
Ukraine Defense Industry Statistics
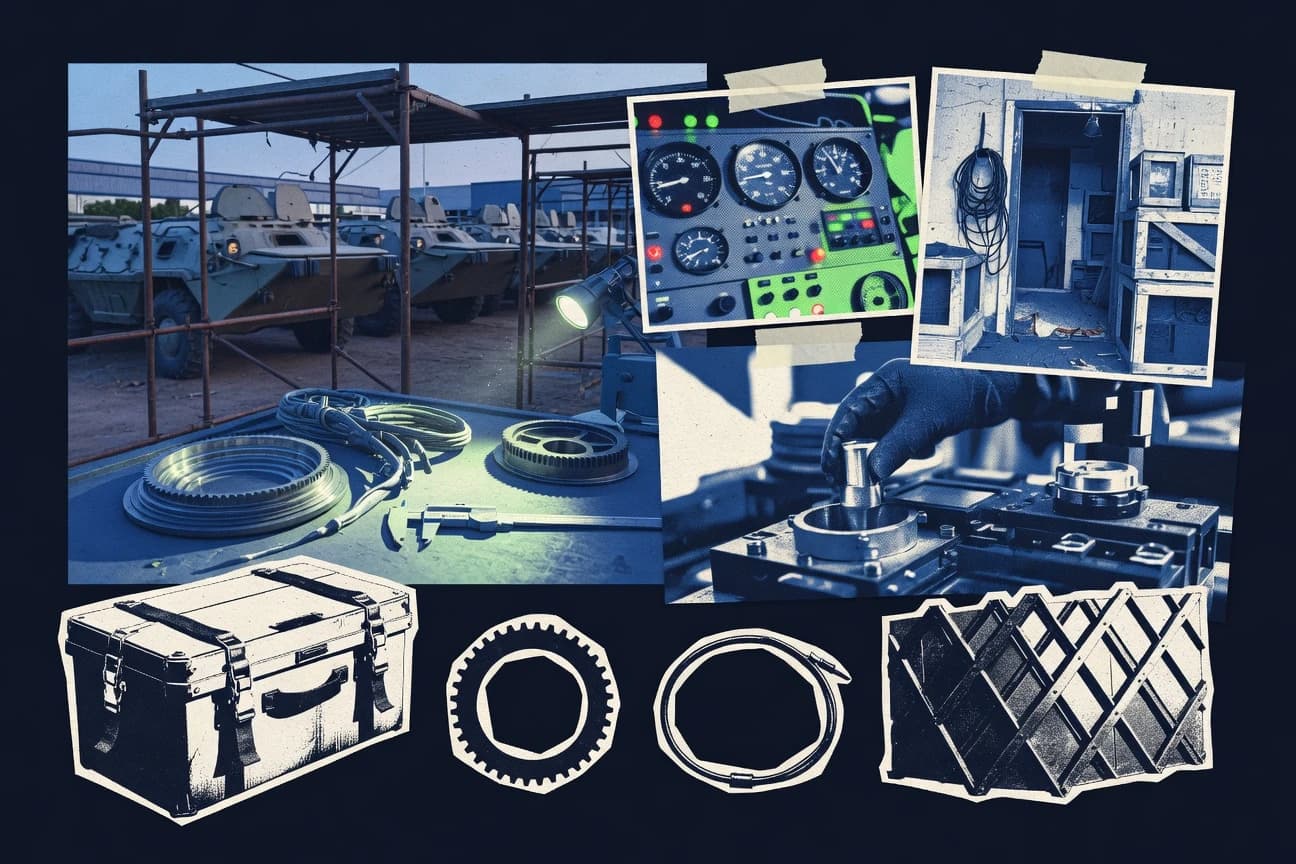
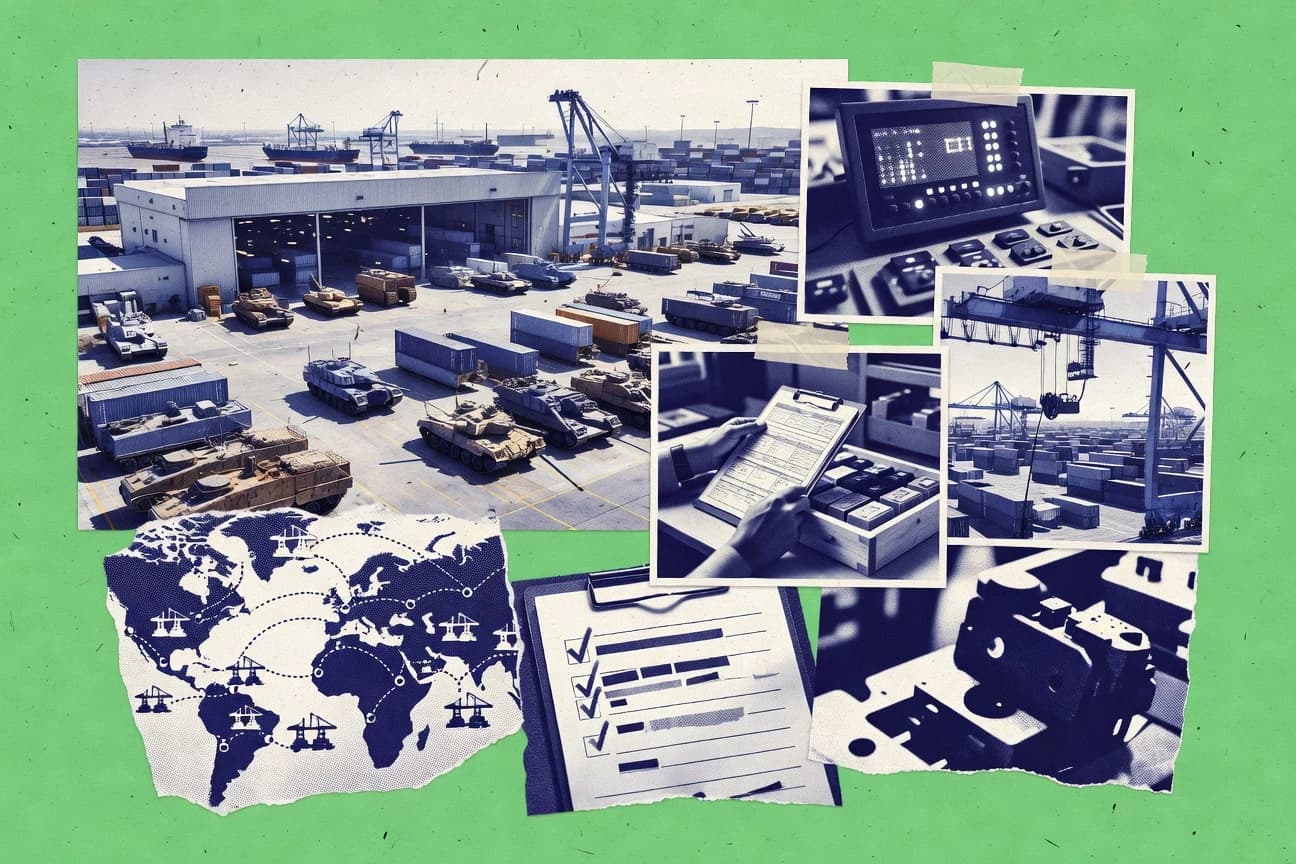
Ukraine’s defense industry posted $2.5 billion in 2023 revenue and is scaling faster than the supply lines around it, from 200,000 155mm shells shipped to EU partners to $500 million export contracts for ammunition across the Middle East. The page tracks the full pipeline, from drones and missiles to tanks and machine guns, plus the people and R and D surge that helped keep output moving as 2024 procurement and production capacity ramps up.
Uk Defense Industry Statistics
With the UK defence sector generating £52 billion in ADS turnover estimates for 2023, this page weighs that momentum against what it actually delivers on the ground, from £25.6 billion in total GVA in 2022 and 323,400 jobs to £11.3 billion of defence exports and a £14.5 billion GDP multiplier from spending. It also maps where the money goes next, including £24.1 billion of MoD equipment activity in 2022 to 2023 and industry R and D intensity, plus who benefits across primes, SMEs and regional clusters.
War Statistics
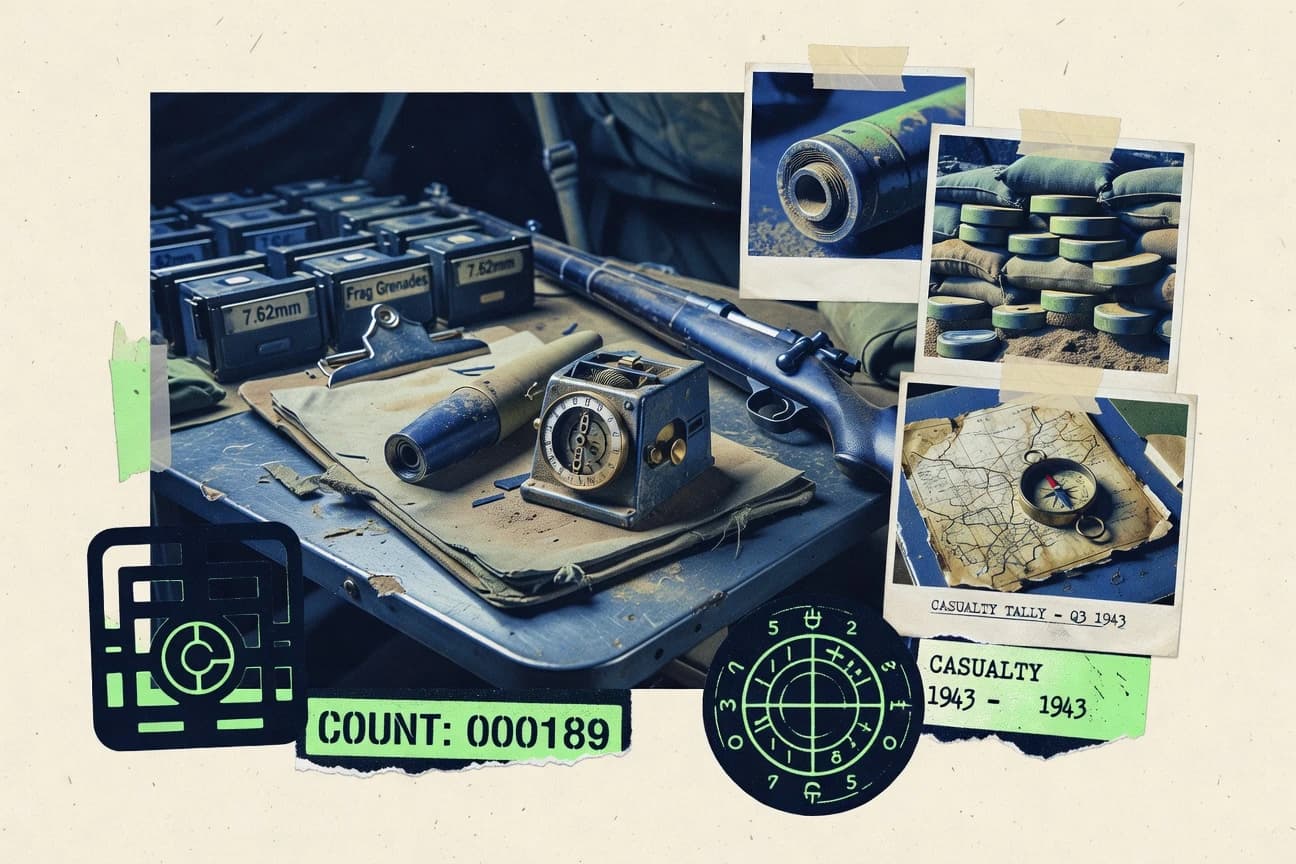
From the 120mm cannon reach of a US M1 Abrams to the 80 km rockets of HIMARS used in Ukraine since 2022, this page lines up battlefield capability and real-world consequences side by side, including 270+ Stinger kills in Afghanistan and Javelin’s 94% hit rate in Ukraine. It also compares staggering program and human costs, from the $428 billion F-35 lifecycle to WWII death totals in the tens of millions, so you can see how “range and precision” translate into outcomes.

Armored Car Industry Statistics
BAE Systems led armored car market share with 18% in 2023 while cash in transit still drove 42% of industry revenue in 2022, creating a sharp split between who sells platforms and who wins recurring missions. See how 2023 contract and production totals add up alongside security pressure, including 1,250 US armored car heists, 4,200 global vehicle thefts, and rising GPS cyber disruption cases.

Poland Defence Industry Statistics
Poland’s defence industry workforce surged to 92,000 in 2023, up 15 percent as war production ramps, with PGZ alone employing 40,000 and a fast moving mix of engineering, UAV R and ammunition scaling. Exports also accelerated, climbing to $1.8 billion in 2023, so this page charts how Poland turns factory capacity and R&D spending into real orders for Krab, Rak and beyond.
Global Defense Industry Statistics
Global military outlays climbed to $2,443 billion in 2023 and the US alone accounted for 37% at $916 billion, while defense revenue and R&D keep pace, including $142 billion in global defense IT spend and $108 billion in defense R&D. Track how the industry scales from jobs and arms exports to next wave markets like AI in defense and hypersonics, where winners are shaped as much by supply chain capacity and investment velocity as by battlefield demand.
AR-15 Industry Statistics
See what changed in 2025 and what it suggests about the next shift in AR 15 demand, pricing, and production, not the headline averages people expect. AR-15 Industry breaks down the latest figures so you can spot whether momentum is strengthening or cooling before the market redraws the rules.

Obama Drone Strike Statistics
Between 2009 and 2016, Obama era drone strikes in Pakistan, Yemen, and Somalia involved 563 strikes total, yet reported civilian death estimates range wildly from 12 to 4,026 across studies, with TBIJ confirming 28 Pakistan strikes with civilian deaths and critics putting civilian casualty rates at roughly 10 to 20 percent. The page tracks the sharp contradiction between official US and Pakistan tallies and findings from organizations such as TBIJ, Amnesty, and HRW including Pakistan’s North Waziristan, where 365 of 430 strikes concentrated, and Yemen where HRW documented civilian deaths in multiple attacks.

Turkish Defense Industry Statistics
Turkey’s defense and aviation exports hit $3.2 billion in 2022, but the quieter engine behind that surge is harder to spot without the details on R&D depth, from ASELSAN’s 1,000 plus R&D personnel to Turkey’s 98,000 R&D staff. See how SSB procurement and its 400 plus offset projects by 2021 feed a 1,700 plus company and university collaboration network while Bayraktar TB2 and HİSAR capability targets add a battlefield reality check to the figures.

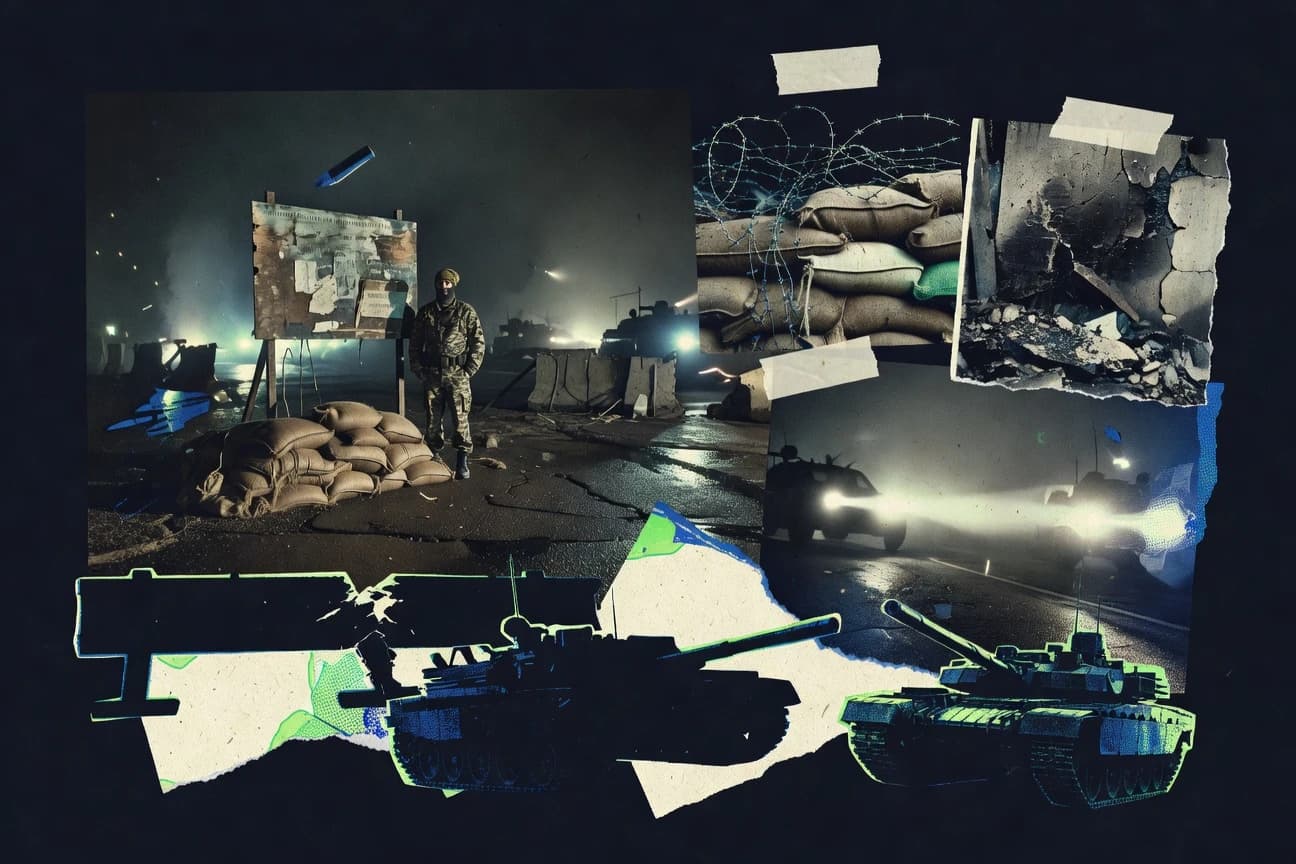
War In Ukraine Statistics
Ukraine’s humanitarian and economic toll is still staggering even by the latest tracked figures, from 8,911 civilian casualties including 1,000+ children to 3.4 million people needing urgent help in 2023. At the same time, the war reshaped far more than front lines, with power and food systems strained and Black Sea shipping volumes dropping by about 80 percent, making the monthly casualty peaks and global ripple effects impossible to ignore.
Türkiye Defense Industry Statistics
Türkiye defense industry keeps scaling, with employment reaching 132,000 overall in 2023 and a clear R&D pull from major firms like ASELSAN, which grew its R&D staff to 5,000. The page sets the export picture against the workforce one, from drone output and radar revenue to localization gains, showing how capabilities are expanding faster than headcount on the surface suggests.
Saudi Defense Industry Statistics
Saudi defense localization is moving from target to requirement fast with 50 percent by 2030 and local content embedded in at least 45 percent of contracts under the National Industrial Strategy, while the 2023 defense market is estimated at 13.6 billion with military spending up 12 percent year over year. Track how Najran sustainment and HALCON’s expansion sit alongside export ambitions of 4 billion by 2030, and why the wider resource and logistics metrics from oil rents to port coverage matter for what can be produced, sourced, and maintained at scale.

Defense Statistics
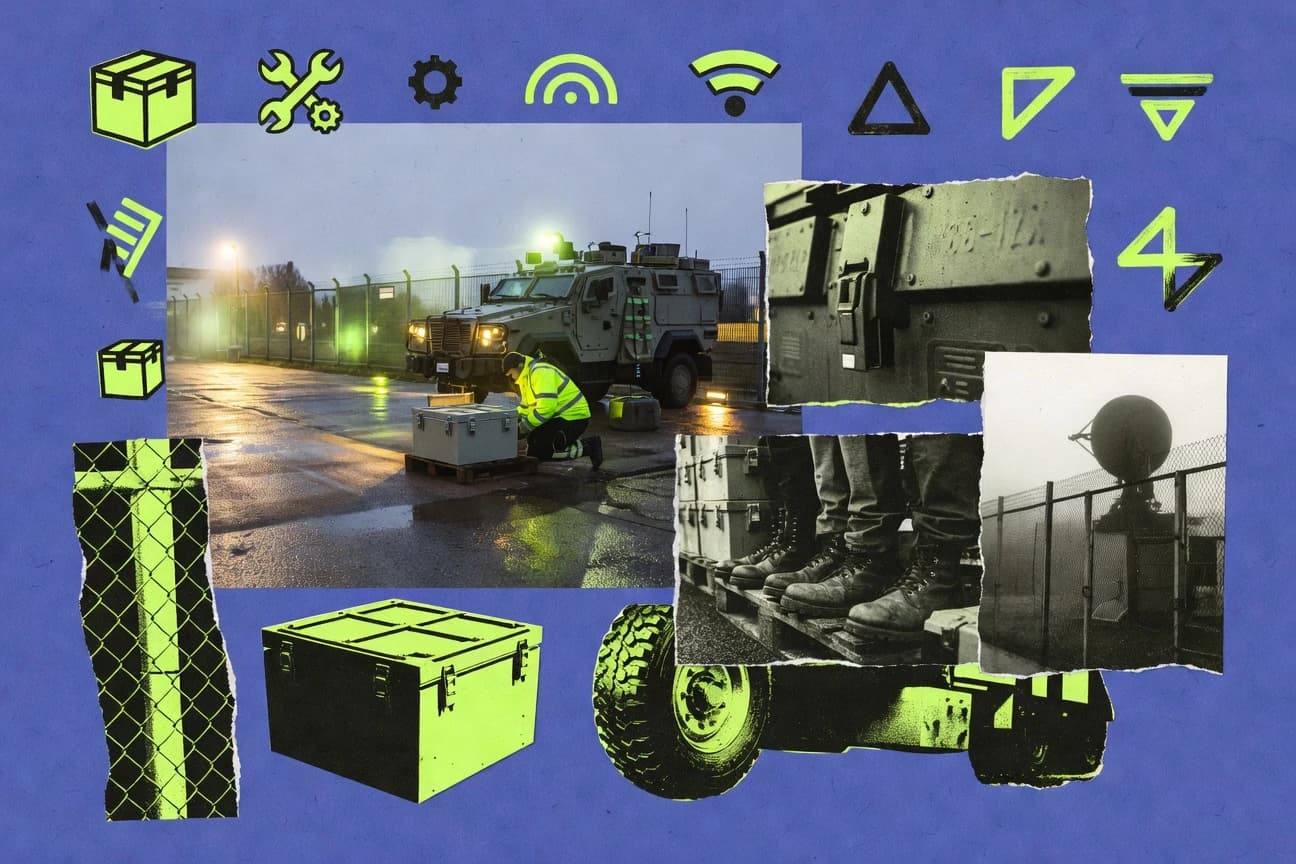
With AI, cloud, and cyber risks rising as fast as procurement momentum, you will see how 63% of defense officials expect AI to shape future force design alongside 90% of organizations reporting a cloud security incident and 2,300 plus CVEs published in the last 12 months of 2023. The same page traces the money through near term buying and modernization at scale, from a $56.9 billion FY 2024 DoD procurement topline and $2.0 billion for space launch obligations to major NATO and US industry capacity, then connects it to stabilization pressures with $4.6 billion in 2023 military assistance to Ukraine.

European Defence Industry Statistics
European defence budgets are still largely awarded at home, with 70% of procurement value staying nationally rather than becoming truly cross border, even as €30.0 billion is earmarked for the European Defence Fund across 2021–2027 and NATO members plan €40.0 billion of defence investment at European level in 2024. The page sets those procurement frictions against industrial scale ups like ASAP’s €2.0 billion planned support and ammunition and missile production funding worth €1.7 billion under EDIRPA, so you can see where policy ambition meets delivery capacity.

Polish Defense Industry Statistics
PLN 186.5 billion is now on the table for Poland’s 2024 defense budget proposal, pushing spending toward 4% of GDP while R&D, cyber defense, and domestic production scale fast enough to keep up. See how a 73% modernization jump and a surge in exports sit alongside a tight procurement debt picture and a rapidly expanding defense workforce, turning policy commitments into measurable industrial output.

Brazil Defense Industry Statistics
Brazil’s defense procurement is still pulling in US$2.3 billion of military equipment imports in 2023, with aircraft and airframe parts the most concentrated at 18.7%, even as local-content rules gradually reshuffle the supply chain and services now account for R$3.2 billion. See how contract execution, sustainment readiness, and R&D funding are moving together, including cyber and electronic warfare investment and domestic qualification milestones that reveal whether Brazil is closing dependency or simply shifting it.

Us Defense Industry Statistics
Soaring defense procurement scale meets rising scrutiny, from a 3.1% inflation adjusted jump in FY2023 procurement costs to 14% of contract audits flagging pricing discrepancies or noncompliance that lead to questioned costs. You will also see why software sustainment is becoming the budget pressure point, with 67% of DoD buyers reporting increasing software support needs and an estimated up to $100 billion lifecycle cost risk tied to security failures.

Indonesia Defense Industry Statistics
Indonesia’s 2023 defense budget reached IDR 138.8 trillion, and real spending rose 4.2% after inflation adjustment, while imports still covered 85% of procurement value. The page connects that tension to what the defense industry is building at home, from PT Pindad and PT PAL production outputs to IDR 800 billion in defense industry development funding and the people behind it, including 85,000 workers across state firms.

Korea Defense Industry Statistics
South Korea is turning defense budgets into engineering output at a measured pace with defense R&D intensity at 4.0% in 2022, yet it still sustains momentum across the supply chain from a 6 to 8% defense segment revenue CAGR in 2020–2023 to 155mm artillery shell export contracts worth over $1 billion through 2023. Follow how 34,000 cybersecurity workers and a projected $20.2B global defense AI market by 2028 meet real industrial scale, from 10,000.0+ domestically produced missiles and munitions in 2023 to KRW 530 billion earmarked for MRO and sustainment in the 2024 acquisition plan.