Market data
Manufacturing & Engineering
Explore manufacturing & engineering statistics and market research reports with sourced data and trend analysis.
Latest update:
 Ryan Townsend


Statistics · 2026
Korea Materials Industry Statistics
Korea Materials Industry shows how 2023 battery materials reached $22.0 billion while advanced materials R and D kept rising, and how policy pushes demand from 45.0 GW renewable additions by 2030 and $6.1 billion green hydrogen investment. You can also compare pressure points like energy costs named by 18.6% of material firms and a 38% cut in critical chemical procurement lead times, alongside 74% digital twin adoption and robotics uptake that are reshaping how fast Korea’s plants run.

Statistics · 2026
Industry 4.0 Statistics
Cybersecurity has become an operational requirement, with 74% of organizations flagging it as a major concern for OT deployments, even as robotics and connected operations keep accelerating. From 12% annual growth in industrial robot installations to 6.2 billion projected IoT connections by 2027 and 84% using cloud for at least some workloads, the page ties these shifts to hard Industry 4.0 outcomes like up to 25% less unplanned downtime and faster, predictive decision making.

Statistics · 2026
Tempered Glass Industry Statistics
Tempered Glass Industry brings today’s most decision relevant figures together, from furnace temperatures up to 6,000–12,000°F and ASTM E1300 design strength calculations to the 69–210 MPa compressive stress layer that drives tempered glass safety fragmentation instead of sharp shards. You will also see how energy and demand pressures stack up through the projected $39.0 billion global flat glass market by 2031 and how cullet and quench cooling trade off fracture resistance, including the reported 15% to 25% gap versus annealed glass that engineers must account for in real building envelopes.

Statistics · 2026
Refractory Industry Statistics
See how refractory demand is being reshaped by a 6.0% CAGR forecast for the refractory materials market through 2032 and a projected USD 10.9 billion refractory ceramics market size by 2032, as steel and cement thermal stress, relining cycles, and corrosion mechanisms shift with every modernization push. The page connects market growth to hard furnace realities like 80% of blast furnaces needing periodic relining and insulation gains that cut thermal conductivity by 20 to 30%, so procurement and maintenance planning stop feeling like guesswork.

Statistics · 2026
Wide-Format Printing Industry Statistics
Wide-format printing is expanding faster than many expect, projected to reach USD 22.5 billion by 2030 at a 7.2% CAGR, with inkjet still driving 72% of market revenue and UV-curable ink set for an 8.2% rise from 2023 to 2028. See how demand is splitting across applications like signage at 40% and packaging climbing to 18% by 2023, while hardware and process shifts such as UV LED curing in 68% of sold printers and automation boosting productivity by 25% in 2023 benchmark results are reshaping what buyers prioritize.

Statistics · 2026
Packaging Industry Statistics
From active RFID tags surging 200 percent in US warehouses to antimicrobial films cutting contamination by 99 percent, this 2025 focused statistics page maps the shift from add on packaging tech to measurable outcomes like 40 percent faster robotized lines and 15 percent predicted waste reduction via IoT sensors. It also pulls in where consumer will meets hard constraints, such as AR apps reaching 50 million downloads in 2023 and only 9 percent global plastic recycling, so you can see which innovations are actually built for adoption.

Statistics · 2026
Pump Industry Statistics
Global industrial pump demand is being shaped by fast shifting inputs and tighter operating requirements, from 19.3 GW of utility scale solar PV added in 2023 to OECD forecasts of 3.5% year over year industrial output growth for 2024 and rising downtime cost pressure for critical pumps. Use this page to connect end markets like desalination and municipal upgrades with the standards and controls that govern head, efficiency, and energy use, including ISO 9906 testing acceptance and smart metering plans reaching 71% of utilities by 2025.

Statistics · 2026
Plastics Injection Molding Industry Statistics
With 2023 energy costs still consuming 30 to 50 percent of molding spend, this page maps the sharp shift toward efficiency, including a 22 percent carbon cut from all electric machines and 18 percent recycled resin use. You will also see what automation is really costing and paying back, from 18 to 24 month ROI timelines to 65 percent of firms citing sustainability as the top reason behind resin choices.

Statistics · 2026
Global Packaging Industry Statistics
Food and beverage packaging alone drives 55% of global demand, while the global market is forecast to rise from USD 1,023.84 billion in 2023 to USD 1,295.59 billion by 2028 at a 4.82% CAGR. This page links the headline growth with highly specific demand signals like e-commerce packaging up 28% YoY to $45 billion in 2023 and the sustainability push as 35% of packaging is now recyclable, giving you the clearest picture of where materials, formats, and regulations are colliding next.

Statistics · 2026
South Africa Steel Industry Statistics
South Africa’s steel industry still runs at industrial speed yet human signals show the pressure, from injuries at 1.2 per 100 workers in 2022 to fatalities falling to 3 in 2023, even as downstream and direct employment total 150,000 and 28,500 workers respectively. Track the same momentum in performance and planet metrics, including 18 million tonnes of CO2 in 2023 and a 92% scrap recycling rate, alongside cost and safety realities like a R15 billion wage bill and 45,000 strike days lost over wage disputes.

Statistics · 2026
Hydraulics Industry Statistics
Hydraulics are woven into everything from tower cranes over 100m and excavators with 92% penetration worldwide to medical beds where only 40% of adjustable models use hydraulics. With the global market forecast to reach USD 82.3 billion by 2030 at a 6.1% CAGR and smart, energy saving upgrades pushing adoption, this page highlights the sharp end use shifts and growth momentum shaping Hydraulics Industry procurement and design decisions.

Statistics · 2026
Packaging Glass Industry Statistics
From a 2021 EU glass packaging recycling rate of 76% and the policy pressure that aims for 75% recycling by 2030, this page tracks how circularity targets are reshaping everything from cullet demand to furnace energy and emissions. You will see how switching cullet levels can cut furnace energy by up to 10%, how recycled glass can lower global warming potential by 20% to 30%, and why the shift is showing up alongside cost, logistics, and plant quality metrics.

Statistics · 2026
Metal Industry Statistics
Steel use cooled globally to 1,745 million tonnes in 2022, yet India’s demand surged to 125 million tonnes and exports shifted fast, with China shipping 47.5 million tonnes while the EU slipped to 97 million. Track how each metal moved from production and jobs to carbon intensity and recycling outcomes, including 85% steel recycling and 2.0 billion tonnes of steel industry CO2.
Statistics · 2026
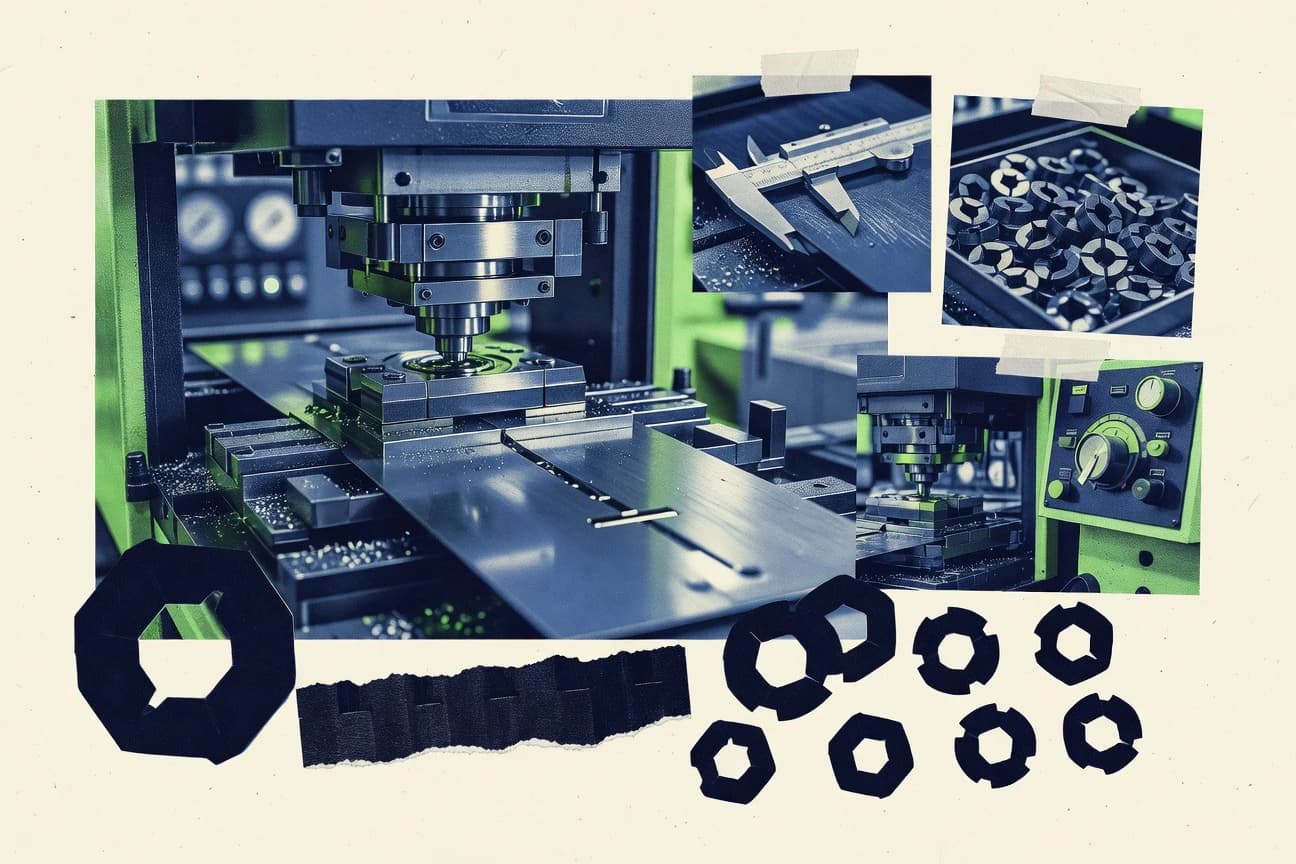
Stamping Industry Statistics
Find out why the U.S. press shop reality is tightening even as the global metal forming story grows, from a 3.2% YoY rise in metal input costs to 36% of manufacturers reporting supply chain disruption and 48% flagging labor availability as a constraint. The page also connects steel and energy drivers to throughput and quality, including 7% BEV share boosting lightweighting demand and robotics and connected inspection performance metrics such as computer vision catching 90% of defects in high speed sheet metal forming.