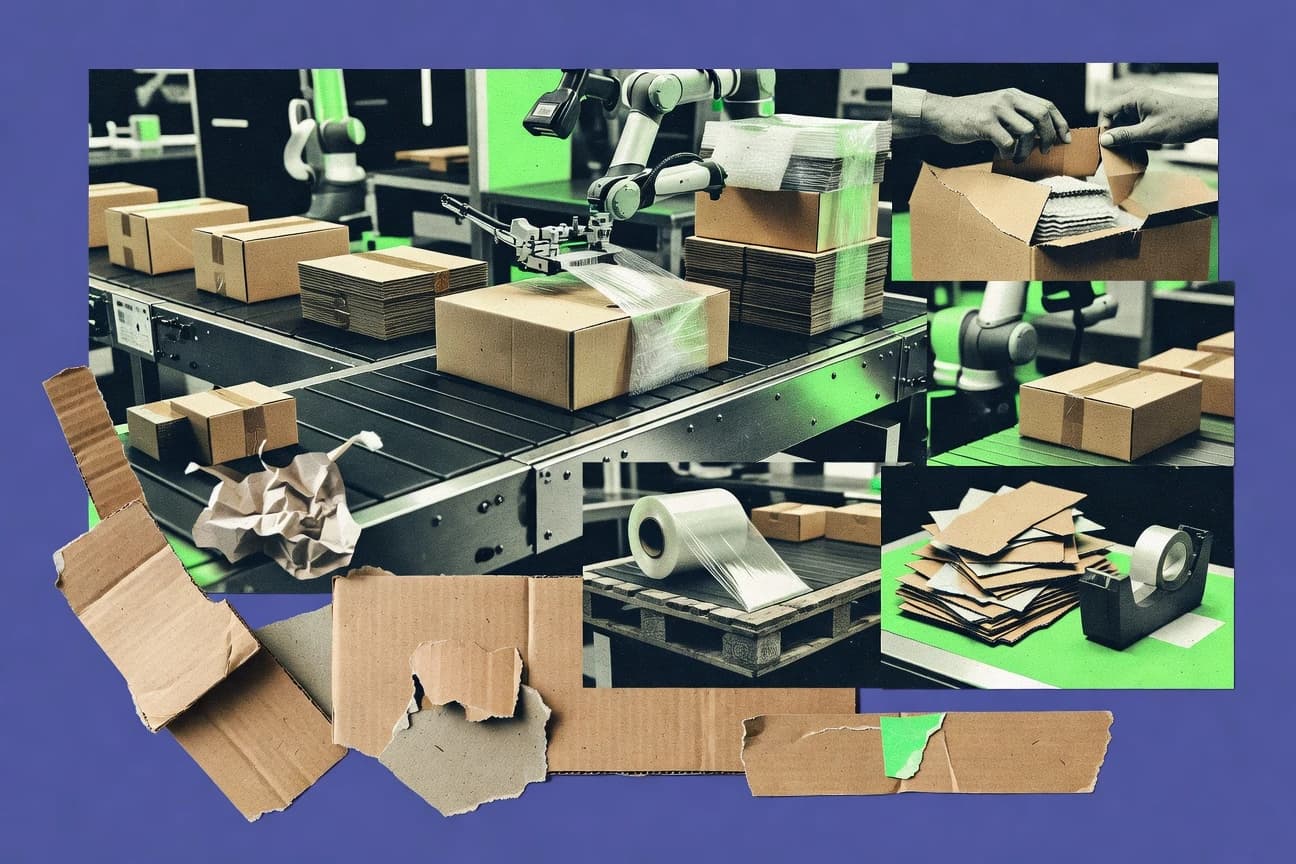
GitNux Logo
  • Editorial Process
Contact Us
Gitnux Logo
Contact Us
  • Home
  • Editorial Process
  • Contact Us
Gitnux Logo
  • Home
  • Blog
  • All Statistics
  • Services
  • Company
  • Privacy Policy
  • Contact
  • Partner
  • Careers
  • As Seen In

Our Services

Custom Market Research

Tailored research solutions designed around your specific business questions and strategic objectives.

Learn more →

Buy Industry Reports

Access comprehensive pre-made industry reports with instant download. Professional market intelligence at your fingertips.

Browse reports →

Software Advisory

Stop wasting months evaluating software vendors. Our analysts leverage 1,000+ AI-verified Best Lists to recommend the right tool for your business in 2–4 weeks.

Learn more →

Popular Categories

Ai In IndustryTechnology Digital MediaSafety AccidentsEntertainment EventsMedical Conditions DisordersMental Health PsychologyMarketing AdvertisingEducation LearningFinance Financial ServicesManufacturing EngineeringSocial Issues Societal TrendsPublic Safety CrimeHealthcare MedicineFood NutritionConsumer RetailHealth MedicineConstruction InfrastructureSports RecreationHr In IndustryDiversity Equity And Inclusion In IndustryGlobal Regional IndustriesBusiness FinanceCustomer Experience In IndustrySustainability In Industry

Find us on

Clutch · Sortlist · DesignRush · G2

GoodFirms · Crunchbase · Tracxn

How we make money

Gitnux.org is an independent market research platform. Primarily, we generate revenue on Gitnux through research projects we conduct for clients & external banner advertising. If we receive a commission for products or services, this is indicated with *.

© 2026 Gitnux. Independent market research platform.

Logos provided by Logo.dev

  1. Home
  2. Manufacturing Engineering
  3. Packaging Industry Statistics

GITNUXREPORT 2026

Packaging Industry Statistics

The global packaging market is large, growing, and increasingly focused on sustainable innovations.

130 statistics5 sections8 min readUpdated 20 days ago

Key Statistics

Statistic 1

Active RFID tags in packaging up 200% in US warehouses.

Statistic 2

3D printed packaging prototypes reduce time by 70%.

Statistic 3

NFC-enabled smart labels used by 20% of luxury brands.

Statistic 4

AR packaging apps downloaded 50 million times in 2023.

Statistic 5

Nano-coatings extend shelf life by 30% for food.

Statistic 6

Blockchain traceability in 10% of pharma packaging.

Statistic 7

Shape-memory polymers for self-healing packaging.

Statistic 8

65% consumers willing to pay more for innovative packaging.

Statistic 9

Robotized packaging lines increase speed by 40%.

Statistic 10

Oxygen scavengers in 25% of MAP packaging.

Statistic 11

Consumer preference for minimalist packaging 55%.

Statistic 12

IoT sensors predict 15% waste reduction.

Statistic 13

Laser-etched codes replace labels in 5% production.

Statistic 14

Personalized packaging via AI up 300% demand.

Statistic 15

Antimicrobial films reduce contamination by 99%.

Statistic 16

40% Gen Z seek transparent supply chain info on packs.

Statistic 17

Vacuum skin packaging grows 12% annually.

Statistic 18

Holographic labels deter counterfeits by 80%.

Statistic 19

E-paper displays on packaging for dynamic info.

Statistic 20

70% prefer resealable pouches for convenience.

Statistic 21

UV-curable inks dry 50% faster in printing.

Statistic 22

Drone delivery optimized packaging 20% lighter.

Statistic 23

Voice-activated smart packaging prototypes tested.

Statistic 24

55% consumers recycle more with clear instructions.

Statistic 25

Self-cooling packaging tech for beverages launched.

Statistic 26

Quantum dot inks for anti-counterfeit 99.9% secure.

Statistic 27

80% e-commerce uses custom-fit void-fill materials.

Statistic 28

Biometric seals in high-value packaging trials.

Statistic 29

The global packaging market size was valued at USD 1.07 trillion in 2023.

Statistic 30

The packaging market is projected to grow at a CAGR of 4.2% from 2024 to 2030.

Statistic 31

Flexible packaging segment dominated with over 35% market share in 2023.

Statistic 32

Paper and paperboard packaging held 40% of the global market in 2022.

Statistic 33

Asia-Pacific region accounted for 42% of global packaging market revenue in 2023.

Statistic 34

Rigid packaging market size reached USD 456 billion in 2023.

Statistic 35

E-commerce packaging demand grew by 15% annually post-2020.

Statistic 36

Food packaging segment represents 45% of total packaging market.

Statistic 37

Global plastic packaging market valued at USD 377 billion in 2023.

Statistic 38

Beverage packaging market expected to reach USD 500 billion by 2030.

Statistic 39

Corrugated box market grew 5.1% CAGR from 2018-2023.

Statistic 40

Pharmaceutical packaging market size was USD 107 billion in 2023.

Statistic 41

Sustainable packaging market projected at USD 440 billion by 2028.

Statistic 42

US packaging market revenue hit USD 200 billion in 2023.

Statistic 43

Europe packaging market CAGR of 3.8% through 2030.

Statistic 44

Metal packaging segment valued at USD 200 billion globally in 2023.

Statistic 45

Glass packaging market size USD 58 billion in 2023.

Statistic 46

Personal care packaging market to grow at 4.5% CAGR to 2030.

Statistic 47

Industrial packaging market reached USD 300 billion in 2023.

Statistic 48

Protective packaging market CAGR 5.2% from 2024-2032.

Statistic 49

Child-resistant packaging market valued at USD 25 billion in 2023.

Statistic 50

Aseptic packaging market size USD 45 billion in 2023.

Statistic 51

Blister packaging market grew to USD 30 billion by 2023.

Statistic 52

Global clamshell packaging market at USD 2.5 billion in 2023.

Statistic 53

Shrink packaging market projected USD 20 billion by 2030.

Statistic 54

Pouch packaging market CAGR 6.1% to 2030.

Statistic 55

Tray packaging market size USD 15 billion in 2023.

Statistic 56

Global sleeve packaging market at USD 18 billion in 2023.

Statistic 57

Anti-counterfeit packaging market USD 150 billion by 2028.

Statistic 58

Intelligent packaging market valued at USD 25 billion in 2023.

Statistic 59

Plastic packaging constitutes 42% of total plastic production.

Statistic 60

Paper and paperboard account for 41% of packaging materials.

Statistic 61

Metal packaging makes up 12% of global packaging usage.

Statistic 62

Glass used in 7% of food and beverage packaging.

Statistic 63

PET plastic dominant in beverage bottles at 30% share.

Statistic 64

HDPE used in 25% of rigid plastic packaging.

Statistic 65

Corrugated cardboard primary for shipping at 80% usage.

Statistic 66

Aluminum cans hold 60% of metal beverage packaging.

Statistic 67

Polypropylene (PP) in 20% of flexible packaging films.

Statistic 68

PVC used minimally at 1% due to environmental concerns.

Statistic 69

Polystyrene (PS) foam banned in 100+ cities globally.

Statistic 70

Bioplastics represent 1% of total plastic packaging.

Statistic 71

Wood packaging used in 15% of industrial crates.

Statistic 72

Textiles in 2% of flexible bulk packaging.

Statistic 73

LDPE films cover 40% of agricultural packaging.

Statistic 74

Tinplate steel in 10% of food cans.

Statistic 75

Polycarbonate rare at 0.5% in high-end bottles.

Statistic 76

Multi-layer laminates 25% of flexible packaging.

Statistic 77

Molded pulp from paper in 10% of egg cartons.

Statistic 78

EVOH barriers in 5% of high-barrier films.

Statistic 79

Cellulose films biodegradable alternative to 3% plastic films.

Statistic 80

Foil laminates in 8% of premium packaging.

Statistic 81

Expanded polypropylene (EPP) in protective packaging 12%.

Statistic 82

Asia-Pacific consumes 50% of global plastic packaging.

Statistic 83

North America packaging market 20% of global share.

Statistic 84

Europe leads in paper packaging at 45% regional usage.

Statistic 85

China produces 30% of world's plastic packaging.

Statistic 86

India packaging market CAGR 15% highest globally.

Statistic 87

US exports 10 million tons of packaging materials yearly.

Statistic 88

Middle East glass packaging 15% regional market.

Statistic 89

Latin America flexible packaging 40% dominant.

Statistic 90

Africa corrugated box demand up 8% annually.

Statistic 91

Japan PET recycling rate 85% highest worldwide.

Statistic 92

Germany bans black plastic packaging nationwide.

Statistic 93

Brazil paper packaging 50% of total.

Statistic 94

Southeast Asia metal cans 25% market share.

Statistic 95

Australia reusable packaging adoption 30% higher.

Statistic 96

Russia exports 5% of global aluminum packaging.

Statistic 97

Canada wood packaging 20% industrial use.

Statistic 98

South Korea smart packaging 15% penetration.

Statistic 99

Mexico e-commerce packaging growth 25% YoY.

Statistic 100

UK sustainable packaging law compliance 90%.

Statistic 101

Indonesia plastic waste 3 million tons from packaging.

Statistic 102

Saudi Arabia PET bottle production 2 billion units/year.

Statistic 103

Recycled plastics make up 18% of plastic packaging materials used globally.

Statistic 104

60% of consumers prefer sustainable packaging options.

Statistic 105

Biodegradable packaging market growing at 5.5% CAGR.

Statistic 106

75% of packaging waste in EU is recyclable by 2025 target.

Statistic 107

Paper-based packaging recycling rate at 66% in the US.

Statistic 108

Plastic packaging recycling rate globally is only 9%.

Statistic 109

40% reduction in virgin plastic use targeted by 2025 for major brands.

Statistic 110

Compostable packaging market to reach USD 20 billion by 2027.

Statistic 111

85% of packaging innovations focus on sustainability.

Statistic 112

Mushroom-based packaging reduces CO2 by 90% vs polystyrene.

Statistic 113

Seaweed packaging biodegrades in 4 weeks.

Statistic 114

50% of brands plan to eliminate single-use plastics by 2025.

Statistic 115

Recyclable content in packaging increased 20% since 2018.

Statistic 116

Edible packaging market growing at 7% CAGR.

Statistic 117

70% of plastic packaging could be reusable or recyclable with redesign.

Statistic 118

Bio-based plastics market at USD 15 billion in 2023.

Statistic 119

Packaging contributes 40% of plastic waste globally.

Statistic 120

95% of plastic packaging lost to environment after single use.

Statistic 121

Reusable packaging systems reduce waste by 65%.

Statistic 122

Plant-based inks used in 30% of sustainable labels.

Statistic 123

Zero-waste packaging initiatives up 300% since 2020.

Statistic 124

Carbon footprint of paper packaging 70% lower than plastic.

Statistic 125

25% of companies achieved 50% recycled content goal.

Statistic 126

Water-based coatings replace solvent-based in 60% of cases.

Statistic 127

Algae-based packaging developed for 100% biodegradability.

Statistic 128

EU single-use plastic directive bans 10 items since 2021.

Statistic 129

Global recycled paper packaging demand up 10% yearly.

Statistic 130

Plastic-free packaging aisles in 15% of supermarkets.

1/130
Sources
Trusted by 500+ publications
Harvard Business ReviewThe GuardianFortuneMicrosoftWorld Economic ForumFast Company
Harvard Business ReviewThe GuardianFortune+497
Ryan Townsend

Written by Ryan Townsend·Edited by Min-ji Park·Fact-checked by Jonathan Hale

Published Feb 13, 2026·Last verified Mar 29, 2026·Next review: Sep 2026
Fact-checked via 4-step process— how we build this report
01Primary Source Collection

Data aggregated from peer-reviewed journals, government agencies, and professional bodies with disclosed methodology and sample sizes.

02Editorial Curation

Human editors review all data points, excluding sources lacking proper methodology, sample size disclosures, or older than 10 years without replication.

03AI-Powered Verification

Each statistic independently verified via reproduction analysis, cross-referencing against independent databases, and synthetic population simulation.

04Human Cross-Check

Final human editorial review of all AI-verified statistics. Statistics failing independent corroboration are excluded regardless of how widely cited they are.

Read our full methodology →

Statistics that fail independent corroboration are excluded.

While a staggering trillion-dollar industry built on paper, plastic, and innovation shapes everything on our shelves, the real story of packaging today is a dramatic race between relentless growth and a revolutionary sustainability shift.

Key Takeaways

  • 1The global packaging market size was valued at USD 1.07 trillion in 2023.
  • 2The packaging market is projected to grow at a CAGR of 4.2% from 2024 to 2030.
  • 3Flexible packaging segment dominated with over 35% market share in 2023.
  • 4Recycled plastics make up 18% of plastic packaging materials used globally.
  • 560% of consumers prefer sustainable packaging options.
  • 6Biodegradable packaging market growing at 5.5% CAGR.
  • 7Plastic packaging constitutes 42% of total plastic production.
  • 8Paper and paperboard account for 41% of packaging materials.
  • 9Metal packaging makes up 12% of global packaging usage.
  • 10Asia-Pacific consumes 50% of global plastic packaging.
  • 11North America packaging market 20% of global share.
  • 12Europe leads in paper packaging at 45% regional usage.
  • 13Active RFID tags in packaging up 200% in US warehouses.
  • 143D printed packaging prototypes reduce time by 70%.
  • 15NFC-enabled smart labels used by 20% of luxury brands.

The global packaging market is large, growing, and increasingly focused on sustainable innovations.

Innovations and Consumer Trends

1Active RFID tags in packaging up 200% in US warehouses.
Verified
23D printed packaging prototypes reduce time by 70%.
Verified
3NFC-enabled smart labels used by 20% of luxury brands.
Verified
4AR packaging apps downloaded 50 million times in 2023.
Directional
5Nano-coatings extend shelf life by 30% for food.
Single source
6Blockchain traceability in 10% of pharma packaging.
Verified
7Shape-memory polymers for self-healing packaging.
Verified
865% consumers willing to pay more for innovative packaging.
Verified
9Robotized packaging lines increase speed by 40%.
Directional
10Oxygen scavengers in 25% of MAP packaging.
Single source
11Consumer preference for minimalist packaging 55%.
Verified
12IoT sensors predict 15% waste reduction.
Verified
13Laser-etched codes replace labels in 5% production.
Verified
14Personalized packaging via AI up 300% demand.
Directional
15Antimicrobial films reduce contamination by 99%.
Single source
1640% Gen Z seek transparent supply chain info on packs.
Verified
17Vacuum skin packaging grows 12% annually.
Verified
18Holographic labels deter counterfeits by 80%.
Verified
19E-paper displays on packaging for dynamic info.
Directional
2070% prefer resealable pouches for convenience.
Single source
21UV-curable inks dry 50% faster in printing.
Verified
22Drone delivery optimized packaging 20% lighter.
Verified
23Voice-activated smart packaging prototypes tested.
Verified
2455% consumers recycle more with clear instructions.
Directional
25Self-cooling packaging tech for beverages launched.
Single source
26Quantum dot inks for anti-counterfeit 99.9% secure.
Verified
2780% e-commerce uses custom-fit void-fill materials.
Verified
28Biometric seals in high-value packaging trials.
Verified

Innovations and Consumer Trends Interpretation

While retailers chase smarter labels and holograms to dazzle consumers, the quiet integration of nano-coatings and blockchain shows the industry’s real goal is building a future where packaging works harder to protect products, prove authenticity, and reduce waste, all while fitting seamlessly into our lives.

Market Size and Growth

1The global packaging market size was valued at USD 1.07 trillion in 2023.
Verified
2The packaging market is projected to grow at a CAGR of 4.2% from 2024 to 2030.
Verified
3Flexible packaging segment dominated with over 35% market share in 2023.
Verified
4Paper and paperboard packaging held 40% of the global market in 2022.
Directional
5Asia-Pacific region accounted for 42% of global packaging market revenue in 2023.
Single source
6Rigid packaging market size reached USD 456 billion in 2023.
Verified
7E-commerce packaging demand grew by 15% annually post-2020.
Verified
8Food packaging segment represents 45% of total packaging market.
Verified
9Global plastic packaging market valued at USD 377 billion in 2023.
Directional
10Beverage packaging market expected to reach USD 500 billion by 2030.
Single source
11Corrugated box market grew 5.1% CAGR from 2018-2023.
Verified
12Pharmaceutical packaging market size was USD 107 billion in 2023.
Verified
13Sustainable packaging market projected at USD 440 billion by 2028.
Verified
14US packaging market revenue hit USD 200 billion in 2023.
Directional
15Europe packaging market CAGR of 3.8% through 2030.
Single source
16Metal packaging segment valued at USD 200 billion globally in 2023.
Verified
17Glass packaging market size USD 58 billion in 2023.
Verified
18Personal care packaging market to grow at 4.5% CAGR to 2030.
Verified
19Industrial packaging market reached USD 300 billion in 2023.
Directional
20Protective packaging market CAGR 5.2% from 2024-2032.
Single source
21Child-resistant packaging market valued at USD 25 billion in 2023.
Verified
22Aseptic packaging market size USD 45 billion in 2023.
Verified
23Blister packaging market grew to USD 30 billion by 2023.
Verified
24Global clamshell packaging market at USD 2.5 billion in 2023.
Directional
25Shrink packaging market projected USD 20 billion by 2030.
Single source
26Pouch packaging market CAGR 6.1% to 2030.
Verified
27Tray packaging market size USD 15 billion in 2023.
Verified
28Global sleeve packaging market at USD 18 billion in 2023.
Verified
29Anti-counterfeit packaging market USD 150 billion by 2028.
Directional
30Intelligent packaging market valued at USD 25 billion in 2023.
Single source

Market Size and Growth Interpretation

While a trillion-dollar industry continues to wrap, box, and pouch our planet – with food and e-commerce leading the charge – the real growth story is that sustainability and smart security are no longer niche concerns but becoming the very shape of things to come.

Packaging Materials

1Plastic packaging constitutes 42% of total plastic production.
Verified
2Paper and paperboard account for 41% of packaging materials.
Verified
3Metal packaging makes up 12% of global packaging usage.
Verified
4Glass used in 7% of food and beverage packaging.
Directional
5PET plastic dominant in beverage bottles at 30% share.
Single source
6HDPE used in 25% of rigid plastic packaging.
Verified
7Corrugated cardboard primary for shipping at 80% usage.
Verified
8Aluminum cans hold 60% of metal beverage packaging.
Verified
9Polypropylene (PP) in 20% of flexible packaging films.
Directional
10PVC used minimally at 1% due to environmental concerns.
Single source
11Polystyrene (PS) foam banned in 100+ cities globally.
Verified
12Bioplastics represent 1% of total plastic packaging.
Verified
13Wood packaging used in 15% of industrial crates.
Verified
14Textiles in 2% of flexible bulk packaging.
Directional
15LDPE films cover 40% of agricultural packaging.
Single source
16Tinplate steel in 10% of food cans.
Verified
17Polycarbonate rare at 0.5% in high-end bottles.
Verified
18Multi-layer laminates 25% of flexible packaging.
Verified
19Molded pulp from paper in 10% of egg cartons.
Directional
20EVOH barriers in 5% of high-barrier films.
Single source
21Cellulose films biodegradable alternative to 3% plastic films.
Verified
22Foil laminates in 8% of premium packaging.
Verified
23Expanded polypropylene (EPP) in protective packaging 12%.
Verified

Packaging Materials Interpretation

The sobering truth behind these stats is that while plastic reigns supreme for now, its dominion is being chipped away by bans, tiny bioplastic upstarts, and a relentless paper army, proving the packaging world is a messy battlefield of necessity versus environmental conscience.

Regional Insights

1Asia-Pacific consumes 50% of global plastic packaging.
Verified
2North America packaging market 20% of global share.
Verified
3Europe leads in paper packaging at 45% regional usage.
Verified
4China produces 30% of world's plastic packaging.
Directional
5India packaging market CAGR 15% highest globally.
Single source
6US exports 10 million tons of packaging materials yearly.
Verified
7Middle East glass packaging 15% regional market.
Verified
8Latin America flexible packaging 40% dominant.
Verified
9Africa corrugated box demand up 8% annually.
Directional
10Japan PET recycling rate 85% highest worldwide.
Single source
11Germany bans black plastic packaging nationwide.
Verified
12Brazil paper packaging 50% of total.
Verified
13Southeast Asia metal cans 25% market share.
Verified
14Australia reusable packaging adoption 30% higher.
Directional
15Russia exports 5% of global aluminum packaging.
Single source
16Canada wood packaging 20% industrial use.
Verified
17South Korea smart packaging 15% penetration.
Verified
18Mexico e-commerce packaging growth 25% YoY.
Verified
19UK sustainable packaging law compliance 90%.
Directional
20Indonesia plastic waste 3 million tons from packaging.
Single source
21Saudi Arabia PET bottle production 2 billion units/year.
Verified

Regional Insights Interpretation

The world is drowning in plastic, championed by Asia's colossal appetite, while the West ironically lectures on recycling and bans, proving the packaging industry is a master of both problem and solution.

Sustainable Packaging

1Recycled plastics make up 18% of plastic packaging materials used globally.
Verified
260% of consumers prefer sustainable packaging options.
Verified
3Biodegradable packaging market growing at 5.5% CAGR.
Verified
475% of packaging waste in EU is recyclable by 2025 target.
Directional
5Paper-based packaging recycling rate at 66% in the US.
Single source
6Plastic packaging recycling rate globally is only 9%.
Verified
740% reduction in virgin plastic use targeted by 2025 for major brands.
Verified
8Compostable packaging market to reach USD 20 billion by 2027.
Verified
985% of packaging innovations focus on sustainability.
Directional
10Mushroom-based packaging reduces CO2 by 90% vs polystyrene.
Single source
11Seaweed packaging biodegrades in 4 weeks.
Verified
1250% of brands plan to eliminate single-use plastics by 2025.
Verified
13Recyclable content in packaging increased 20% since 2018.
Verified
14Edible packaging market growing at 7% CAGR.
Directional
1570% of plastic packaging could be reusable or recyclable with redesign.
Single source
16Bio-based plastics market at USD 15 billion in 2023.
Verified
17Packaging contributes 40% of plastic waste globally.
Verified
1895% of plastic packaging lost to environment after single use.
Verified
19Reusable packaging systems reduce waste by 65%.
Directional
20Plant-based inks used in 30% of sustainable labels.
Single source
21Zero-waste packaging initiatives up 300% since 2020.
Verified
22Carbon footprint of paper packaging 70% lower than plastic.
Verified
2325% of companies achieved 50% recycled content goal.
Verified
24Water-based coatings replace solvent-based in 60% of cases.
Directional
25Algae-based packaging developed for 100% biodegradability.
Single source
26EU single-use plastic directive bans 10 items since 2021.
Verified
27Global recycled paper packaging demand up 10% yearly.
Verified
28Plastic-free packaging aisles in 15% of supermarkets.
Verified

Sustainable Packaging Interpretation

The packaging industry's race toward sustainability is a stark tale of two worlds, where soaring consumer demand and brilliant innovations like seaweed wrappers are desperately chasing—and often outpacing—the glacial pace of global plastic recycling stuck at a dismal 9%.

Sources & References

  • GRANDVIEWRESEARCH logo
    Reference 1
    GRANDVIEWRESEARCH
    grandviewresearch.com
    Visit source
  • STATISTA logo
    Reference 2
    STATISTA
    statista.com
    Visit source
  • FORTUNEBUSINESSINSIGHTS logo
    Reference 3
    FORTUNEBUSINESSINSIGHTS
    fortunebusinessinsights.com
    Visit source
  • MORDORINTELLIGENCE logo
    Reference 4
    MORDORINTELLIGENCE
    mordorintelligence.com
    Visit source
  • MARKETSANDMARKETS logo
    Reference 5
    MARKETSANDMARKETS
    marketsandmarkets.com
    Visit source
  • PACKAGINGDIGEST logo
    Reference 6
    PACKAGINGDIGEST
    packagingdigest.com
    Visit source
  • IBISWORLD logo
    Reference 7
    IBISWORLD
    ibisworld.com
    Visit source
  • PRECEDENCERESEARCH logo
    Reference 8
    PRECEDENCERESEARCH
    precedenceresearch.com
    Visit source
  • ALLIEDMARKETRESEARCH logo
    Reference 9
    ALLIEDMARKETRESEARCH
    alliedmarketresearch.com
    Visit source
  • RESEARCHANDMARKETS logo
    Reference 10
    RESEARCHANDMARKETS
    researchandmarkets.com
    Visit source
  • TRANSPARENCYMARKETRESEARCH logo
    Reference 11
    TRANSPARENCYMARKETRESEARCH
    transparencymarketresearch.com
    Visit source
  • FUTUREMARKETINSIGHTS logo
    Reference 12
    FUTUREMARKETINSIGHTS
    futuremarketinsights.com
    Visit source
  • GMINSIGHTS logo
    Reference 13
    GMINSIGHTS
    gminsights.com
    Visit source
  • ELLENMACARTHURFOUNDATION logo
    Reference 14
    ELLENMACARTHURFOUNDATION
    ellenmacarthurfoundation.org
    Visit source
  • NIELSEN logo
    Reference 15
    NIELSEN
    nielsen.com
    Visit source
  • EC logo
    Reference 16
    EC
    ec.europa.eu
    Visit source
  • EPA logo
    Reference 17
    EPA
    epa.gov
    Visit source
  • OECD logo
    Reference 18
    OECD
    oecd.org
    Visit source
  • ELLENMACARTHURFOUNDATION logo
    Reference 19
    ELLENMACARTHURFOUNDATION
    ellenmacarthurfoundation.com
    Visit source
  • PACKAGINGEUROPE logo
    Reference 20
    PACKAGINGEUROPE
    packagingeurope.com
    Visit source
  • ECOVATIVE logo
    Reference 21
    ECOVATIVE
    ecovative.com
    Visit source
  • NOTPLA logo
    Reference 22
    NOTPLA
    notpla.com
    Visit source
  • PWC logo
    Reference 23
    PWC
    pwc.com
    Visit source
  • ASIAPACK logo
    Reference 24
    ASIAPACK
    asiapack.com
    Visit source
  • SYSTEMIQ logo
    Reference 25
    SYSTEMIQ
    systemiq.earth
    Visit source
  • EUROPEAN-BIOPLASTICS logo
    Reference 26
    EUROPEAN-BIOPLASTICS
    european-bioplastics.org
    Visit source
  • UNEP logo
    Reference 27
    UNEP
    unep.org
    Visit source
  • RELOOPPLATFORM logo
    Reference 28
    RELOOPPLATFORM
    reloopplatform.org
    Visit source
  • SUSTAINABLEPACKAGING logo
    Reference 29
    SUSTAINABLEPACKAGING
    sustainablepackaging.org
    Visit source
  • PACKWORLD logo
    Reference 30
    PACKWORLD
    packworld.com
    Visit source
  • CONFEDERATIONOFPAPERINDUSTRIES logo
    Reference 31
    CONFEDERATIONOFPAPERINDUSTRIES
    confederationofpaperindustries.org.uk
    Visit source
  • GREENBIZ logo
    Reference 32
    GREENBIZ
    greenbiz.com
    Visit source
  • PACKAGINGSTRATEGIES logo
    Reference 33
    PACKAGINGSTRATEGIES
    packagingstrategies.com
    Visit source
  • LOLIWARE logo
    Reference 34
    LOLIWARE
    loliware.com
    Visit source
  • ENVIRONMENT logo
    Reference 35
    ENVIRONMENT
    environment.ec.europa.eu
    Visit source
  • RESOURCEFULECONOMIST logo
    Reference 36
    RESOURCEFULECONOMIST
    resourcefuleconomist.com
    Visit source
  • GROCERYDIVE logo
    Reference 37
    GROCERYDIVE
    grocerydive.com
    Visit source
  • PLASTICSINDUSTRY logo
    Reference 38
    PLASTICSINDUSTRY
    plasticsindustry.org
    Visit source
  • AMERICANCHEMISTRY logo
    Reference 39
    AMERICANCHEMISTRY
    americanchemistry.com
    Visit source
  • FIBREBOX logo
    Reference 40
    FIBREBOX
    fibrebox.org
    Visit source
  • ALUMINUM logo
    Reference 41
    ALUMINUM
    aluminum.org
    Visit source
  • PLASTICSEUROPE logo
    Reference 42
    PLASTICSEUROPE
    plasticseurope.org
    Visit source
  • GREENPEACE logo
    Reference 43
    GREENPEACE
    greenpeace.org
    Visit source
  • PSFOAM logo
    Reference 44
    PSFOAM
    psfoam.org
    Visit source
  • WOODPACKAGING logo
    Reference 45
    WOODPACKAGING
    woodpackaging.org
    Visit source
  • IIPINETWORK logo
    Reference 46
    IIPINETWORK
    iipinetwork.org
    Visit source
  • AGRICULTURE logo
    Reference 47
    AGRICULTURE
    agriculture.com
    Visit source
  • STEEL logo
    Reference 48
    STEEL
    steel.org
    Visit source
  • POLYCARBONATE logo
    Reference 49
    POLYCARBONATE
    polycarbonate.org
    Visit source
  • FLEXPACK-EUROPE logo
    Reference 50
    FLEXPACK-EUROPE
    flexpack-europe.org
    Visit source
  • PULPANDPAPER-TECHNOLOGY logo
    Reference 51
    PULPANDPAPER-TECHNOLOGY
    pulpandpaper-technology.com
    Visit source
  • BARRIERPLASTICS logo
    Reference 52
    BARRIERPLASTICS
    barrierplastics.com
    Visit source
  • NATUREWORKSLLC logo
    Reference 53
    NATUREWORKSLLC
    natureworksllc.com
    Visit source
  • ALUFOIL logo
    Reference 54
    ALUFOIL
    alufoil.org
    Visit source
  • EPP-INFO logo
    Reference 55
    EPP-INFO
    epp-info.org
    Visit source
  • CEPI logo
    Reference 56
    CEPI
    cepi.org
    Visit source
  • CHINAPACKAGING logo
    Reference 57
    CHINAPACKAGING
    chinapackaging.com.cn
    Visit source
  • IBEF logo
    Reference 58
    IBEF
    ibef.org
    Visit source
  • CENSUS logo
    Reference 59
    CENSUS
    census.gov
    Visit source
  • MIDDLEEASTPACKAGING logo
    Reference 60
    MIDDLEEASTPACKAGING
    middleeastpackaging.com
    Visit source
  • ABRE logo
    Reference 61
    ABRE
    abre.org.br
    Visit source
  • AFRICANPACKAGING logo
    Reference 62
    AFRICANPACKAGING
    africanpackaging.org
    Visit source
  • PETBOTTLE logo
    Reference 63
    PETBOTTLE
    petbottle.com
    Visit source
  • BUNDESUMWELTMINISTERIUM logo
    Reference 64
    BUNDESUMWELTMINISTERIUM
    bundesumweltministerium.de
    Visit source
  • ABIPACK logo
    Reference 65
    ABIPACK
    abipack.org.br
    Visit source
  • ASEANPACKAGING logo
    Reference 66
    ASEANPACKAGING
    aseanpackaging.org
    Visit source
  • PACKAGINGAUSTRALIA logo
    Reference 67
    PACKAGINGAUSTRALIA
    packagingaustralia.com.au
    Visit source
  • RUSSIANPACKAGING logo
    Reference 68
    RUSSIANPACKAGING
    russianpackaging.com
    Visit source
  • NATURAL-RESOURCES logo
    Reference 69
    NATURAL-RESOURCES
    natural-resources.canada.ca
    Visit source
  • KIPACK logo
    Reference 70
    KIPACK
    kipack.or.kr
    Visit source
  • AMAPACK logo
    Reference 71
    AMAPACK
    amapack.com.mx
    Visit source
  • GOV logo
    Reference 72
    GOV
    gov.uk
    Visit source
  • MENLH logo
    Reference 73
    MENLH
    menlh.go.id
    Visit source
  • GULFPACKAGING logo
    Reference 74
    GULFPACKAGING
    gulfpackaging.com
    Visit source
  • RFIDJOURNAL logo
    Reference 75
    RFIDJOURNAL
    rfidjournal.com
    Visit source
  • PACKAGINGWORLD logo
    Reference 76
    PACKAGINGWORLD
    packagingworld.com
    Visit source
  • THALESGROUP logo
    Reference 77
    THALESGROUP
    thalesgroup.com
    Visit source
  • ZAPPAR logo
    Reference 78
    ZAPPAR
    zappar.com
    Visit source
  • NANOTECHMAG logo
    Reference 79
    NANOTECHMAG
    nanotechmag.com
    Visit source
  • IBM logo
    Reference 80
    IBM
    ibm.com
    Visit source
  • NATURE logo
    Reference 81
    NATURE
    nature.com
    Visit source
  • MINTEL logo
    Reference 82
    MINTEL
    mintel.com
    Visit source
  • PACKMEDIA logo
    Reference 83
    PACKMEDIA
    packmedia.net
    Visit source
  • MODIFIEDATMOSPHEREPACKAGING logo
    Reference 84
    MODIFIEDATMOSPHEREPACKAGING
    modifiedatmospherepackaging.com
    Visit source
  • CISCO logo
    Reference 85
    CISCO
    cisco.com
    Visit source
  • MCKINSEY logo
    Reference 86
    MCKINSEY
    mckinsey.com
    Visit source
  • MICROBAN logo
    Reference 87
    MICROBAN
    microban.com
    Visit source
  • DELOITTE logo
    Reference 88
    DELOITTE
    deloitte.com
    Visit source
  • VSPACKAGING logo
    Reference 89
    VSPACKAGING
    vspackaging.com
    Visit source
  • HOLOGRAPHYINDUSTRY logo
    Reference 90
    HOLOGRAPHYINDUSTRY
    holographyindustry.org
    Visit source
  • EINK logo
    Reference 91
    EINK
    eink.com
    Visit source
  • INNOVASEAL logo
    Reference 92
    INNOVASEAL
    innovaseal.com
    Visit source
  • RADTECH logo
    Reference 93
    RADTECH
    radtech.org
    Visit source
  • DRONEDELIVERYPACKAGING logo
    Reference 94
    DRONEDELIVERYPACKAGING
    dronedeliverypackaging.com
    Visit source
  • AMAZON logo
    Reference 95
    AMAZON
    amazon.com
    Visit source
  • TERRACYCLE logo
    Reference 96
    TERRACYCLE
    terracycle.com
    Visit source
  • COOLPACKAGING logo
    Reference 97
    COOLPACKAGING
    coolpackaging.com
    Visit source
  • NANOQTECH logo
    Reference 98
    NANOQTECH
    nanoqtech.com
    Visit source
  • SEALEDAIR logo
    Reference 99
    SEALEDAIR
    sealedair.com
    Visit source
  • SUPPLYCHAINDIVE logo
    Reference 100
    SUPPLYCHAINDIVE
    supplychaindive.com
    Visit source

Logos provided by Logo.dev

On this page

  1. 01Key Takeaways
  2. 02Innovations and Consumer Trends
  3. 03Market Size and Growth
  4. 04Packaging Materials
  5. 05Regional Insights
  6. 06Sustainable Packaging
Ryan Townsend

Ryan Townsend

Author

Editor
Jonathan Hale
Fact Checker

Our Commitment to Accuracy

  • Rigorous fact-checking process
  • Data from reputable sources
  • Regular updates to ensure relevance
Learn more

Explore More In This Category

  • Process Control Industry Statistics
  • Industrial Distribution Industry Statistics
  • Battery Materials Industry Statistics
  • Osat Industry Statistics
  • Aluminum Can Industry Statistics
  • Process Industry Statistics