Market data
Biotechnology Pharmaceuticals
Explore verified biotechnology pharmaceuticals statistics and market research reports with sourced data and trend analysis.
Latest update:
 Nathan Caldwell

Synthetic Biology Industry Statistics
With 2023’s regulatory updates across EU advanced therapy and GM rules running alongside 1.2M+ synthetic biology related sequences added to GenBank since 2018, this page tracks how faster design is meeting tighter oversight. It pairs practical lab performance like 20–60% fermentation time reductions and 20–30% expected yield gains with biosafety and TEA constraints, plus market signals such as 35.7% CAGR and 6% of biotech market cap in public synthetic biology stocks.

Korea Biohealth Industry Statistics
With 7,892 biohealth companies in Korea and biohealth exports hitting USD 14.5 billion in 2023, the sector is expanding fast while still relying on small biotech SMEs that make up 85% of firms. This page maps where talent and capital concentrate, from Pangyo and Songdo clusters to R&D muscle like 120,000 scientists and engineers, and highlights the sharp performance gaps across pharma, devices, cell and gene therapy, and digital health.
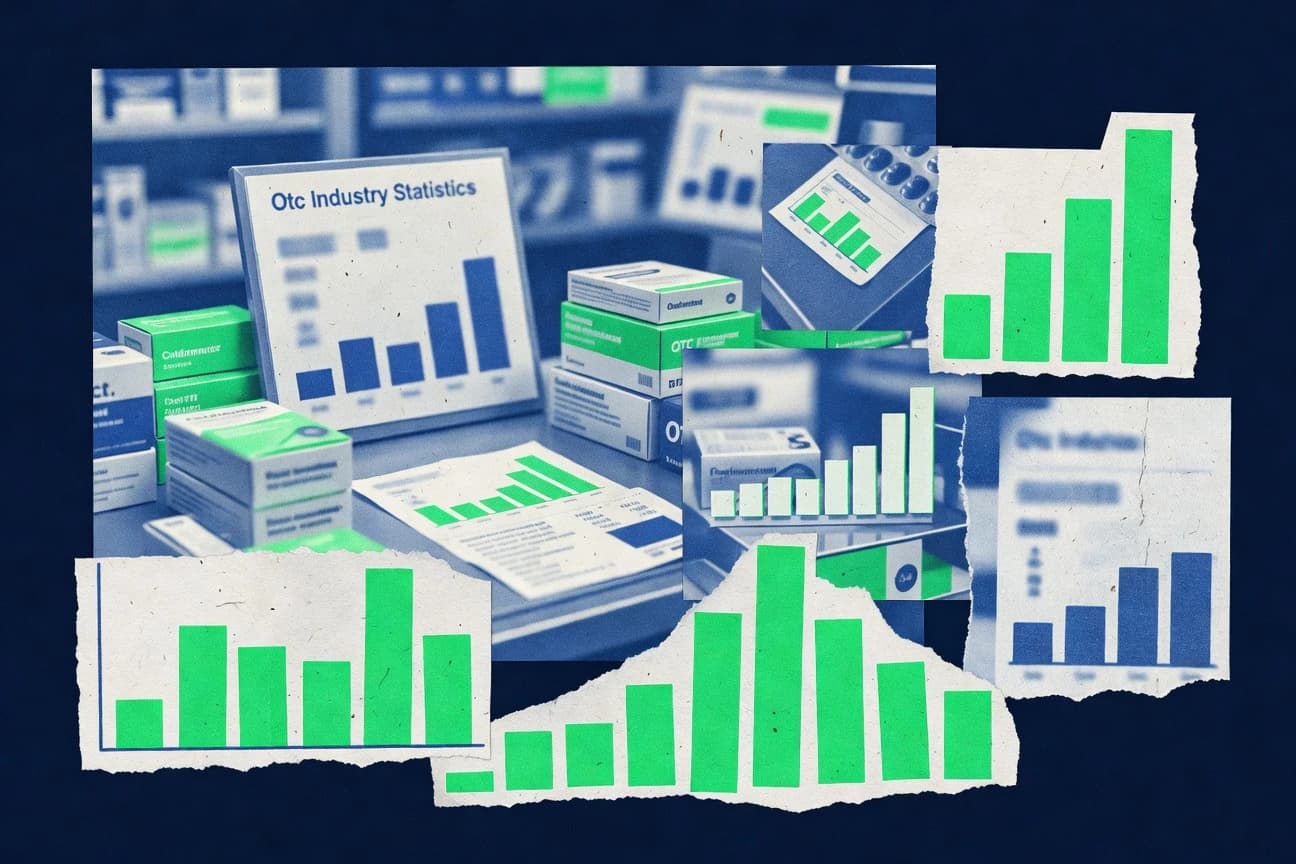
Otc Industry Statistics
The OTC market is forecast to grow at a 4.8% CAGR from 2024 to 2032, but the real story is the stress points behind that steady rise, from FDA label activity and recalls to shortages and compliance. You will also see why OTC now represents 5.4% of US healthcare spending and how behaviors like accidental medicine mixing drive an estimated US$0.9 billion per year in adverse event costs.

Glp-1 Industry Statistics
GLP-1 and obesity market activity is surging fast, with 2023 global revenues at $106.0 billion and US obesity spending reaching $26.1 billion in 2023, while GLP-1 and GLP-1+GIP use climbs from 0.2% of insured members in 2022 to 0.8% in 2023. The page also connects this demand shift to real outcomes and system impacts, including near FDA and trial proof points on weight loss plus the 2024 persistence and cost signals that explain why adoption is not just growing, it is getting sticky.

Biomedical Industry Statistics
Gene and device breakthroughs keep accelerating, but the bottlenecks are getting sharper, with 2024 showing 2,000 plus net clinical trial registrations added every week to ClinicalTrials.gov and 15 percent of FDA device inspections ending in warning letters. If you want the pulse of where biopharma and medical technology momentum is colliding with safety, compliance, and operational speed, this page brings those tradeoffs into one tightly quantified snapshot.

Rx Industry Statistics
Rx spending is rising alongside policy pressure, with PBM rebates alone hitting $240 billion in the U.S. in 2023 even as generics make up 91% of prescriptions by volume but just 19% by value. Track where the money is shifting next, from biopharma’s 43% share of global sales to specialty growth, pricing squeeze, and accelerated approvals that are reshaping what patients see on shelves.

Genomics Statistics
From maize genomes at 2.3 Gb to human datasets that now reach 1 billion plus variants in dbSNP as of 2023, this page connects the scale of modern sequencing with what changes outcomes, from 37% less insecticide use in Bt corn and 99% malaria transmission reduction in edited mosquitoes to polygenic risk scores explaining 20% of schizophrenia heritability and CRISPR shifting disease mutation patterns. It is a fast reality check on how genome size, variant counts, and new assay power translate into agriculture gains and health predictions you can actually quantify.

Indian Pharmaceutical Industry Statistics
With the workforce now topping 5.5 lakh direct employees and women making up 35 percent of pharma talent, this page puts hard 2025 context around what is actually happening in Indian pharma hiring, pay, and skill building. You will see why the sector is adding jobs and training at the same time it is juggling a 15 percent average attrition rate plus the export and R and D momentum that is pushing the industry toward USD 130 billion by 2030.

Obesity Drug Industry Statistics
Trials and sales reporting through 2025 paint an efficiency gap hard to ignore: tirzepatide hits 26.6% total weight loss in SURMOUNT-3 after lifestyle alone and selected cardiovascular data pair with faster weight durability, while Wegovy reached $2.6 billion in U.S. H1 2024 sales and total GLP-1 spend reached $18.5 billion in 2023. This page turns those headline results into a clear industry scoreboard from 15% loss with semaglutide STEP 1 to 22.5% with tirzepatide SURMOUNT-2 in type 2 diabetes and beyond, including what payers, side effect signals, and next generation oral and dual agonists are likely to change next.

Fermentation Industry Statistics
Global fermentation ingredients reached USD 52.3 billion in 2023 and are projected to climb to USD 78.6 billion by 2032, but the real story is how regional power and process breakthroughs are reshuffling supply chains, from China’s 65% share of citric acid fermentation to EU breweries cutting 1.2 million tons of emissions with CO2 capture. Follow the figures behind everything from soy sauce and kimchi volumes to the shift toward continuous fermentation, enzyme cost cuts, and precision methods that are changing what scale means for fermentation plants in 2025 and beyond.

Microalgae Industry Statistics
From heavy metal clean up where studies often report 50 percent plus reductions across multiple metals to regulatory and safety hurdles that shape what makes it onto food shelves, this page connects the lab reality of microalgae with market sized demand, including a global aquaculture output of 96.4 million tonnes live weight equivalent in 2022 and the algae biomass market forecast to reach USD 4.3 billion by 2030. It also tracks the cost and sustainability tension that can swing results by more than two times, from harvesting energy and CO2 transfer efficiency to life cycle emissions, so you see where microalgae succeed, where they strain, and why those details matter.