GITNUX MARKETDATA
Browse Our Category
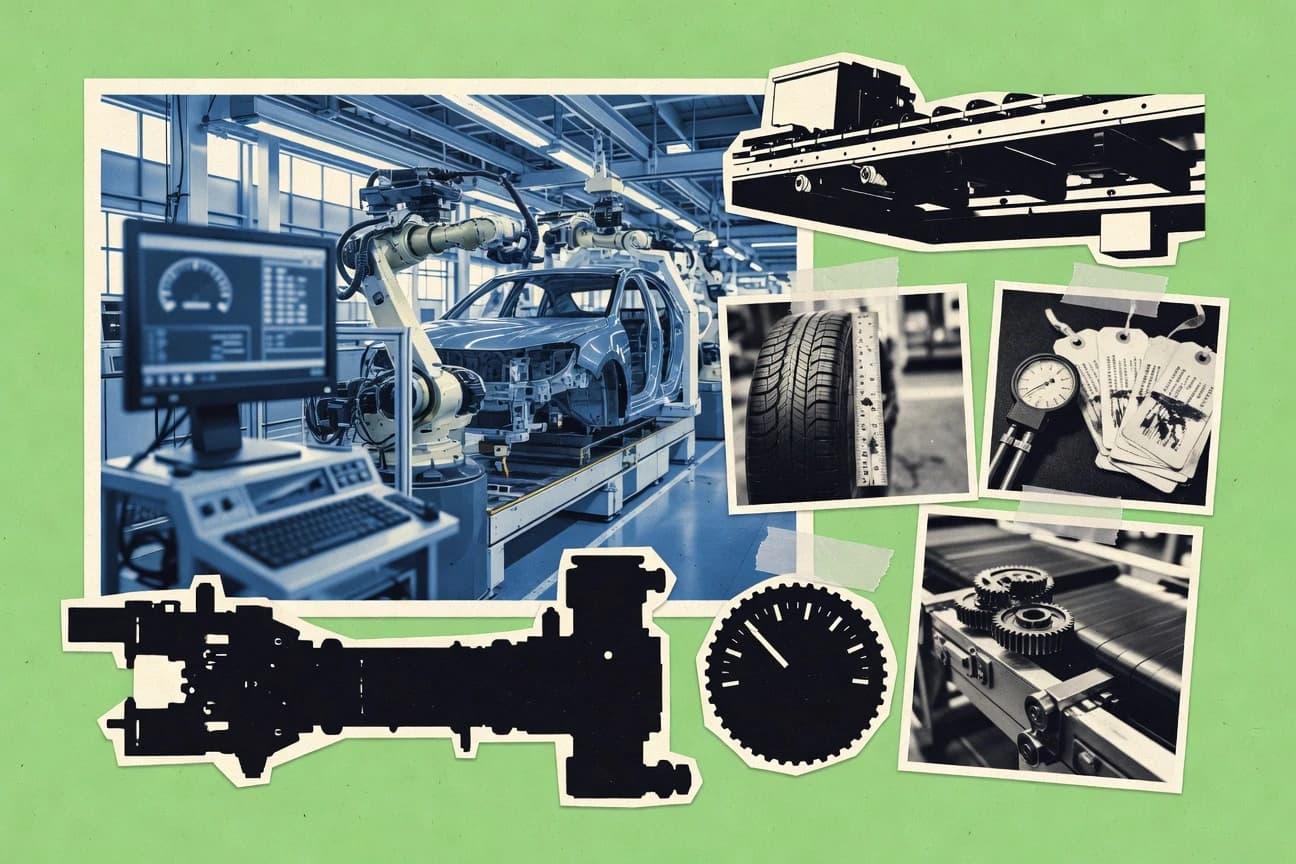
Automotive Services
Latest update:


Auto Sales Statistics
Auto Sales tracking shows how 2026 shifts the market in real numbers, with the latest pricing and inventory patterns tightening the gap between what buyers want and what dealerships can actually put on the lot. If you think demand is steady, these statistics will make you double check by spotlighting the moments where vehicle availability and sales momentum move in opposite directions.
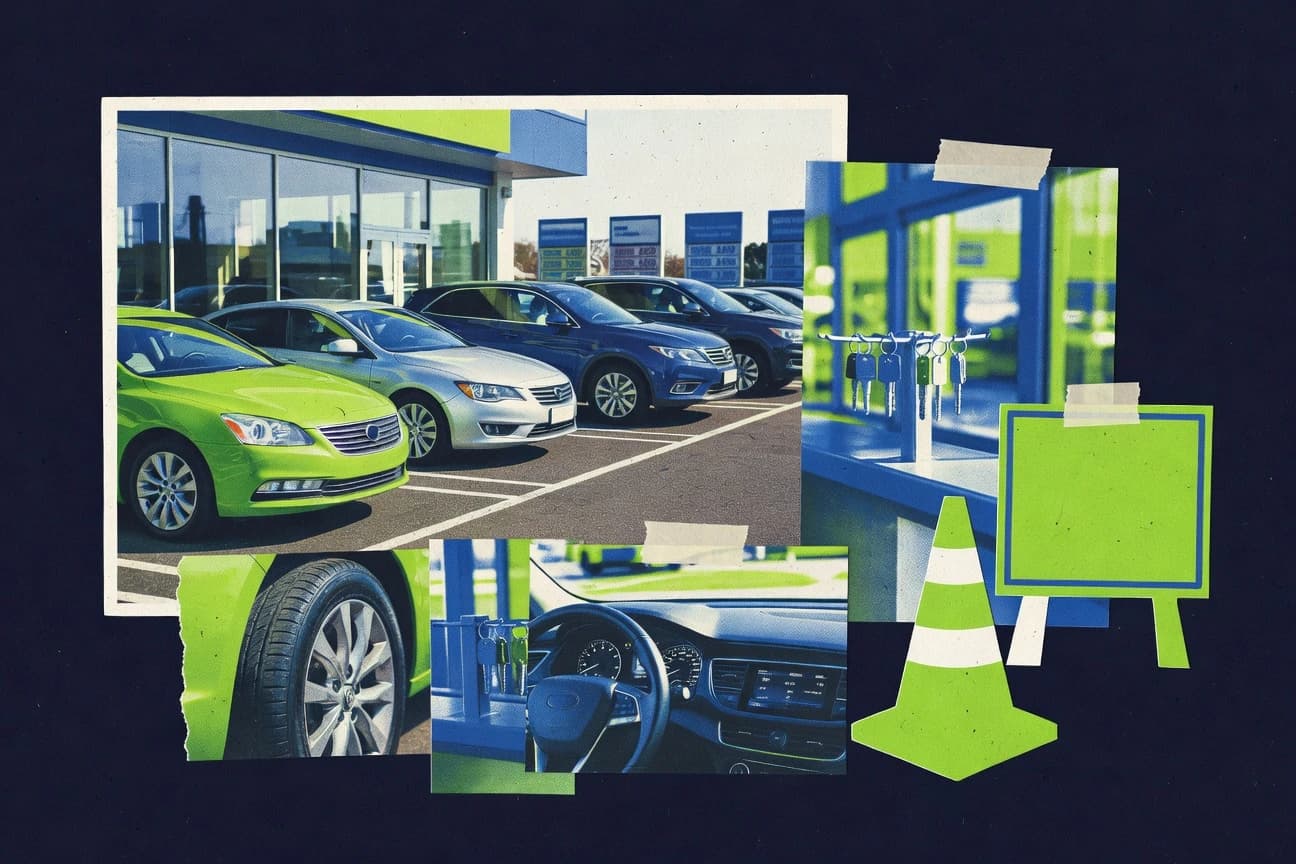
Auto Retail Industry Statistics
Auto retail keeps tightening its margins while customers keep demanding faster, smarter ways to buy, and the latest 2026 figures show how that pressure is reshaping everything from pricing discipline to inventory decisions. See the standout swings and what they mean for retailers trying to stay profitable without losing the sale.
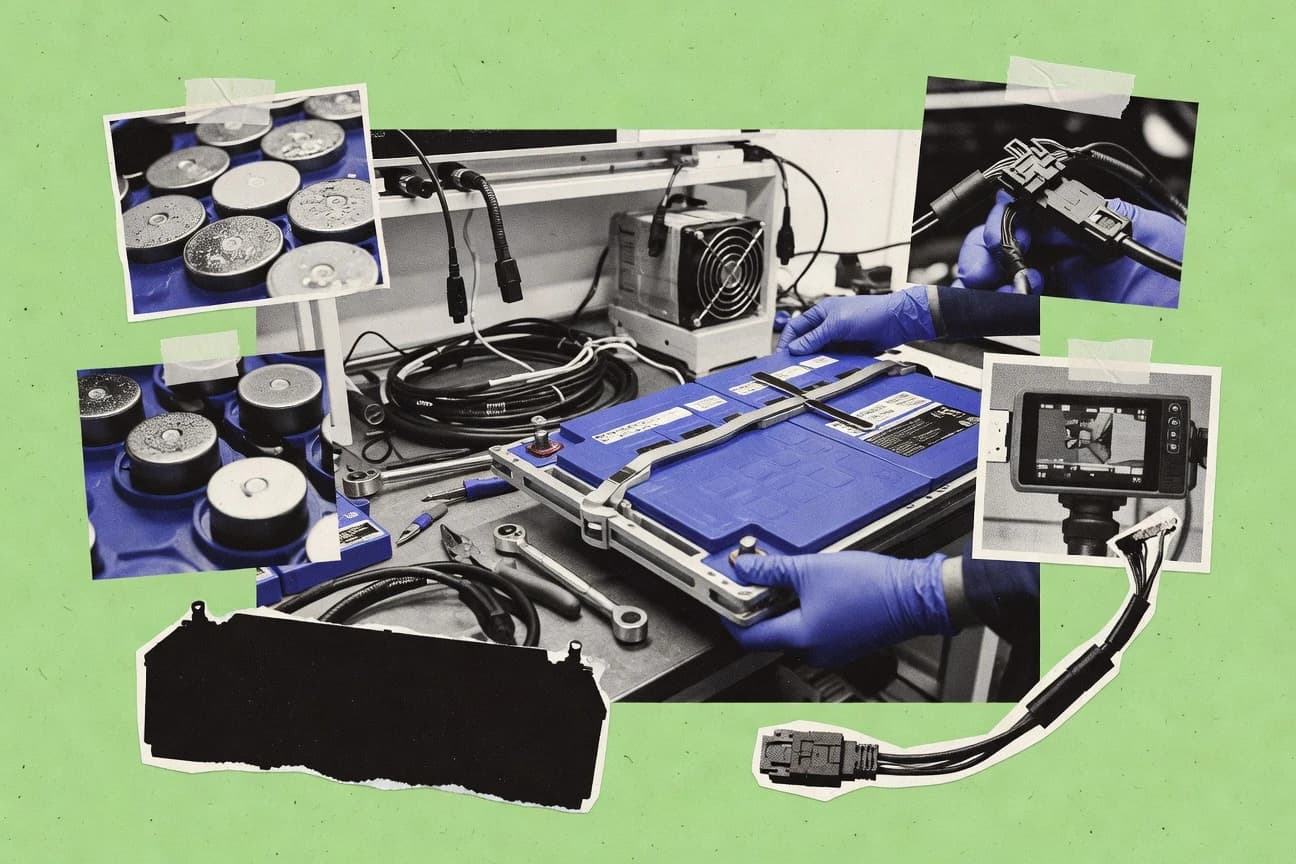
Battery Ev Industry Statistics
Battery EV Industry’s latest statistics reveal how quickly the push for clean mobility is reshaping real-world battery demand, with 2025 figures already pointing to a sharper shift than the market expected. Don’t just track growth, see where supply, costs, and capacity are tightening and what that means for the next wave of deployments.

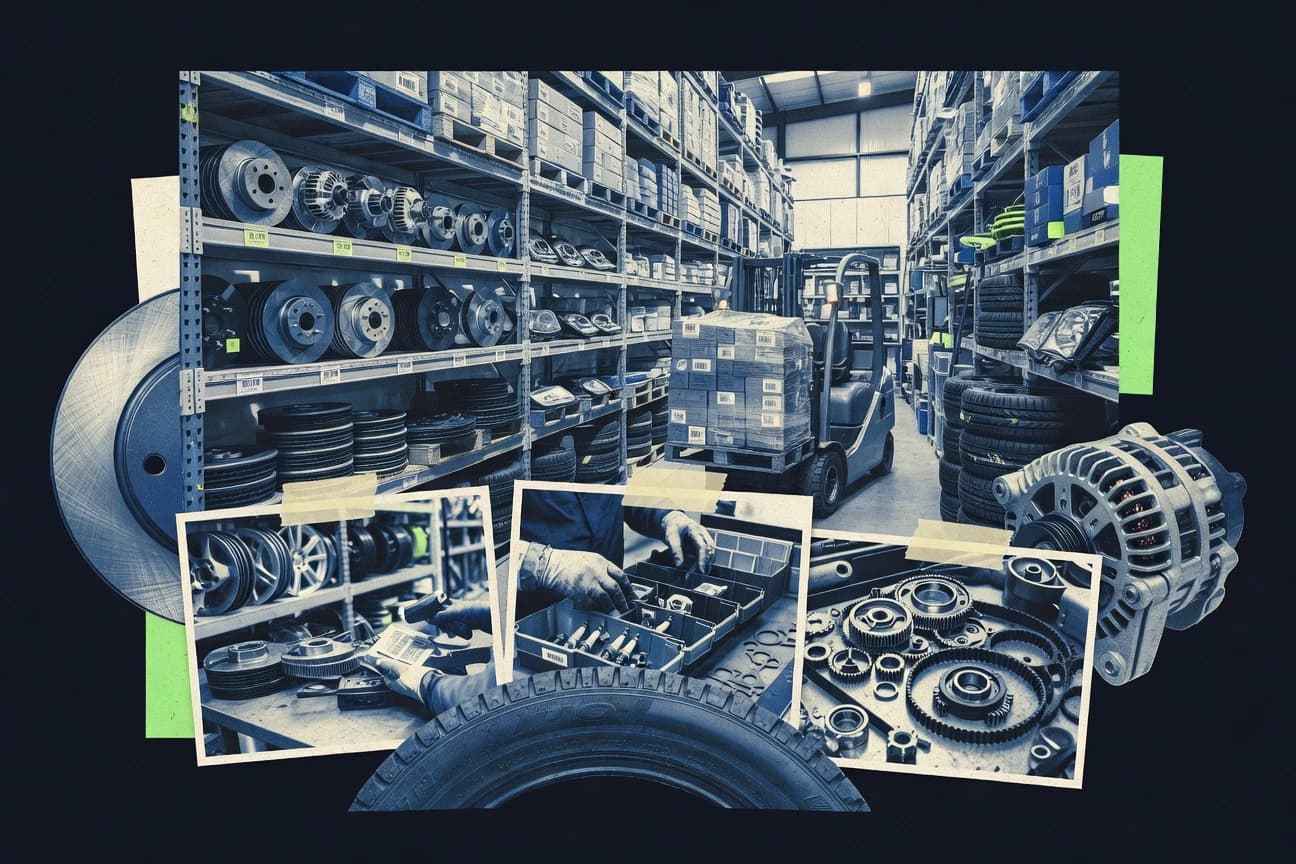
Aftermarket Auto Parts Industry Statistics
Global aftermarket auto parts are still projected to grow at a 2.6% average annual pace through 2030 even as U.S. average auto parts prices rose just 1.6% inflation adjusted from 2022 to 2023, pushing more shoppers online where 19.6% bought parts in 2023 and 36% ordered online within the past year. Expect supply chain pressure to matter more than you think, with 21% of manufacturers naming delays as a top constraint and 97% of distributors relying on barcode scan tech to prevent costly stockouts.
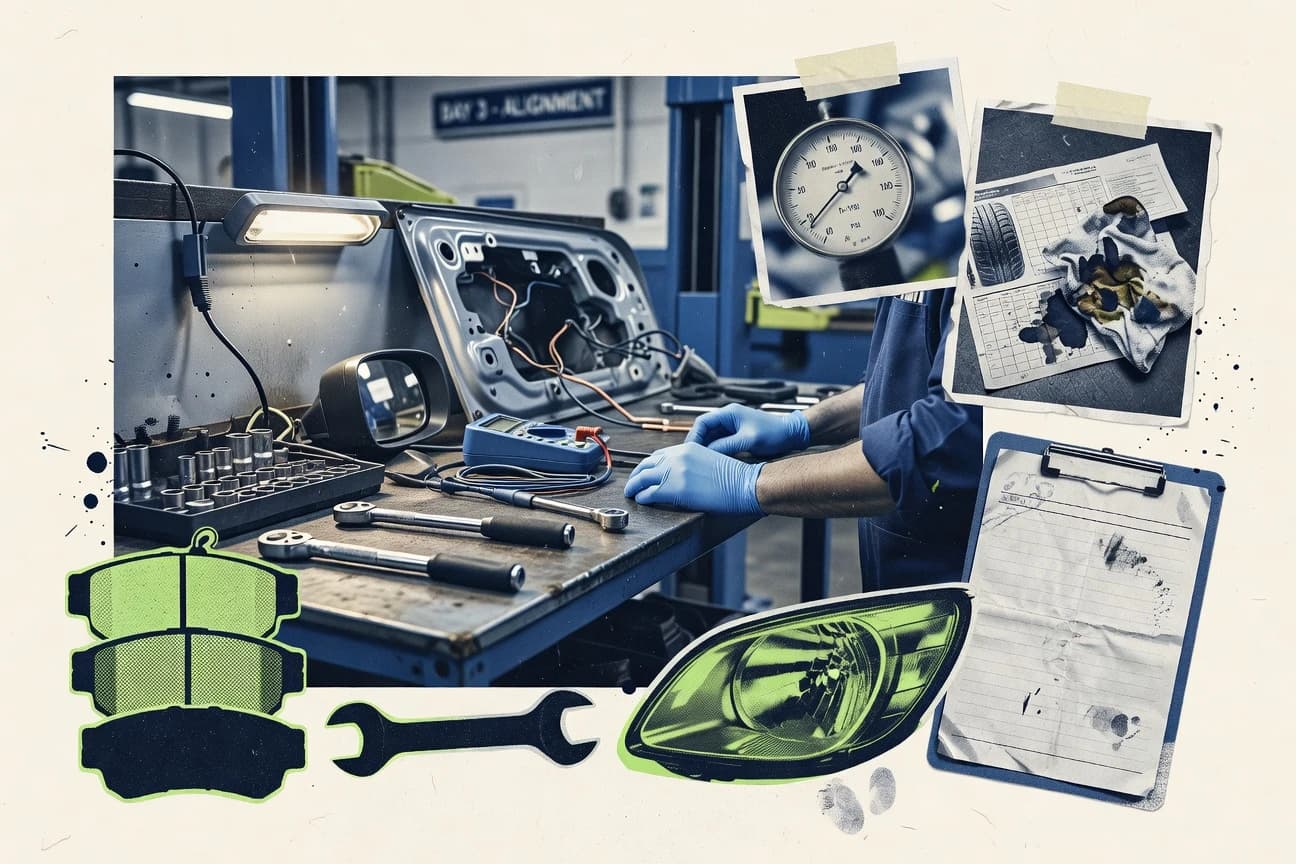
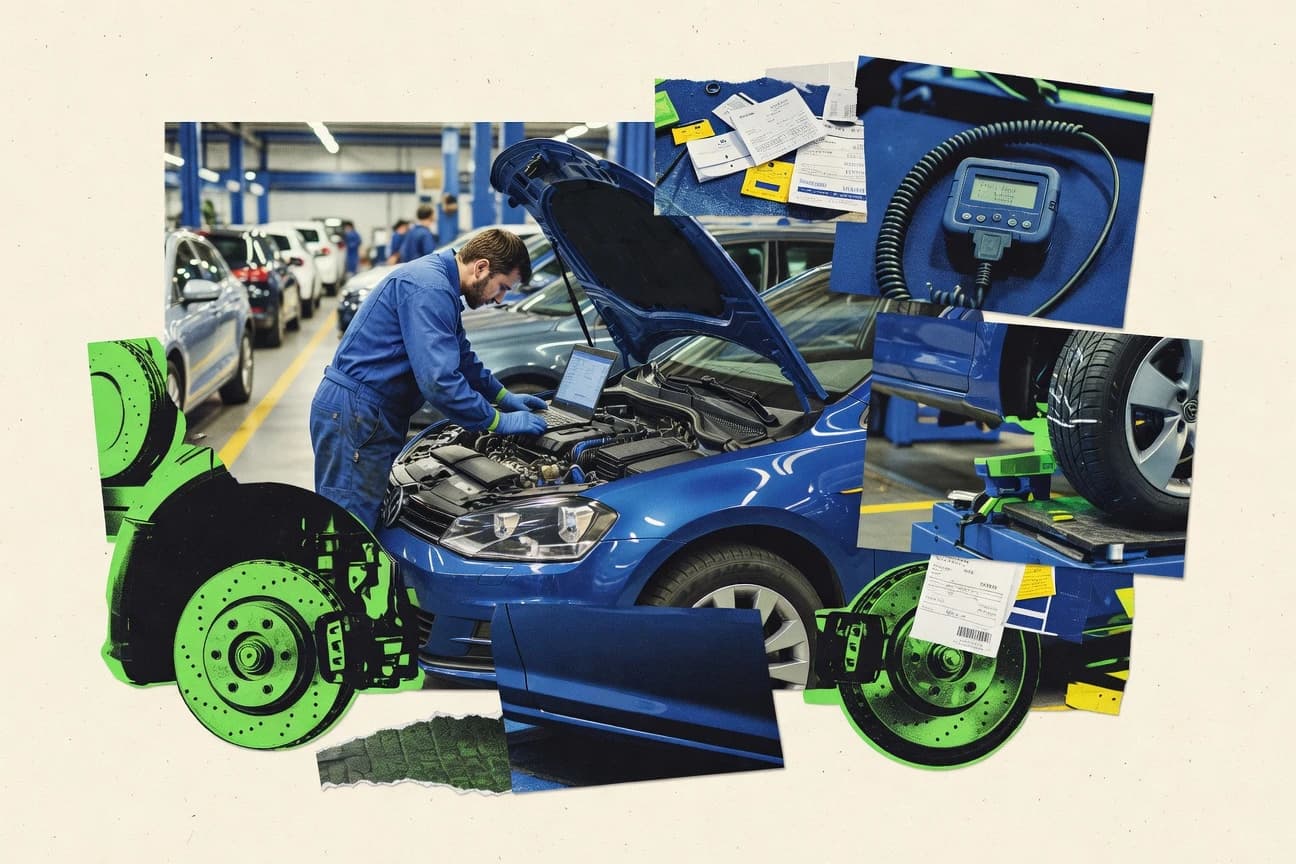
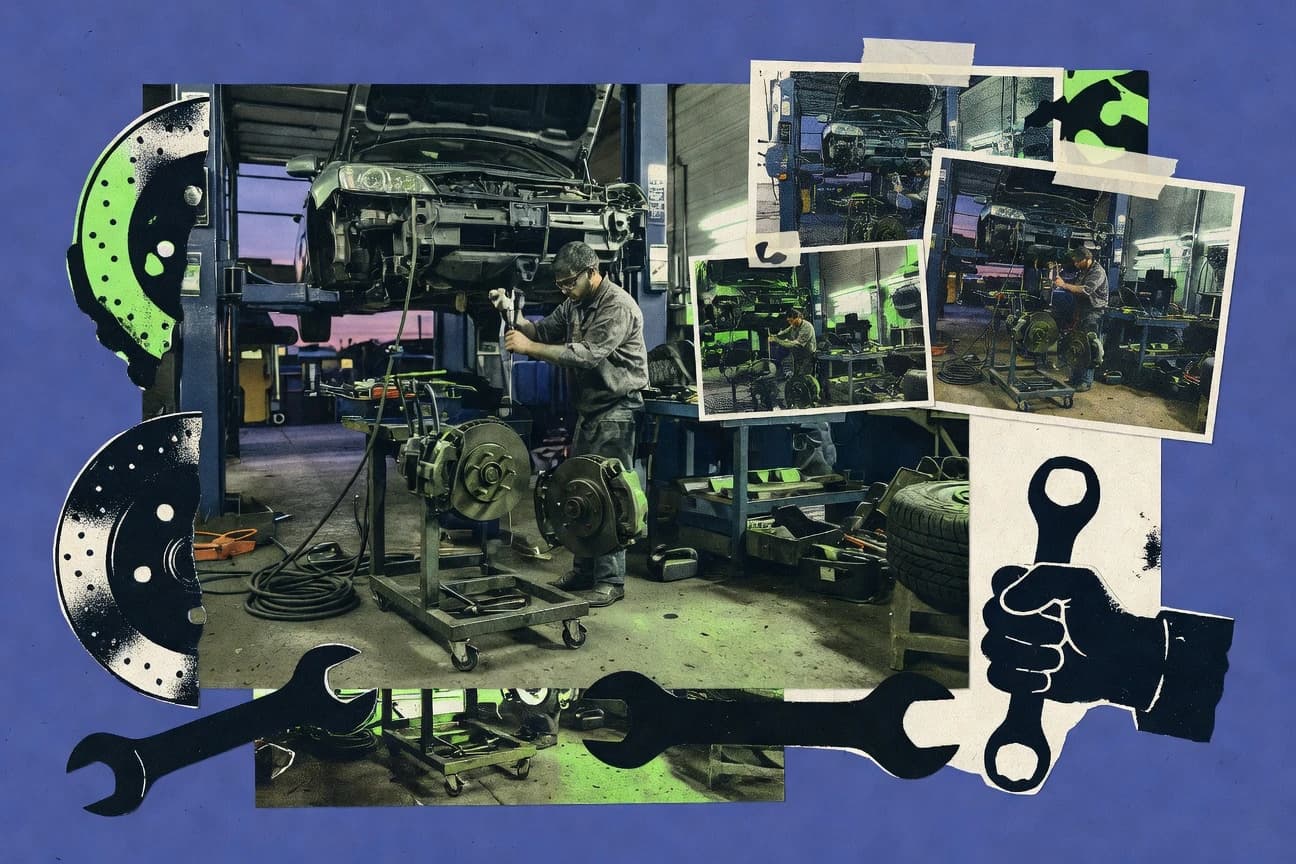
Automotive Repair Industry Statistics
With 2025 figures pinpointing where automotive repair costs and wait times are tightening most sharply, this page shows which services are driving the biggest swings and what customers are actually feeling at the counter. The contrast between steady demand and shifting pricing pressure makes it clear why repair shops that track these patterns are adapting faster than the rest.

Carwash Industry Statistics
Autonomous car wash technology is projected to cut labor costs by 30% by 2025, even as eco friendly demand and retention jump with unlimited plans and loyalty programs. From touch free growth to contactless payments and AI efficiency gains, these 2025 ready trends explain exactly why car wash operators are redesigning everything from pricing to machines.
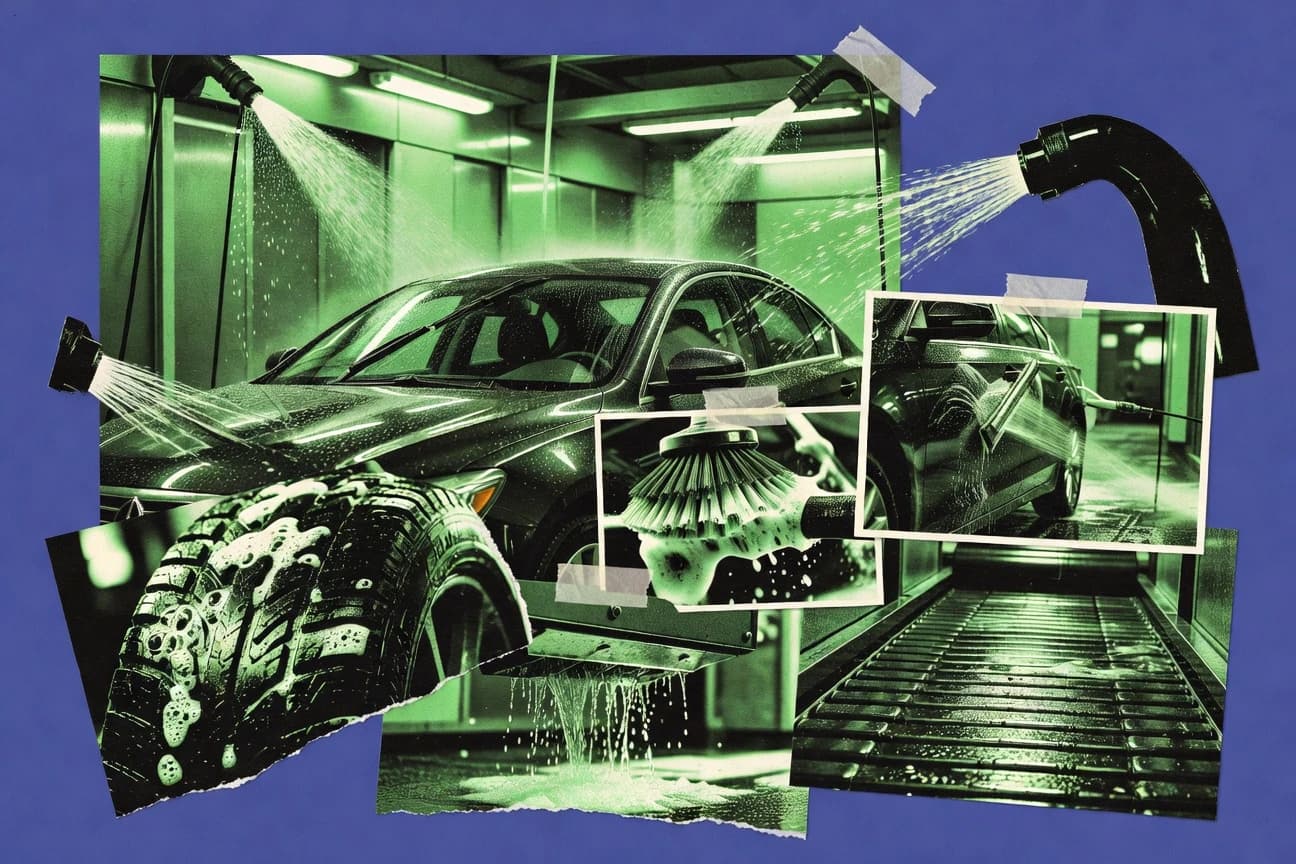
Car Wash Statistics
Car wash growth is still climbing, with the global market set to rise from $33.06 billion in 2023 to $41.19 billion by 2028, while touchless services and EV friendly upgrades are reshaping what customers expect. The page also pulls hard contrasts like contactless payments up 42% in 2022 and automated systems cutting labor costs 20% since 2018, so you can see exactly where the industry is moving next.
Auto Parts Industry Statistics
With the global automotive aftermarket projected to hit $1,026.0 billion by 2032 alongside $1.8 trillion in global service parts and accessories revenue in 2022, this page tracks where demand is actually shifting. It also pairs part market growth, vehicle parc expansion, and EV plus connected car adoption with cost and price pressure data like 2023 steel and aluminum moves so you can see what will reshape auto parts buying next.
Eu Car Industry Statistics
Electric cars are already carving out real share. In Q1 2024, BEVs took 12.4% and PHEVs 10.0% of new registrations while petrol fell to 60.0%, against a still-large diesel base at 13.2%, across EU sales volumes, fleet age and CO2 compliance, plus the charging and battery buildout needed to keep up.
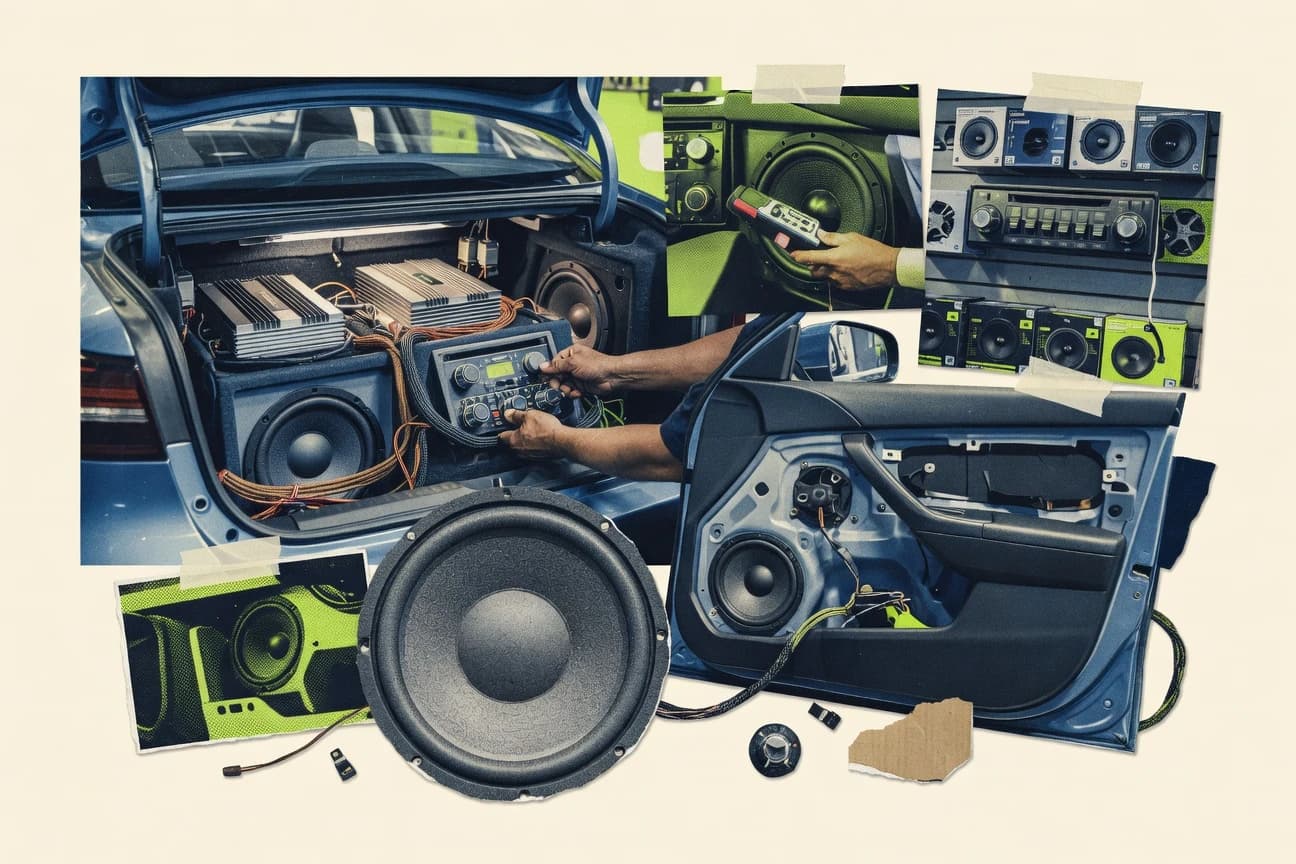
Car Audio Industry Statistics
With 55% of new cars shipped globally in 2022 already supporting built-in voice assistants, the shift from knobs to conversation is reshaping what gets upgraded, installed, and financed in-car audio. Scroll past the global connectivity surge, the US aftermarket workforce tied to installs and repairs, and the market’s projected value climb to see exactly which capability gaps are driving speaker, head unit, and amplifier demand.
American Auto Industry Statistics
With public DC fast chargers topping 16,000+ and the average new auto premium still climbing to $1,771 in 2023, the American auto story in 2025 is not just about electrification and pricing, it is also about safety, supply, and what drivers actually buy. This page pulls together FHWA, BLS, BEA, DOE, NHTSA, IIHS, and industry survey signals so you can see how registered vehicles, lending and insurance costs, and vehicle reliability are shifting side by side.
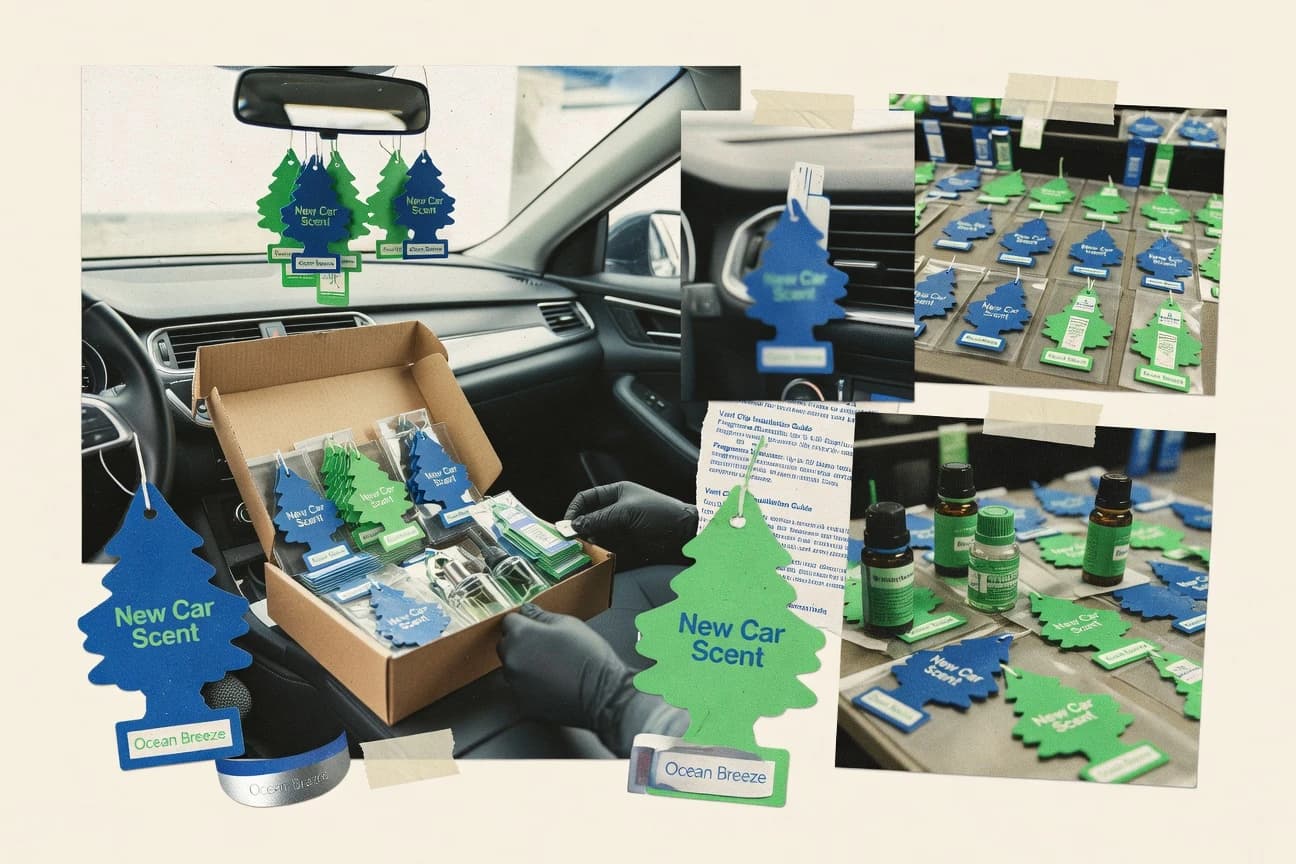
Automotive Air Freshener Industry Statistics
Gel fresheners still dominate segment share, but liquid air fresheners are tipped to post the fastest market growth through 2032 as EV buyers expect cabin comfort and odor control that actually lasts. Behind the scent, the page links consumer perceptions of air quality with measurable formulation drivers like VOC behavior, adsorption and diffusion kinetics, and the EU and US rules that can make or break ingredient and claim compliance.

Ev Auto Industry Statistics
EV sales surged to 95.7 million worldwide in 2023 from 14.9 million in 2019, and the IEA now projects that nearly half of new cars could be electric by 2030 if policy and charging keep pace. See how battery costs, energy use, charging speed, and grid implications all snap together, from pack prices around $151 kWh in 2023 to charging rollout that is adding millions of real world stalls and fast public DC ports.

Latin America Auto Industry Statistics
Major Latin American auto producers rebounded unevenly while electric vehicle investments grew.
Korean Auto Industry Statistics
Even with 2023 exports of USD 72.0 billion in automobiles and parts and passenger cars taking 84% of new sales, South Korea’s powertrain mix flips the spotlight with EVs at 7.7% and hybrids at 39% of registrations. Track how Hyundai and Kia control 69.8% of the passenger car market and how motor vehicle and parts manufacturing employment and production growth have kept pace with trade and parts exports of USD 22.0 billion.
European Car Industry Statistics
Battery pack prices slid to $132 per kWh in 2023 even as Europe pushed EVs from 19% of global sales in 2022 to 25% in 2023, reaching 3.8 million BEVs and 1.2 million plug in hybrids, while stricter EU CO2 rules tighten the financial and safety tradeoffs. This page ties installed car bases and real world charging and emissions metrics to the policy targets for 2025 and 2030 so you can see exactly how Europe is repositioning mobility.
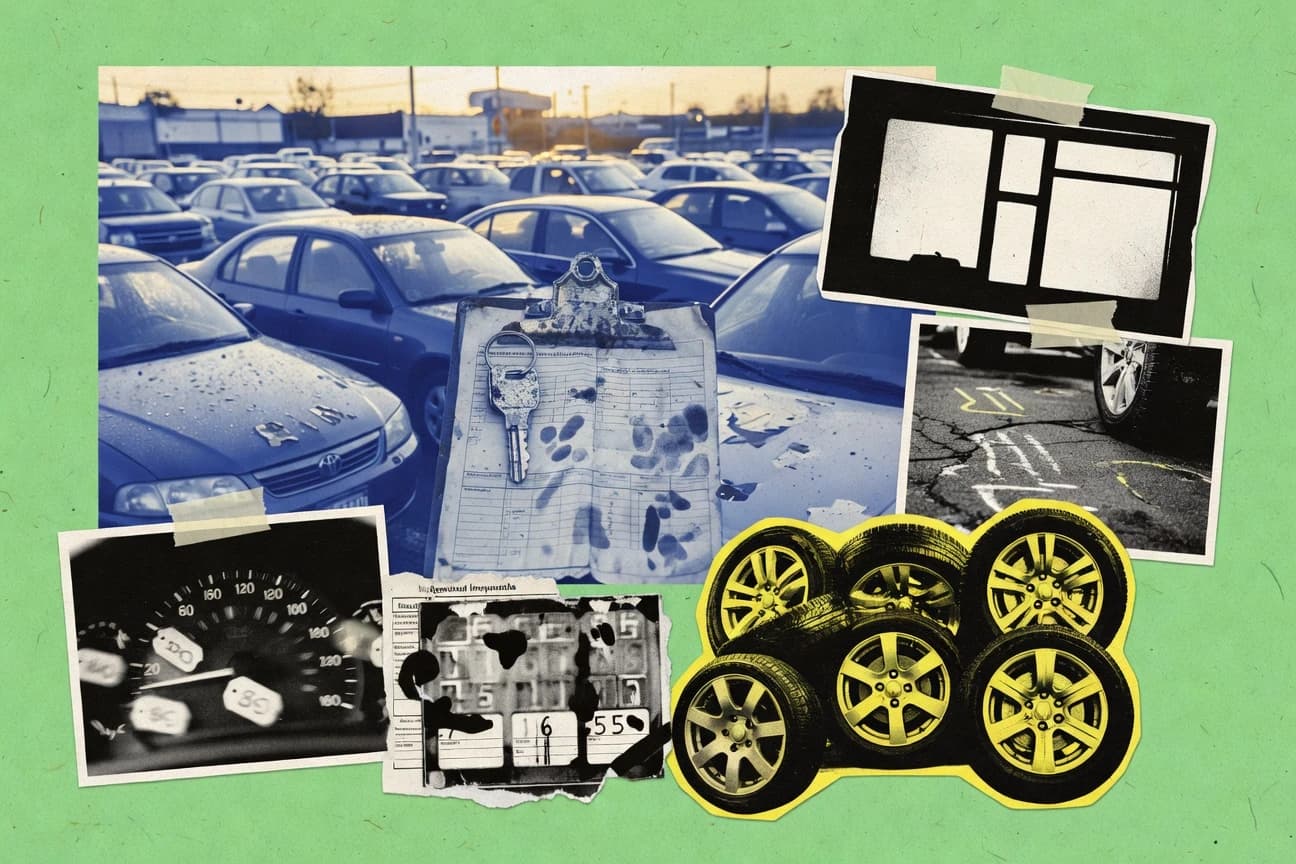
Used Car Industry Statistics
Used car shopping is getting more digital and more personalized at the same time, with 65% of buyers using mobile apps and 75% checking vehicle history before purchase in the U.S., yet test drives still matter to 82% of shoppers. If you want to see where the deal pressure comes from, don’t miss how financing drives 85% of purchases alongside a 70% price negotiation success rate and used EV prices that are still down 20% to an average of $38,000.
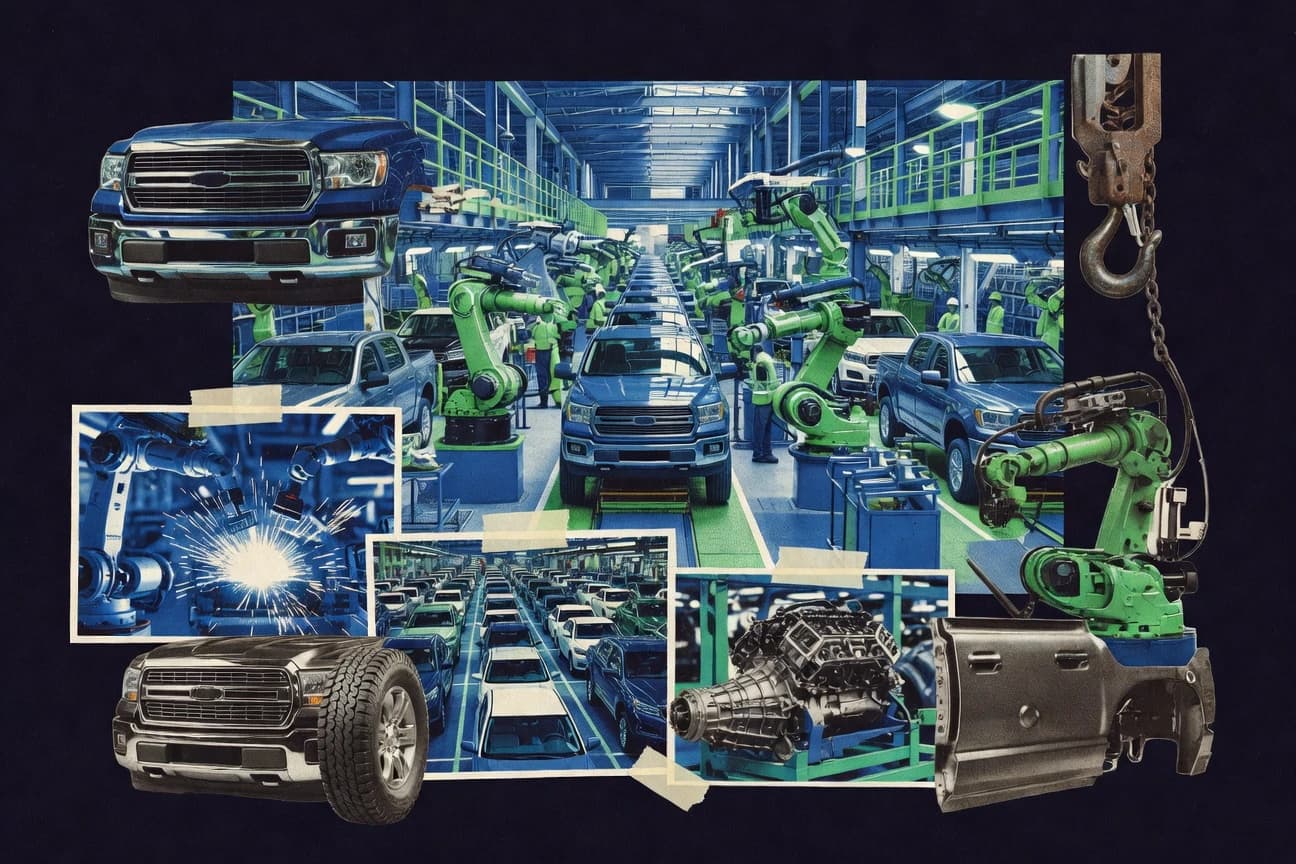
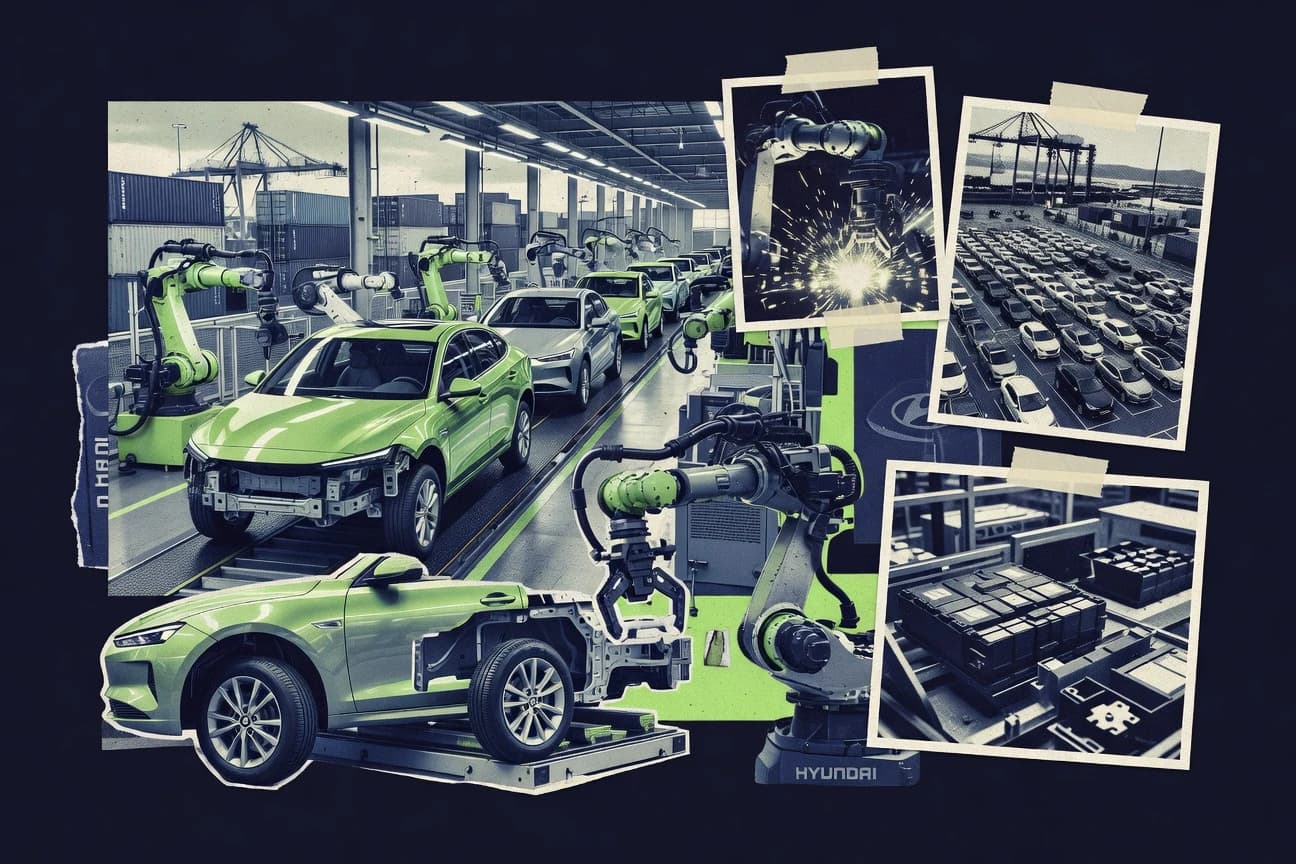
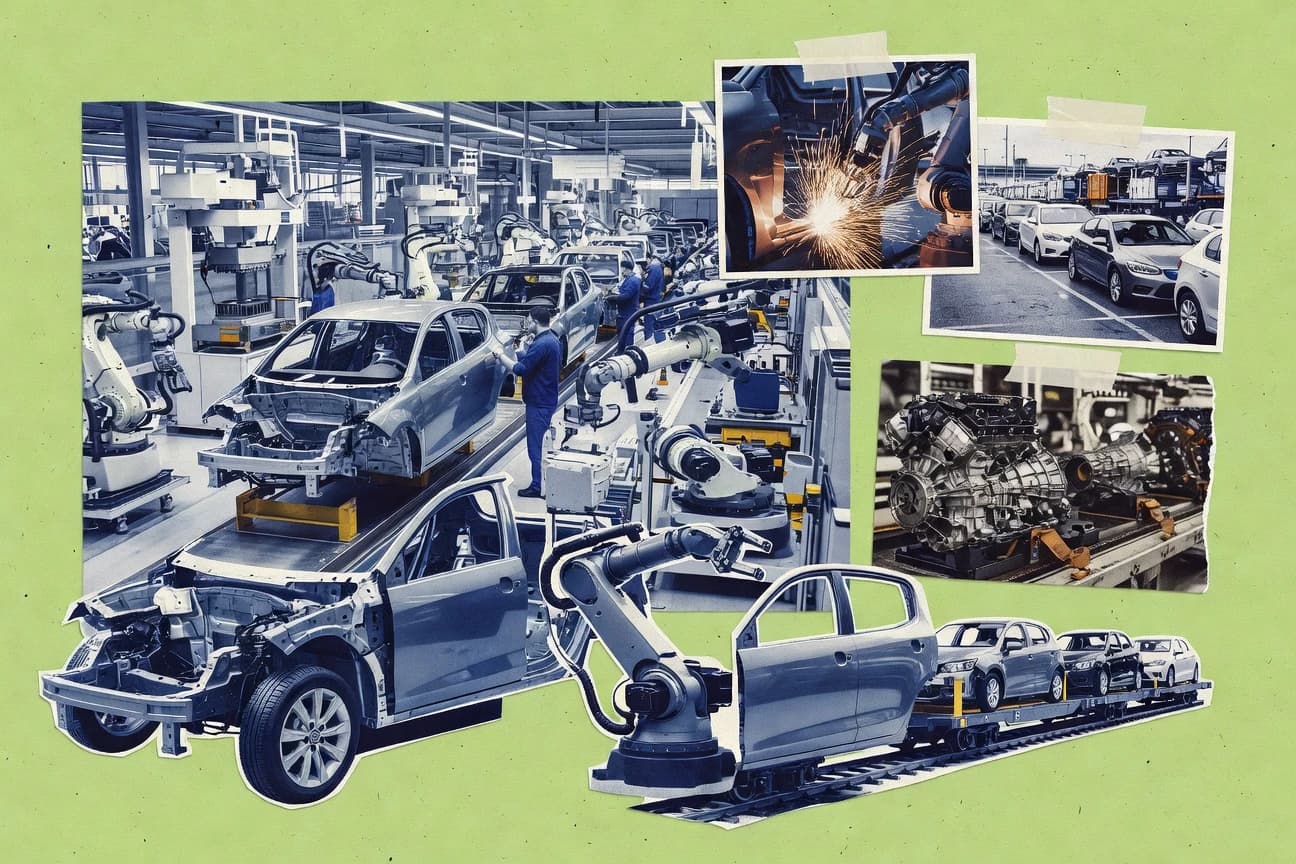
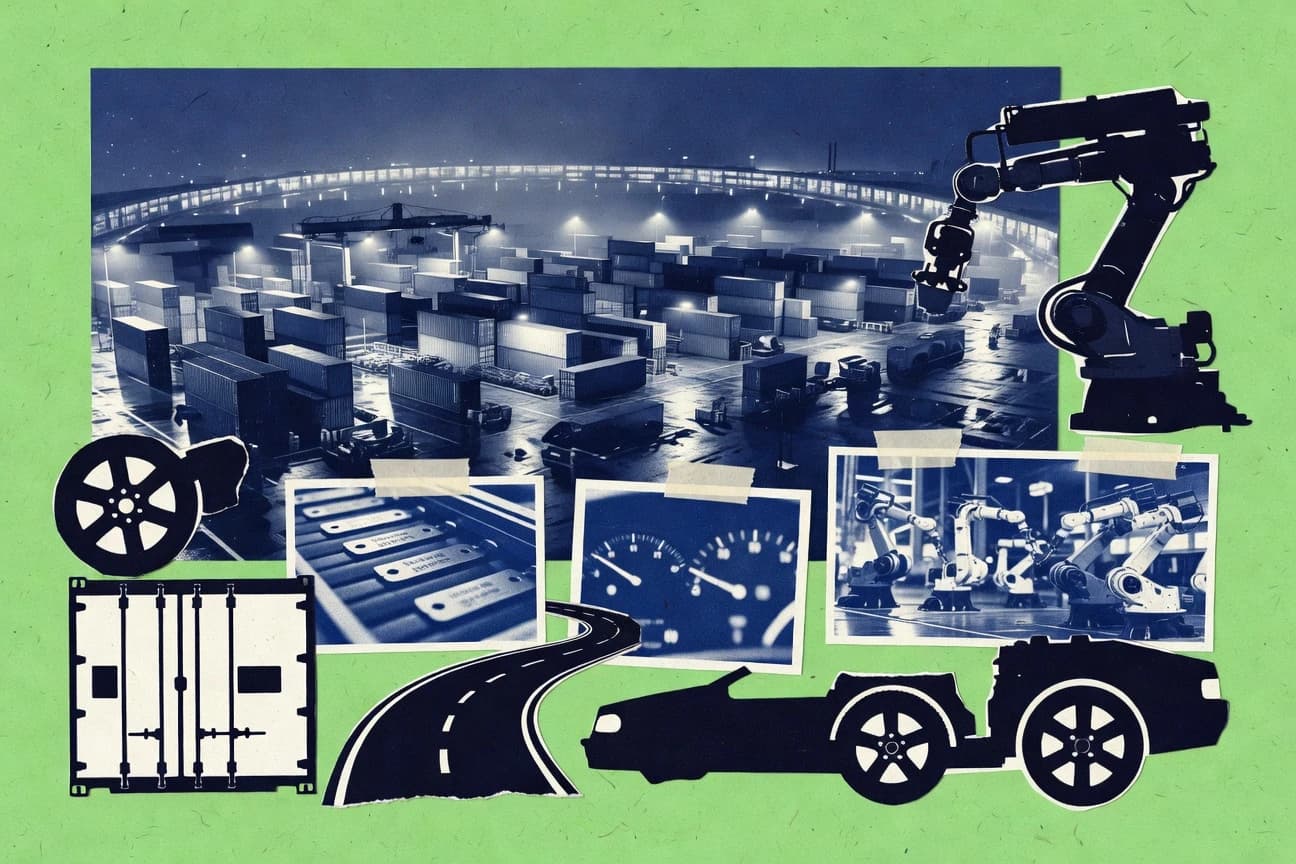
Automotive Industry Statistics
EV infrastructure and adoption are scaling fast, with global light vehicle production reaching 90.1 million units in 2023 while worldwide EV sales hit 14 million. See how BEVs captured 10% of global car sales and how price, charging, and battery recycling trends align with tighter CO2 targets, from $139 per kWh lithium-ion costs to 4 million charging points and 200,000 tons per year of EU recycling capacity.
U S Auto Repair Industry Statistics
With 55% of U S drivers still leaning on repair shops in 2023 and average repair bills clustering around $652 in 2022, this page pinpoints where costs rise and where savings actually come from, including 28% of repairs being warranty covered and shielding consumers from $4B in out of pocket spending each year. It also spotlights how behavior is changing faster than prices, from 35% booking online and 63% using loyalty discounts to EV owners spending 25% more on specialty repairs and 42% of shops reporting staffing shortages in 2023.
Global Automotive Industry Statistics
Global EV momentum is no longer a headline, it is measurable and accelerating, with EV battery capacity demand reaching 550 GWh in 2022 and public fast charger points rising to 1.2 million. See how the shift plays out across brands, regions, and emissions, from Norway’s 87.4% EV share and Tesla’s 1.31 million deliveries to the sector’s impact and jobs behind the transition.