GITNUX MARKETDATA
Browse Our Category
Automotive Services
Latest update:


Tesla Car Fire Statistics
A Tesla fire is rare enough that even insurance claim data points to only 25 EV fires per 100,000 sales, while gas vehicles average 1,529 fires per 100,000 and hybrid vehicles top the list at 3,474 per 100,000. This page also compares real-world patterns behind those rates, including why battery incidents often follow high-speed impact or external conditions and how Tesla’s design and fire-safety systems aim to limit escalation.

Harley Davidson Statistics
Net revenue slid to $5.836 billion and gross margin fell to 23.5% while operating income dropped 40%, yet Harley-Davidson kept dividends climbing to $0.66 per share and pulled $572 million back through share repurchases, with 1,400 dealerships and more than 1 million H.O.G members keeping the brand engine running. From LiveWire deliveries to cash flow of $912 million and a debt to equity ratio of 1.62, this page connects the sharp financial turn with the company’s on the road momentum.

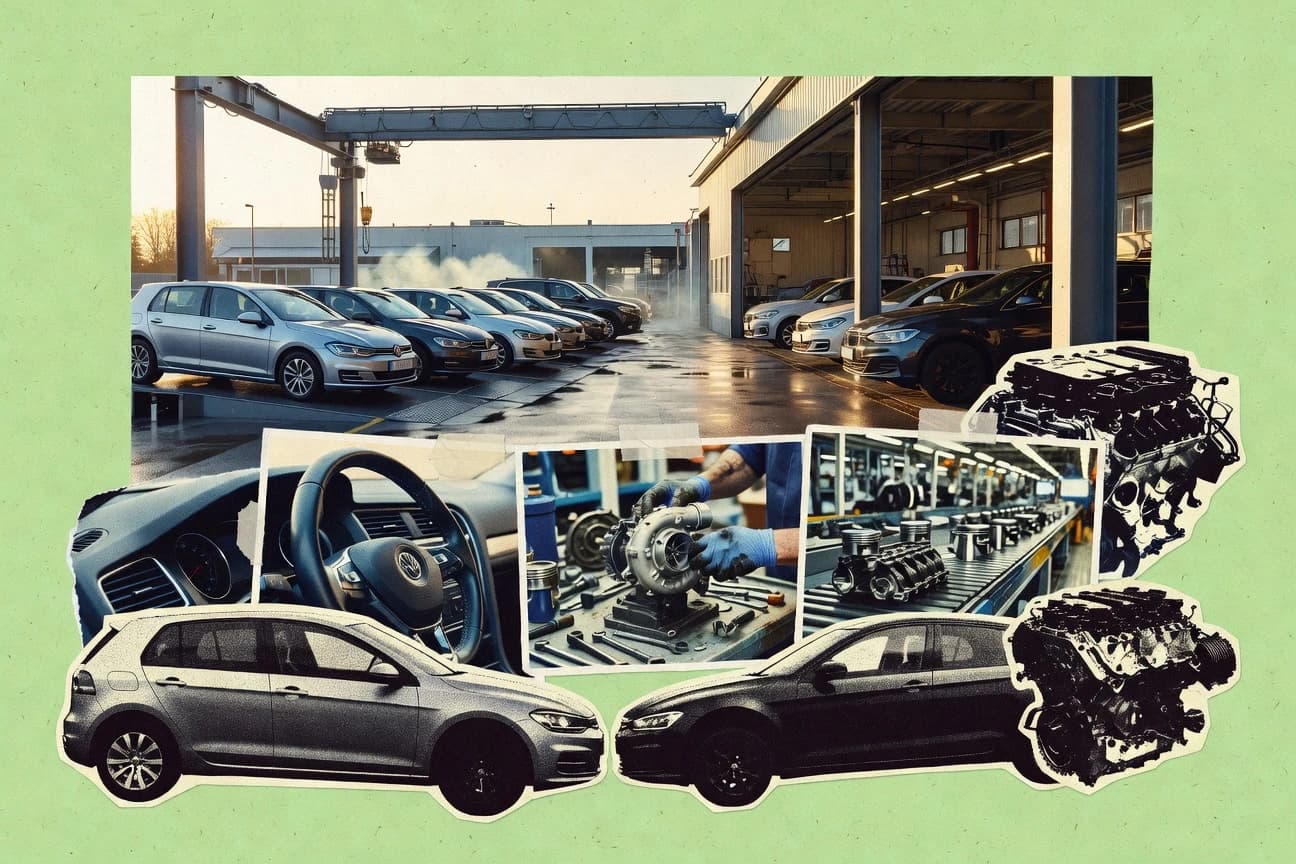
Auto Industry Job Statistics
With U.S. automotive service technicians projected to grow 2% from 2023 to 2033 while U.S. auto manufacturing jobs are expected to fall 5% by 2032, this page tracks where work is shifting across plants, parts, dealerships, and R&D. It also connects the paycheck reality, like the May 2023 median pay for U.S. service technicians, to global scale and churn from battery and EV job surges to regional declines in Europe and beyond.

Auto Industry Employment Statistics
With 725,400 auto service technicians and mechanics in May 2023 and a projected skilled trades gap of 80,000 auto technicians in 2023, the US shortage is hitting the workforce where it matters most. Turn demographic realities into hiring strategy, from women at 28% of US auto manufacturing to a 42 year average age for mechanics, alongside fast shifting global competition and EV driven job creation.
Hybrid Car Sales Statistics
China’s hybrid surge reshaped Asia’s balance sheet, hitting 4.7 million HEVs in 2023 while Europe’s hybrids climbed to 2.1 million, and US hybrids reached 1.3 million in 2023. This page connects those shocks to what matters next, including a global hybrid sales outlook of 18 million by 2025 and the rapidly shifting mix between HEV and PHEV growth.

Tyre Industry Statistics
Michelin still leads with $28 billion in revenue and the top 7 brands control over 50% of the global market, but the real story in 2026 is how manufacturing and technology are flipping the playbook as silica compounds cut rolling resistance by 20% and RFID adoption reaches 20% of truck fleets. From Yokohama Rubber’s 985 billion yen revenue to nitrogen keeping tire pressure 3 to 4 times longer than air, this page connects leaderboard power with the science and compliance that determine who wins next.
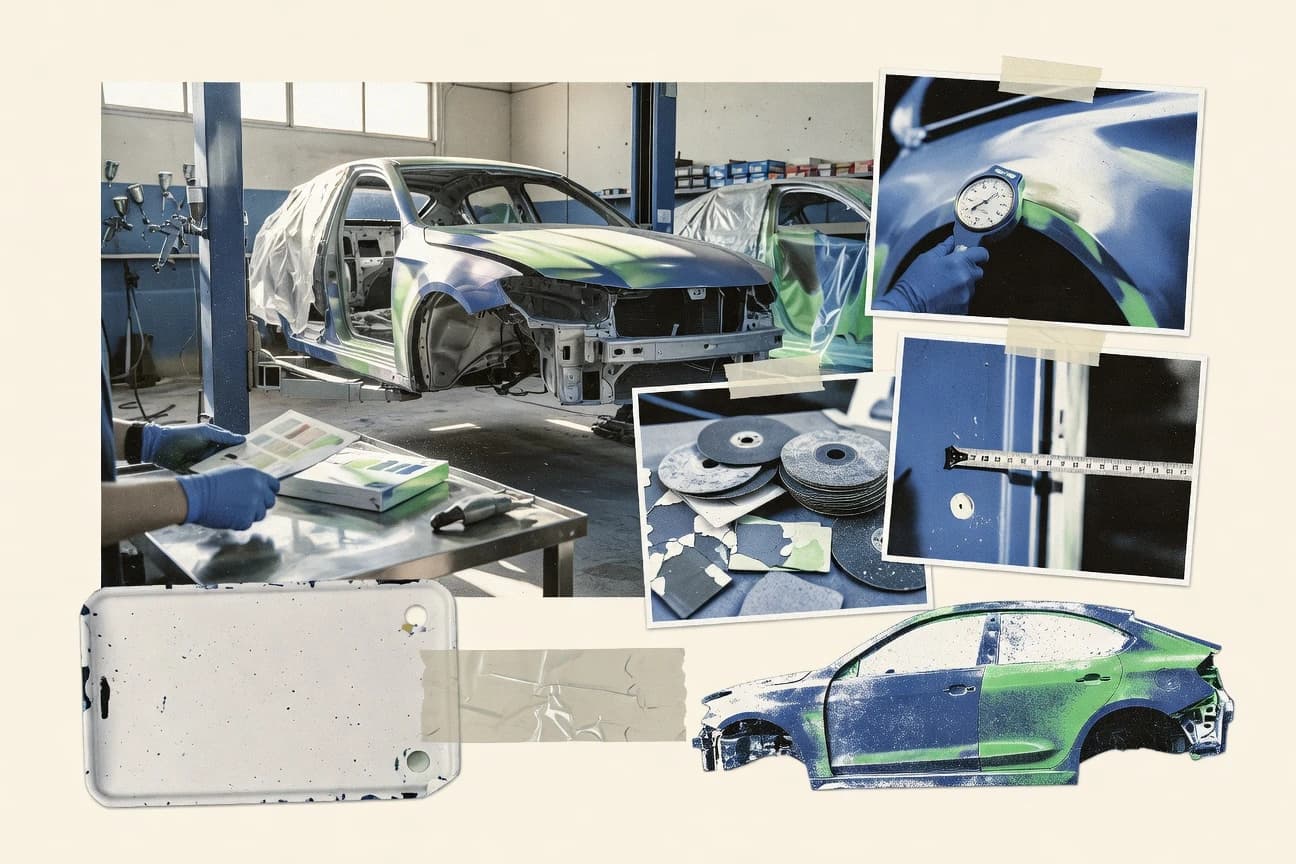
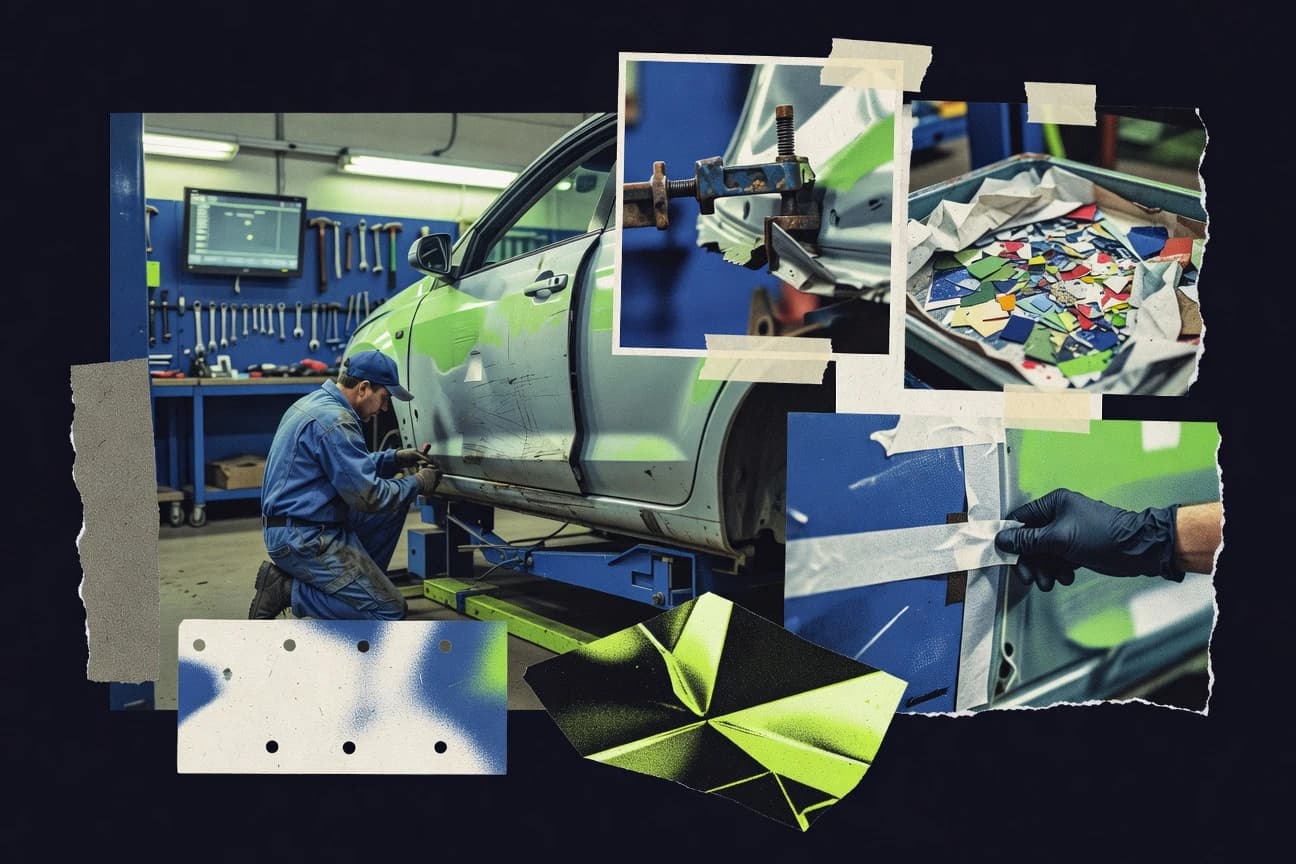
Body Shop Industry Statistics
Body Shop Industry benchmarks reveal how choice and cost are colliding, from 67% of U.S. consumers following insurance recommendations to the average repair bill landing at $3,250 and only 34% reporting satisfaction with post repair quality checks. Coverage also maps the staffing squeeze and digital shift, with 85% of shops citing technician shortages and 92% using digital estimating software, plus market signals like EV certified demand and ADAS readiness pushing faster change than repair cycle expectations of 7.2 days.

U.S. Automotive Industry Statistics
Even with 78.2% capacity utilization in 2023, U.S. auto manufacturing unemployment sits at just 3.8% and the industry supports millions of jobs from assembly to dealerships. Follow how wages, union strength, and new EV infrastructure like NEVI’s $5B plan for 50,000 chargers are reshaping work, output, and buying across states.

Motor Trade Philippines Industry Statistics
Even with a vehicle ownership rate of 45 cars per 1,000 people, Motor Trade Philippines tracks the big shifts in what Filipinos actually buy and why, from 78% Japanese brand preference and SUVs taking 35% of city sales to hybrids growing 25% and EVs projected to reach 10% by 2027. The page also links demand to the real economy, including PHP 150 billion spent on aftersales each year, auto employment at 250,000 direct jobs in 2023, and a PHP 600 billion total addressable market by 2025.
Germany Auto Industry Statistics
Germany’s auto industry still anchors a huge workforce, with 835,000 people directly employed in 2023 and 210,000 working in automotive R and D, yet 30,000 job cuts were announced for 2023 to 2024, even as exports hit €147 billion. You can track where the strength comes from, from 77% of production exported to rising electric vehicle output of 250,000 units, alongside labor realities like 18% foreign workers, a 3.2% auto unemployment rate, and 50,000 vacancies in auto IT roles.

Vinyl Wrap Industry Statistics
From 2023 to now, vinyl wrapping is spreading beyond vehicle skin changes, with the global market reaching USD 5.12 billion and projected to hit USD 8.47 billion by 2030, while 3M alone commands 32 percent of the market. The page connects where demand actually concentrates, from passenger cars at 55 percent to public transit bus wraps at 28 percent and retail storefront wraps at 30 percent, showing how specialty formats and premium materials are reshaping revenue priorities for 2025 and beyond.
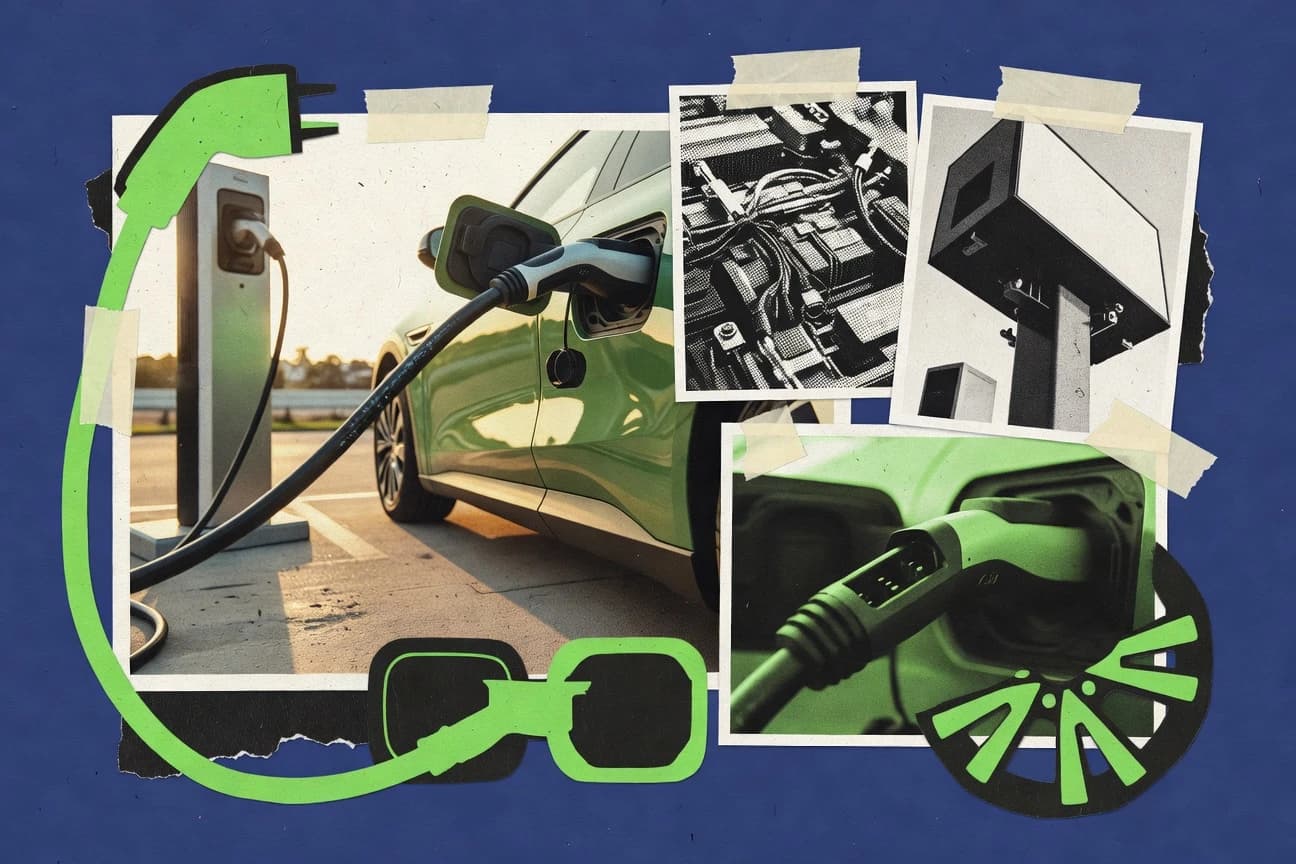
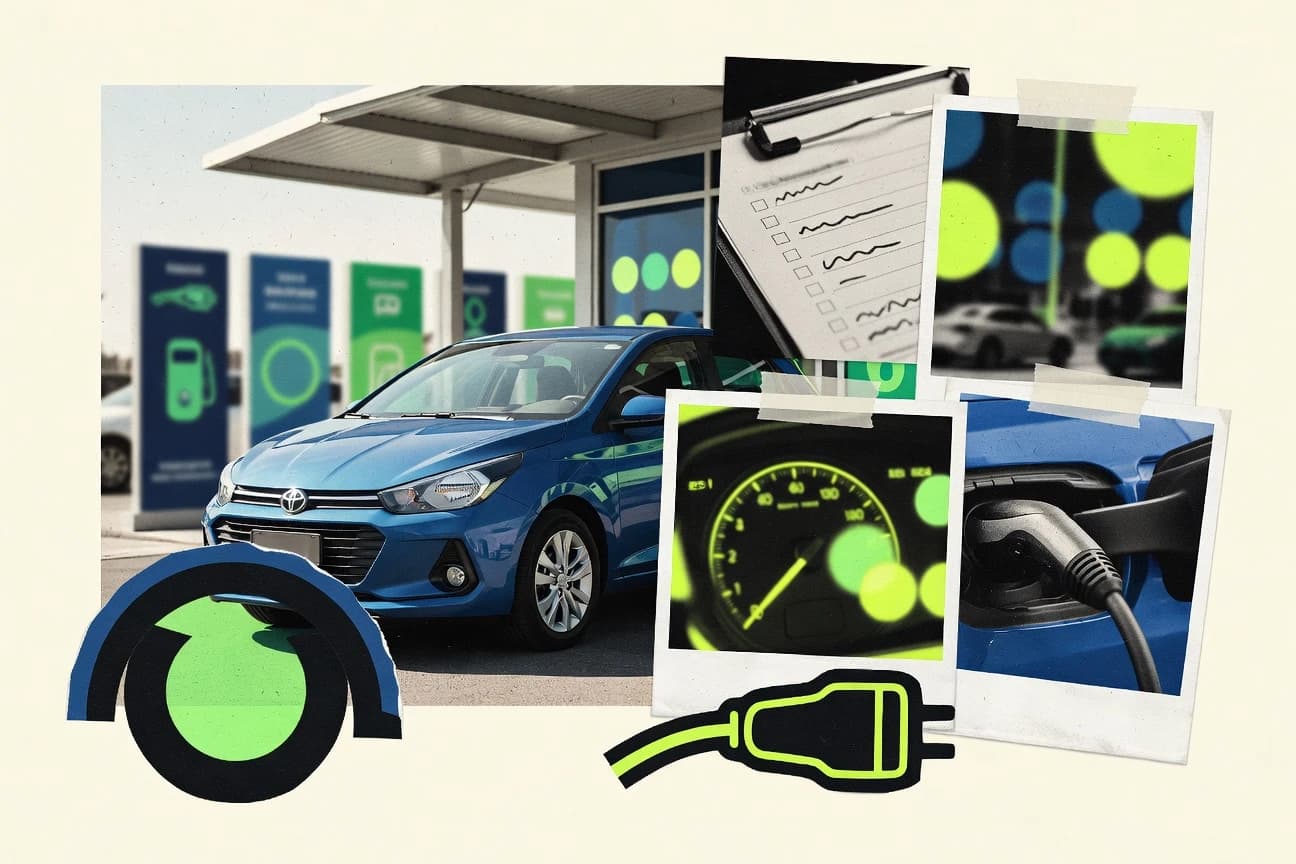
Automotive Electric Vehicles Industry Statistics
EV battery economics shifted fast in 2023, with average pack prices down to USD 139 per kWh and global demand reaching 750 GWh, while faster networks and new chemistries push charging and range forward at the same time. Read the page to connect the dots from LFP taking 41% of the market to recycling capacity projected at 3.5 million tons by 2030, plus the charging roll up to 4 million public chargers worldwide.

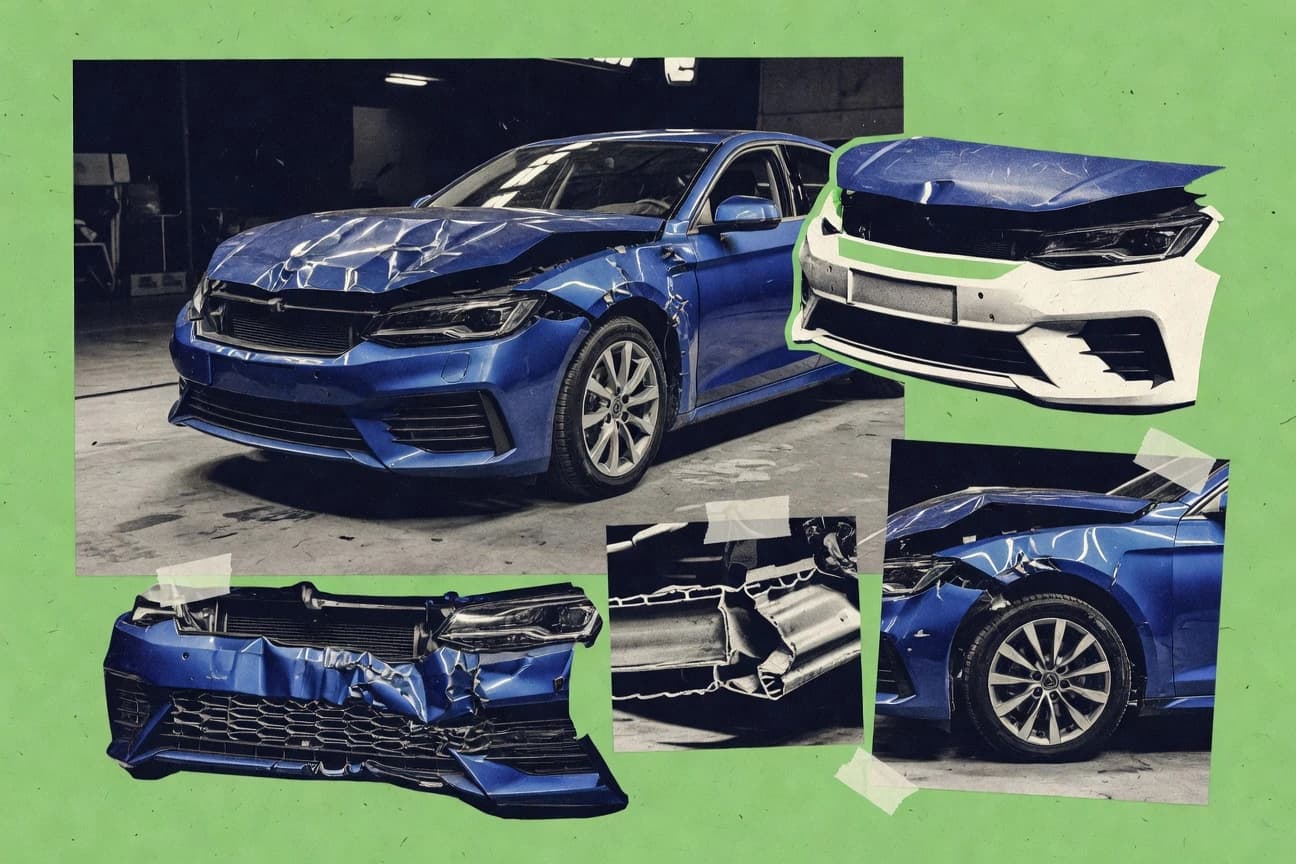
Auto Body Industry Statistics
With U.S. shops facing higher demand and higher costs, this Auto Body Industry statistics page highlights how repair timelines average 14.3 days and structural damage drives 55% of repairs, alongside the reality that 41% of drivers delay repairs due to price. It also tracks the shift toward certified, tech enhanced collision work, from EV and ADAS driven complexity to online reviews shaping 82% of shop choices.
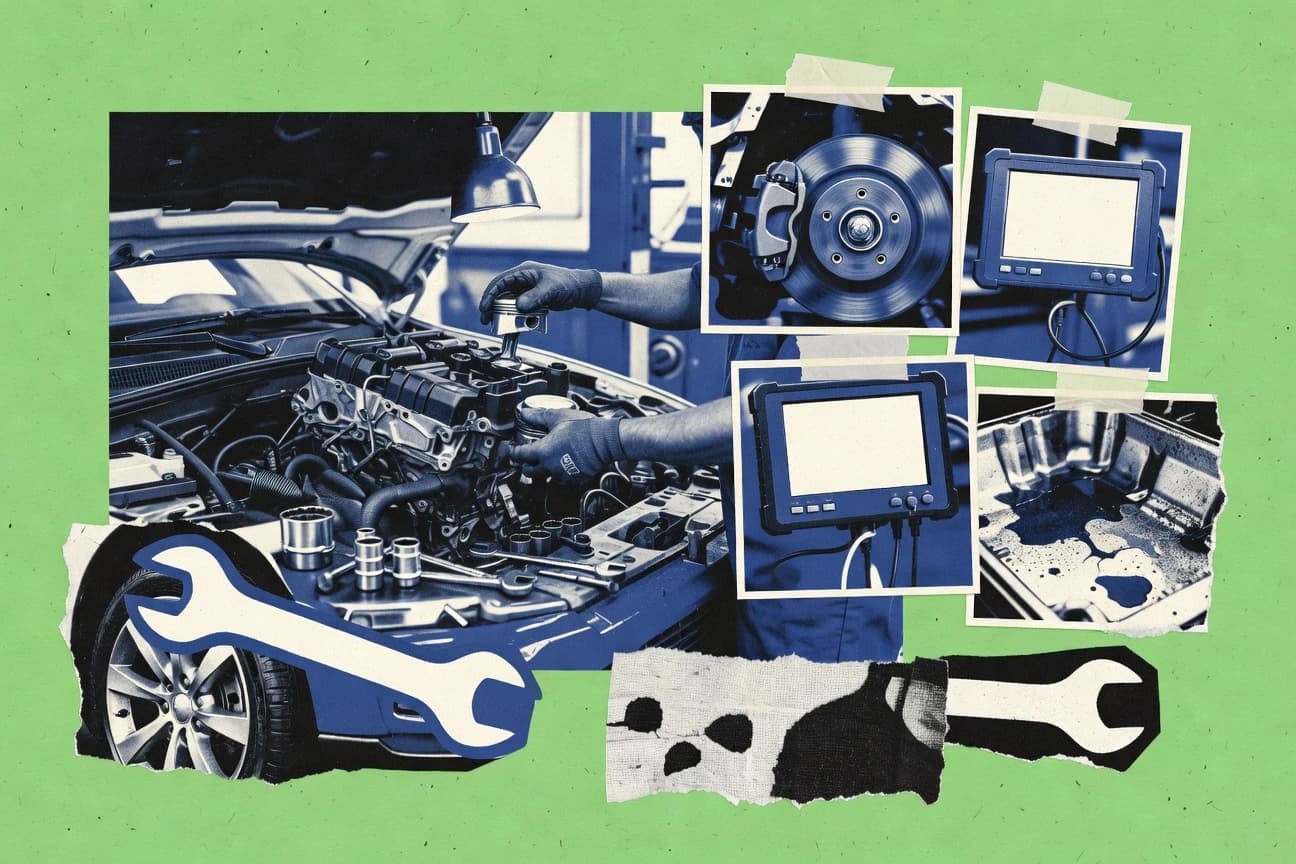
Automobile Repair Statistics
Vehicle repair costs and choices are shifting fast, with U.S. diagnostic fees averaging $125 and brakes running about $650 as of 2023 while EV and ADAS pressure is changing what shops can offer by 2025 and beyond. This page contrasts spending, booking habits, and staffing gaps across countries and generations so you can see exactly why 67% of U.S. drivers favor independent shops and how shortages and tech gaps are reshaping every repair visit.
Crumple Zones Statistics
See how today’s crumple zones cut injury metrics in back to back tests, from IIHS 64 km/h offset results limiting HIC to under 400 and chest deflection down 45 percent, to Global NCAP 40 km/h offsets cutting driver injury risk by 50 percent. You will also find the practical engineering tells that explain the performance, like deformation energy up to 200 kJ, predicted by 95 percent accurate FEA models, and real world type outcomes such as IIHS rear testing at 80 km/h preventing fuel tank breach in 95 percent of cases.
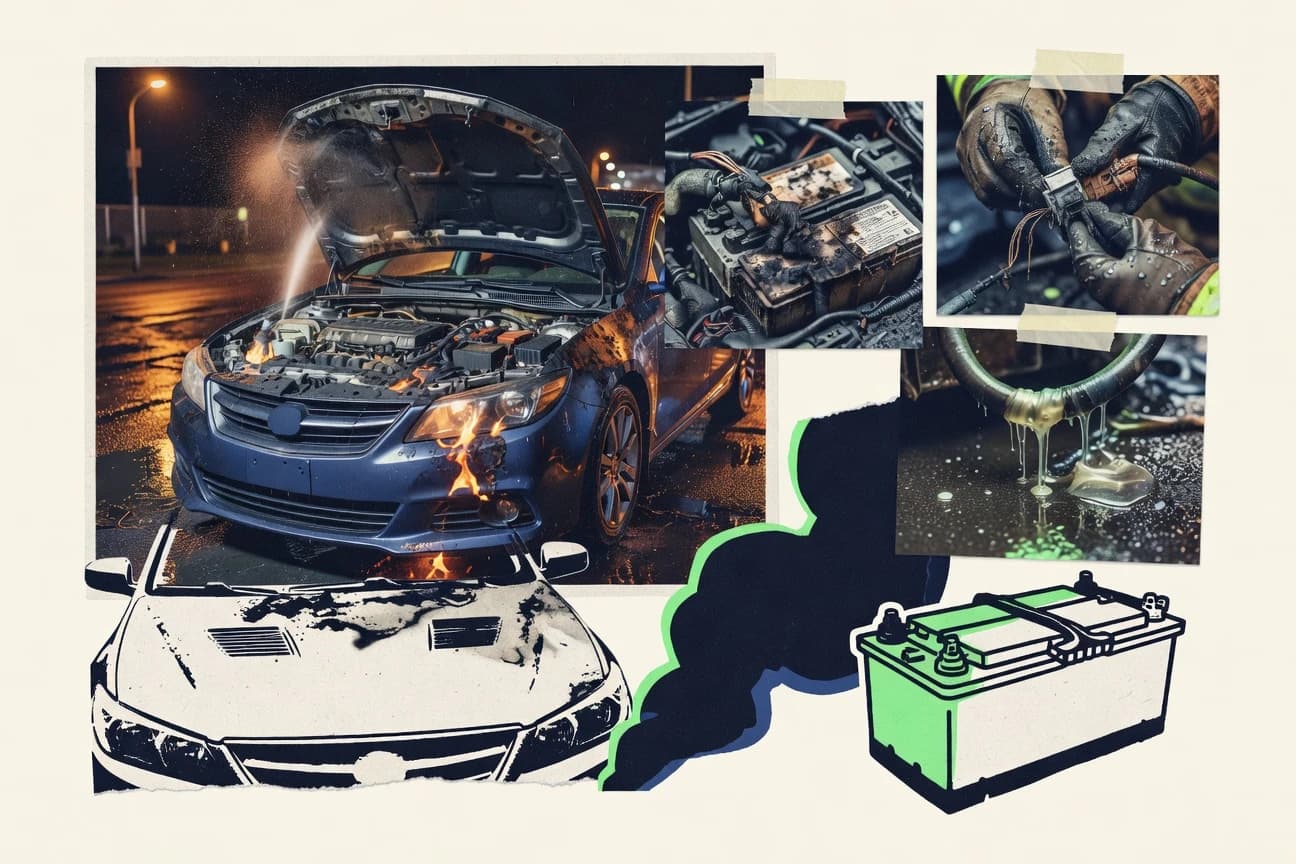
Hybrid Car Fire Statistics
Battery thermal runaway drives 62% of hybrid fires, but a second pattern matters just as much for safety decisions, collision impact accounts for 28% and Europe reports 19% from electrical short circuits. From $45,200 average property damage to how well modern shutdown systems cut off ignition, this page connects the highest risk mechanisms to what firefighters and fleets can actually prevent.
Auto Repair Collision Industry Statistics
With U.S. collision claims still climbing to 6.7 million and cycle times stretching to 22.3 days, the repair timeline is tightening even as ADAS and structural work pull jobs forward. This page connects the hotspots behind the averages, from rear end claims and EV repair delays to shop labor pressures, so you can see what is changing in the collision repair business and what it means for cost, staffing, and throughput.

Airbag Statistics
Airbag technology is big business and life saver at once, with the global market hitting $25.6 billion in 2022 and patents still filing at a steady 15,000 per year from 2015 to 2022, while the human stakes show up in 7,100 fewer deaths projected without side airbags. This page connects manufacturing and regulation to real-world outcomes, from Autoliv’s 120 million modules in 2022 to insurance and recall costs like the $1.6 billion Takata recall bill, so you can see exactly what progress is costing and preventing.

European Automotive Industry Statistics
With EU passenger car production up to 3.2 million units in Q1 2024 and new registrations rising 2.3% to 3.2 million, the page pinpoints where Europe’s momentum is coming from and why it varies so sharply by country. It ties the workforce and R&D engine behind the shift to factory output, from Germany’s 2.86 million new car registrations to BEVs reaching a 14.6% share in 2023.
Automotive Recall Statistics
Across 2025, US NHTSA reported 1,035 vehicle recalls affecting more than 31 million vehicles, with foreign brands driving 68 percent of the total, so the real question is what is happening under the hood and why it is still scaling. Compare brand highlights like Ford rear axle bolt recalls, Tesla software and Autopilot issues, and the ongoing airbag fallout that accounts for 28 percent of all recalls since 2010 alongside the cost and crash consequences that come with them.