GITNUX MARKETDATA
Browse Our Category
Automotive Services
Latest update:


Ppf Paint Protection Film Industry Statistics
Hydrophobic and self healing tech is moving from a feature to a deciding factor, with 65% of PPF buyers prioritizing self healing and 58% valuing hydrophobic performance in the latest 2023 surveys. This page ties those preferences to the market reality that global PPF demand reached $1.2 billion in 2023, with the automotive segment at 78% share, so you can see exactly why protection choices, pricing pressure, and brand momentum are reshaping installs worldwide.
Malaysia Automotive Industry Statistics
Malaysia’s auto sector supported 750,000 jobs and paid an average RM3,200 monthly wage in 2022 while women made up 35% of the workforce and training through MIM helped upskill 50,000 workers, but the real jolt is how quickly EV plans are reshaping hiring and investment. From exports that hit RM20.5 billion for 372,000 vehicles to R&D personnel rising to 18,000 and a 2023 surge of 20,000 new jobs, this page connects factory output, talent, and cross border demand in one clear Malaysian snapshot.
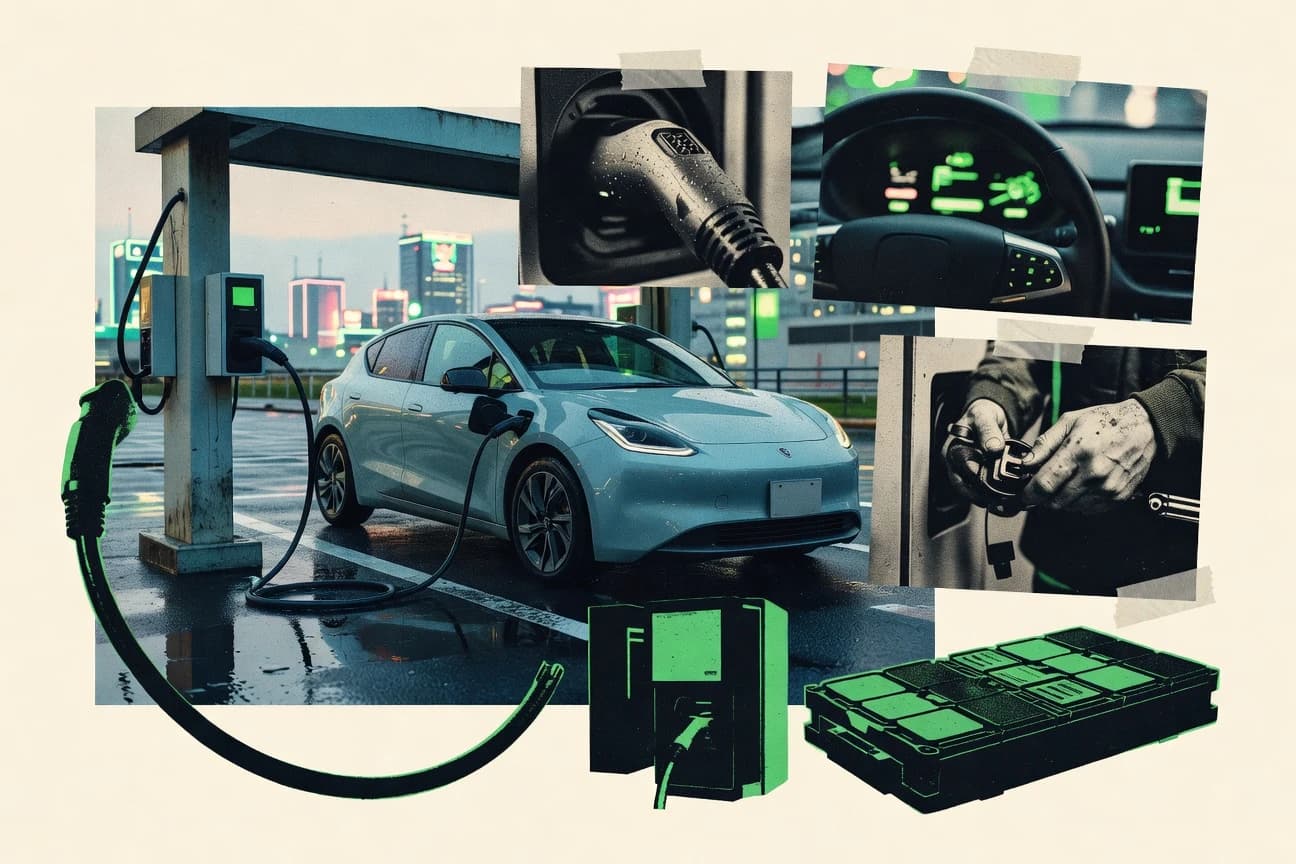
Japan Ev Industry Statistics
Japan’s EV industry numbers are moving fast toward 2030, with 1,200 solid-state battery patent filings by Japanese firms in 2023 and a 2025 milestone where a CATL Japan LFP joint venture alone targets 20 GWh capacity. The page links those battery breakthroughs to chargers and adoption, from 38,000 public charging units in 2023 to the surprising gap between rising infrastructure and still-low utilization.

Car Sales Industry Statistics
A 2023 snapshot that still feels urgent because buying behavior keeps shifting fast, with U.S. new car shoppers getting to purchase in just 52 days while 45% researched online and online negotiations cut deals by an average $1,200. From 72% prioritizing fuel efficiency to EV first-thinking among 38% of Gen Z and Norway’s 89% EV share, these Car Sales Industry stats explain exactly why what drives a sale today is changing buyer by buyer.
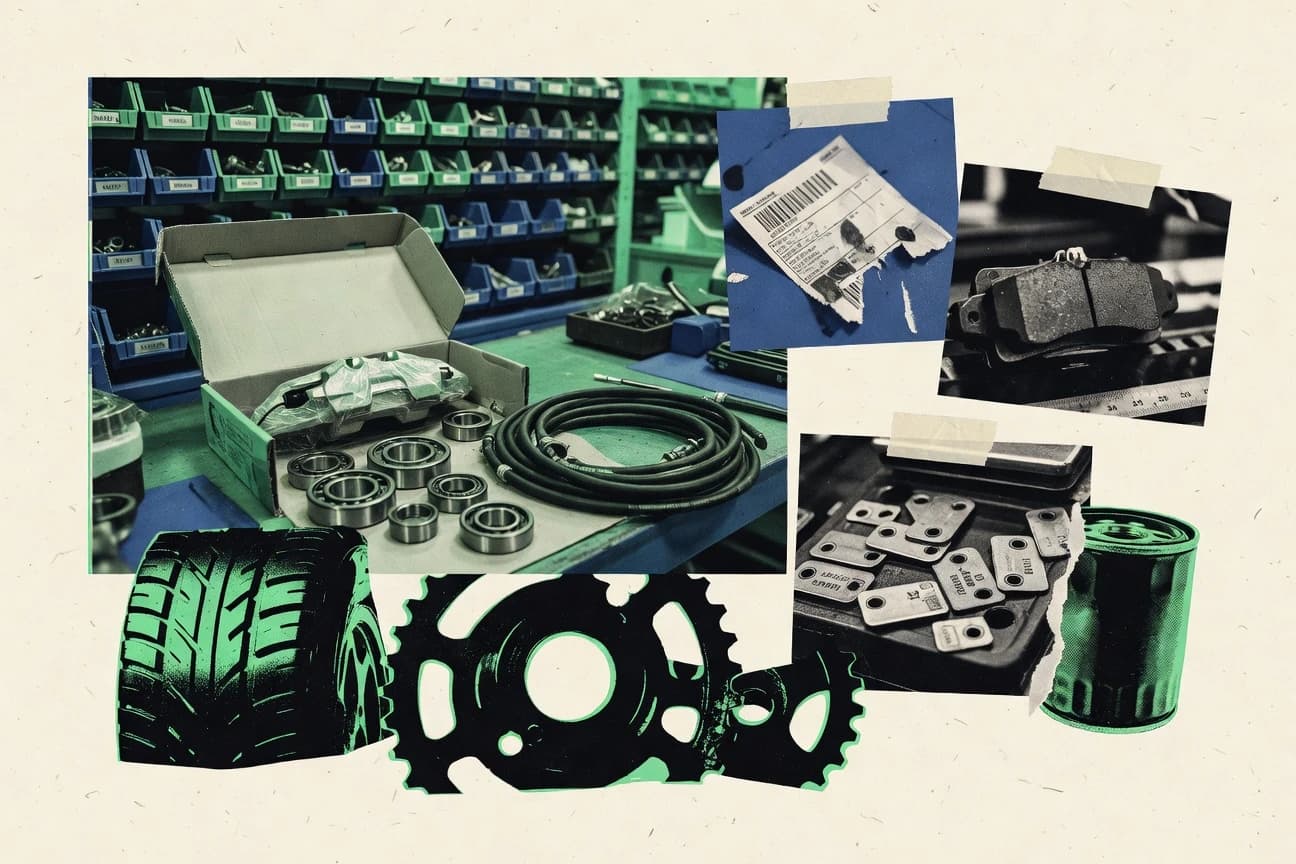
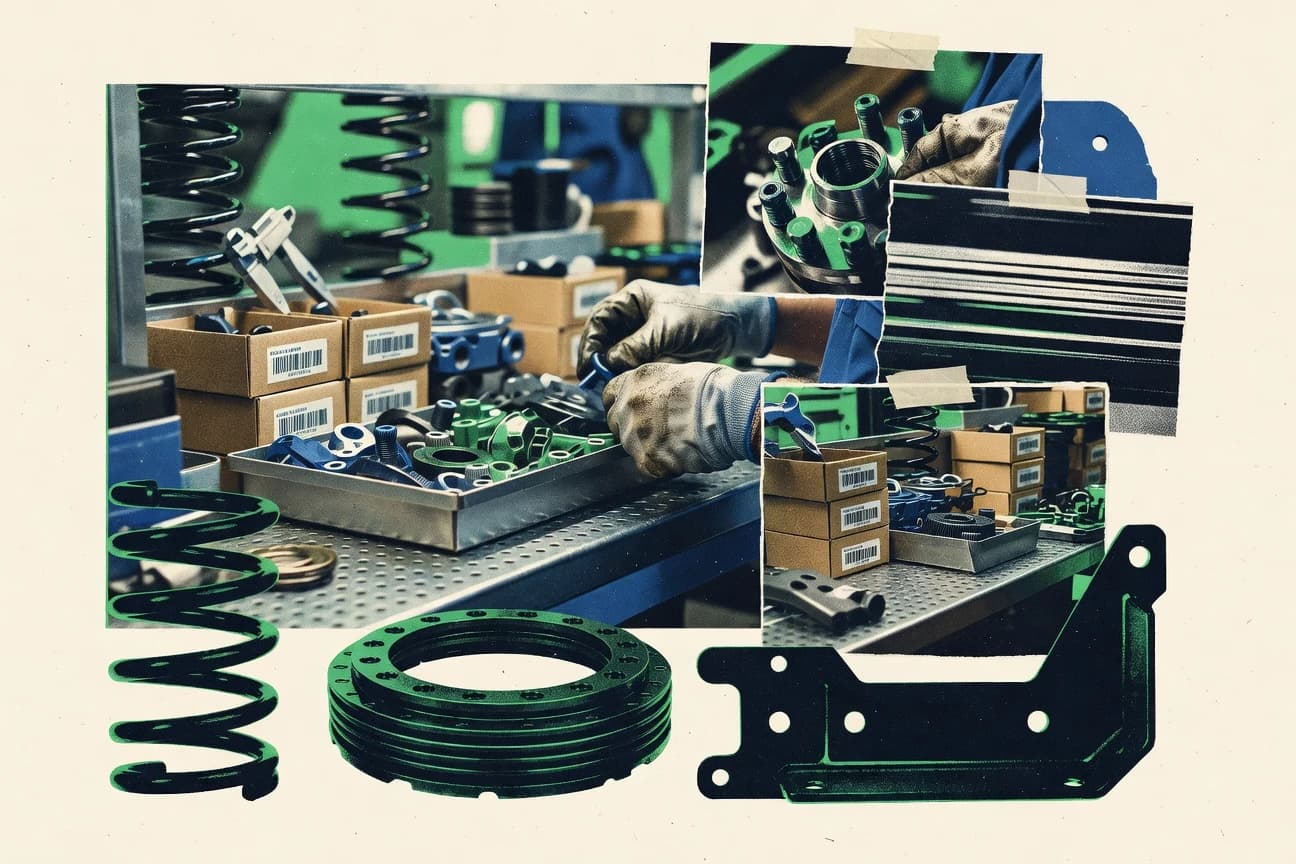
Automotive Parts Industry Statistics
Auto parts employment spans 20 million globally, yet in the U.S. the sector employs 1.1 million workers in 2023 while wages average $60,000 and labor productivity is rising 2% year over year, revealing how faster output is reshaping work. See how automation is projected to take 20% of parts jobs by 2030 alongside a projected 3.9% CAGR in a market valued at USD 572.81 billion in 2023, plus the split between OEM dominance and a massive aftermarket that supports 4.5 million U.S. jobs.
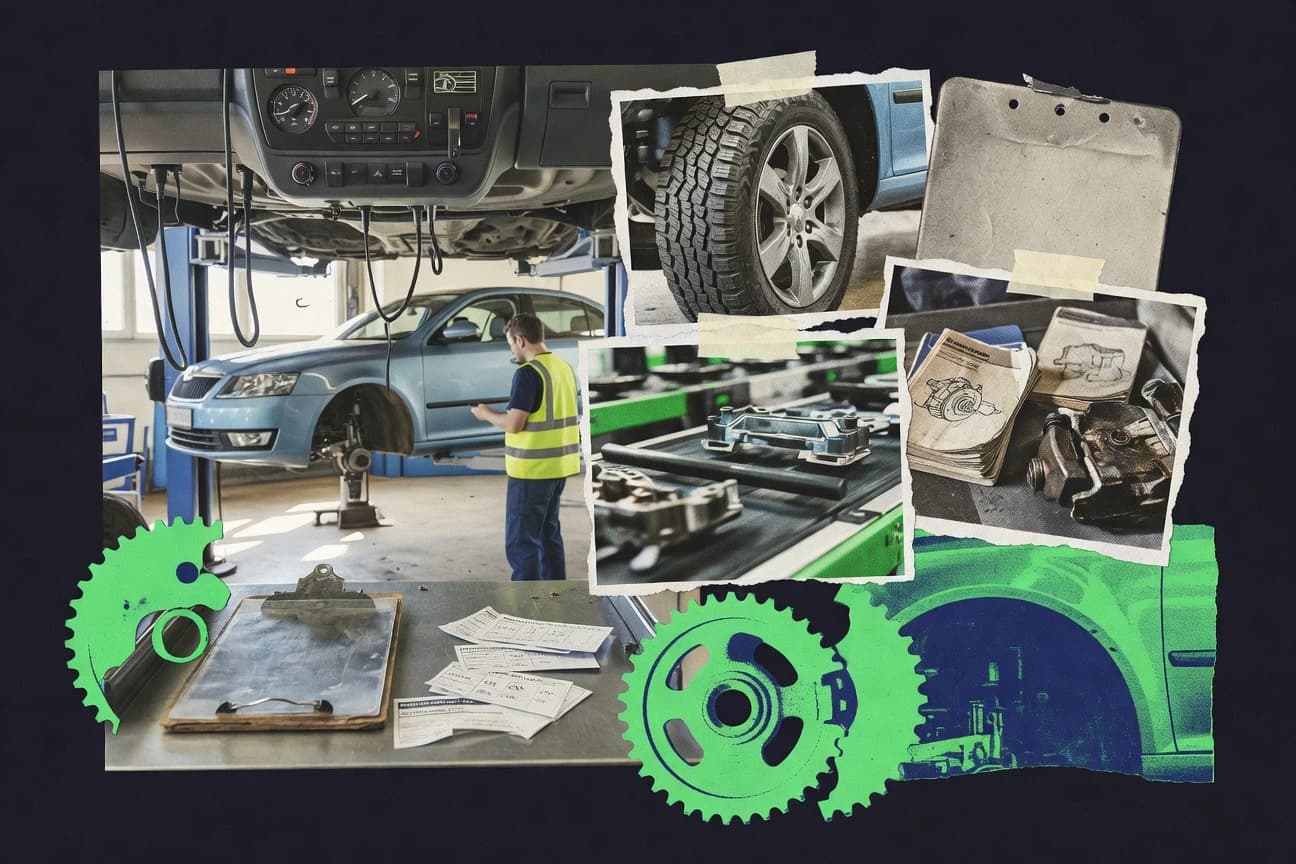
Czech Auto Industry Statistics
With 1,250,000 vehicles exported in 2022 and 4.5% YoY growth in Czech auto labor productivity in 2023, this page explains how the industry’s output momentum keeps pulling demand through every layer from engineers and suppliers to the export machine. It pairs that scale with people and pressure points, from a 2.1% unemployment rate among auto workers and 28% women in the workforce to safety incidents down 15% to 1,200 cases, so you can see what is powering performance in the Czech auto sector.
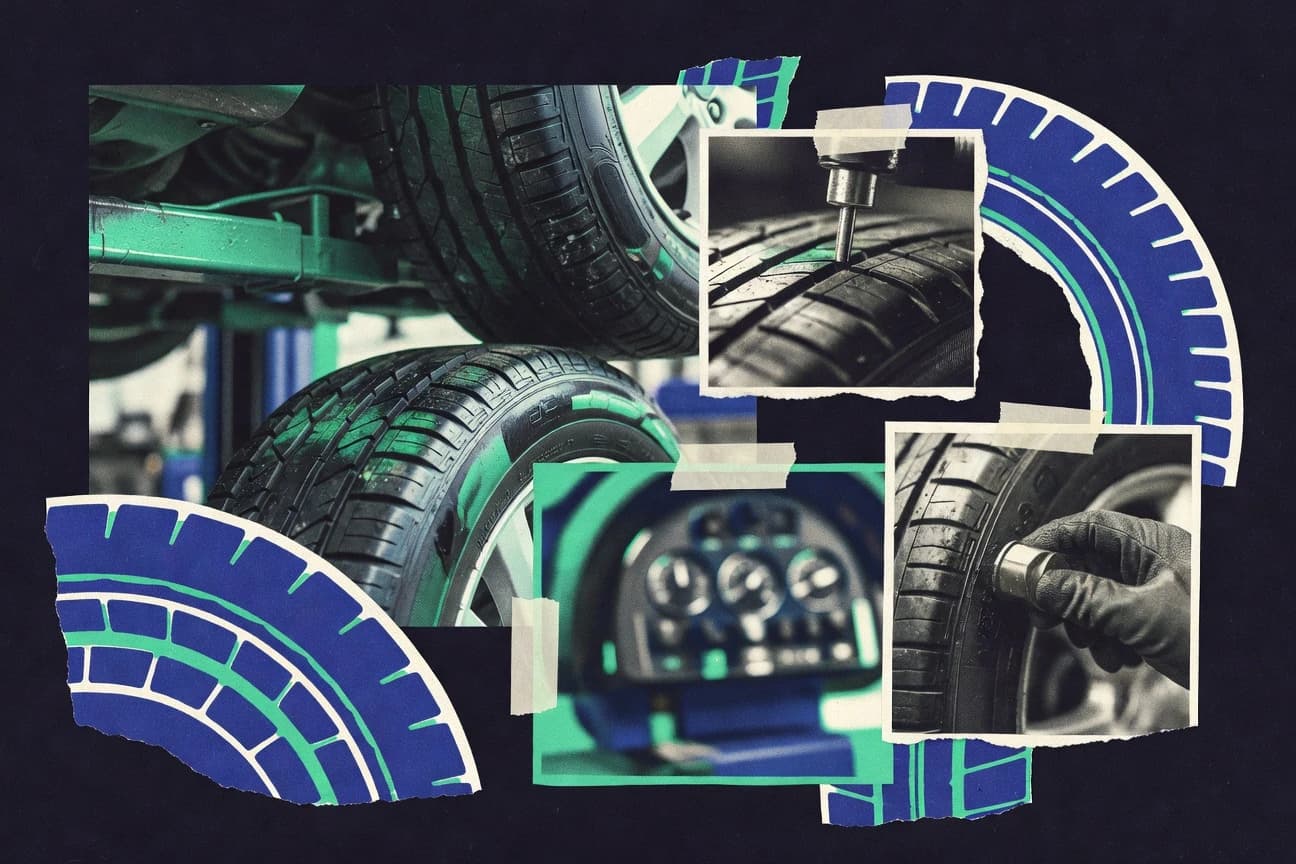
Tires Statistics
Global tire production still emits 1.8 Gt CO2e every year, yet smarter materials and performance targets are already changing the tradeoffs, from EU A label savings of 7.3 kg CO2 per 1,000 km to retreading that cuts energy use by 70%. This page weighs the hidden impacts too, including 1 million tons of microplastics from tire wear and the scale of circular options like 81% of US tire recycling, so you can see exactly where progress is happening and where it is not.
Aftermarket Parts Industry Statistics
With the global automotive aftermarket set to reach $612.4 billion by 2030 on a 3.8% CAGR and EV aftermarket parts projected to surge at a 15.2% CAGR to $85 billion, the growth is shifting fast toward electrified repairs. This page connects that momentum to what buyers actually do, from US DIY parts sales rising to $9.2 billion in 2023 to 62% of drivers still choosing OEM for critical jobs, plus how regional winners like Asia Pacific and EV specific categories are reshaping demand.
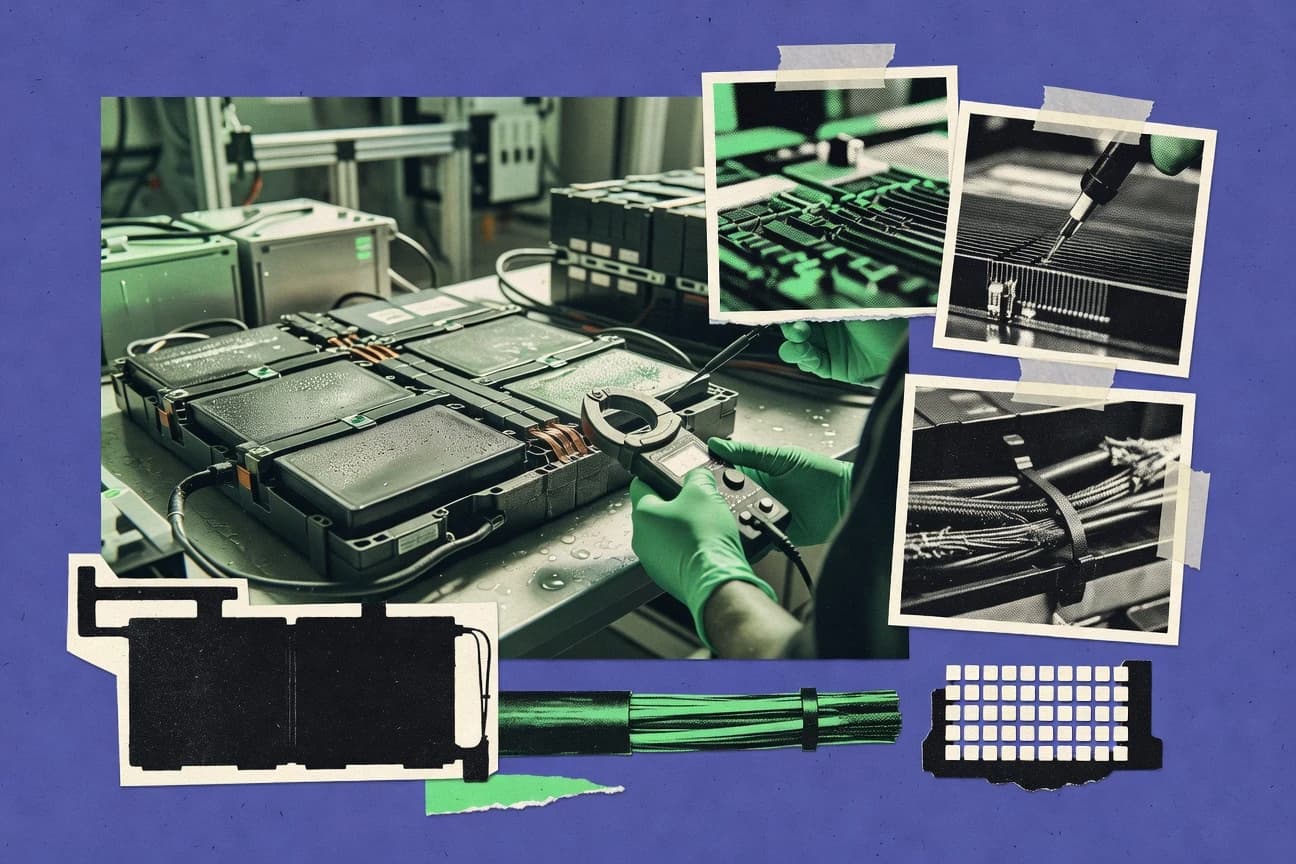
Ev Battery Industry Statistics
EV battery stats are moving fast enough to break assumptions. Global EV battery demand is projected to reach 3.5 TWh by 2030 while prices slipped to $139 per kWh in 2023, and the technology gap is widening from 190 Wh per kg pack performance to solid state and sodium ion promises like 500 Wh per kg and cobalt free commercialization.
Ftc Auto Industry Statistics
FTC monitoring found 45,672 consumer complaints tied to auto sales and advertising in 2023, a 12% jump from the year before, while enforcement and testing uncovered everything from exaggerated EV range to warranty claims being quietly withheld. If you want to understand how “qualified” promotions, loan packing, and repair denials keep showing up in real listings and real invoices, this page connects the dots with FTC sourced evidence.
Eu Auto Industry Statistics
EU auto manufacturing is under pressure to retool while it still supports 13.8 million jobs across the sector, including 1.2 million direct manufacturing roles and 380,000 people in EU auto R&D. Track how production and demand are shifting toward electrification, from BEV output at 1.6 million cars in 2023 to registrations climbing 13.9% for passenger cars that year, alongside trade surpluses of €109.4 billion and a workforce whose female share reached 22% in 2022.

German Auto Industry Statistics
German automotive power still drives more than 5% of Germany’s GDP and delivers €90 billion in industry tax revenue, yet the competitive pressure shows up fast with OEM profits ranging from €12.2 billion net at BMW to €0.8 billion EBIT for Opel after its turnaround. Track how €35 billion capex, 80% export dependency, and €10 billion sustainability investment are reshaping 835,000 direct jobs and a sector that now ships a quarter of its passenger output as BEV and PHEV.
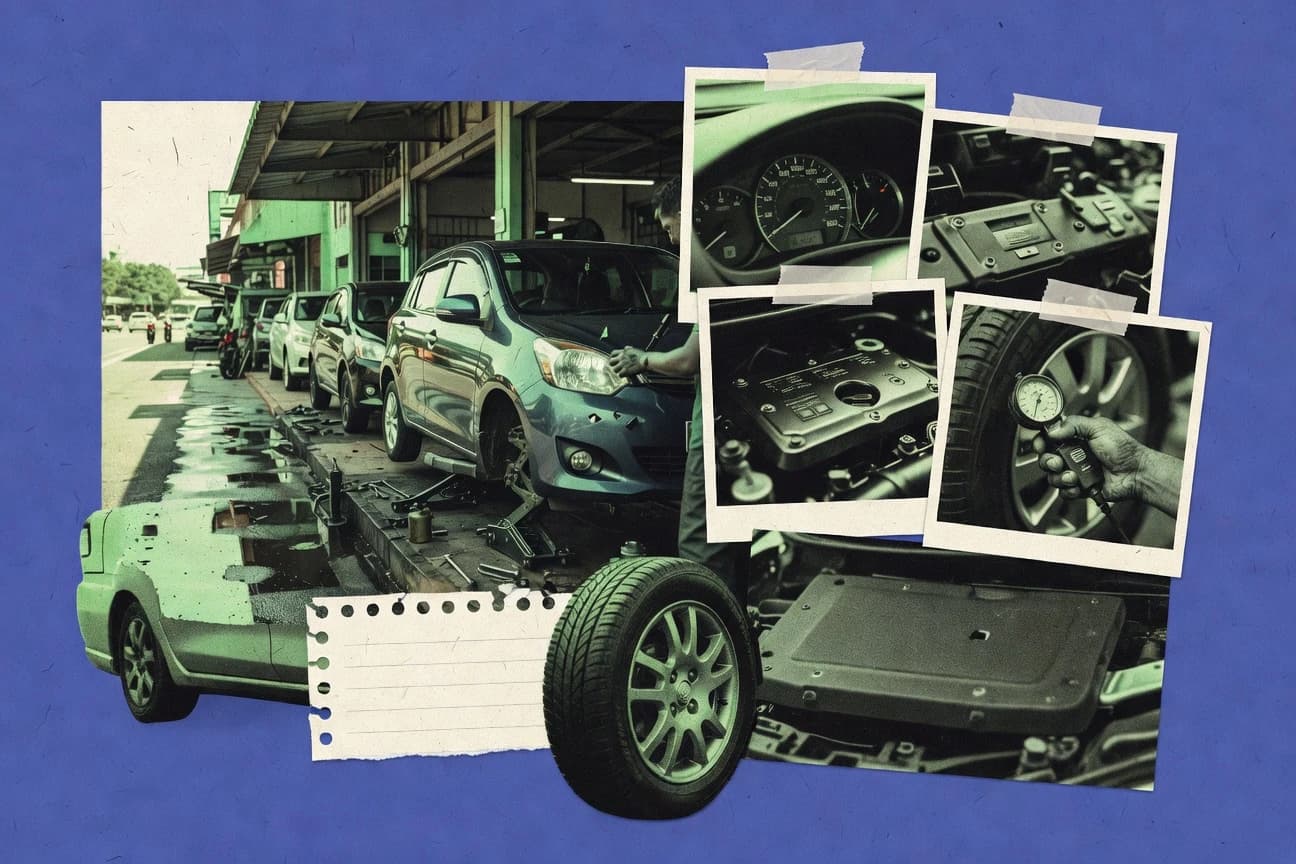
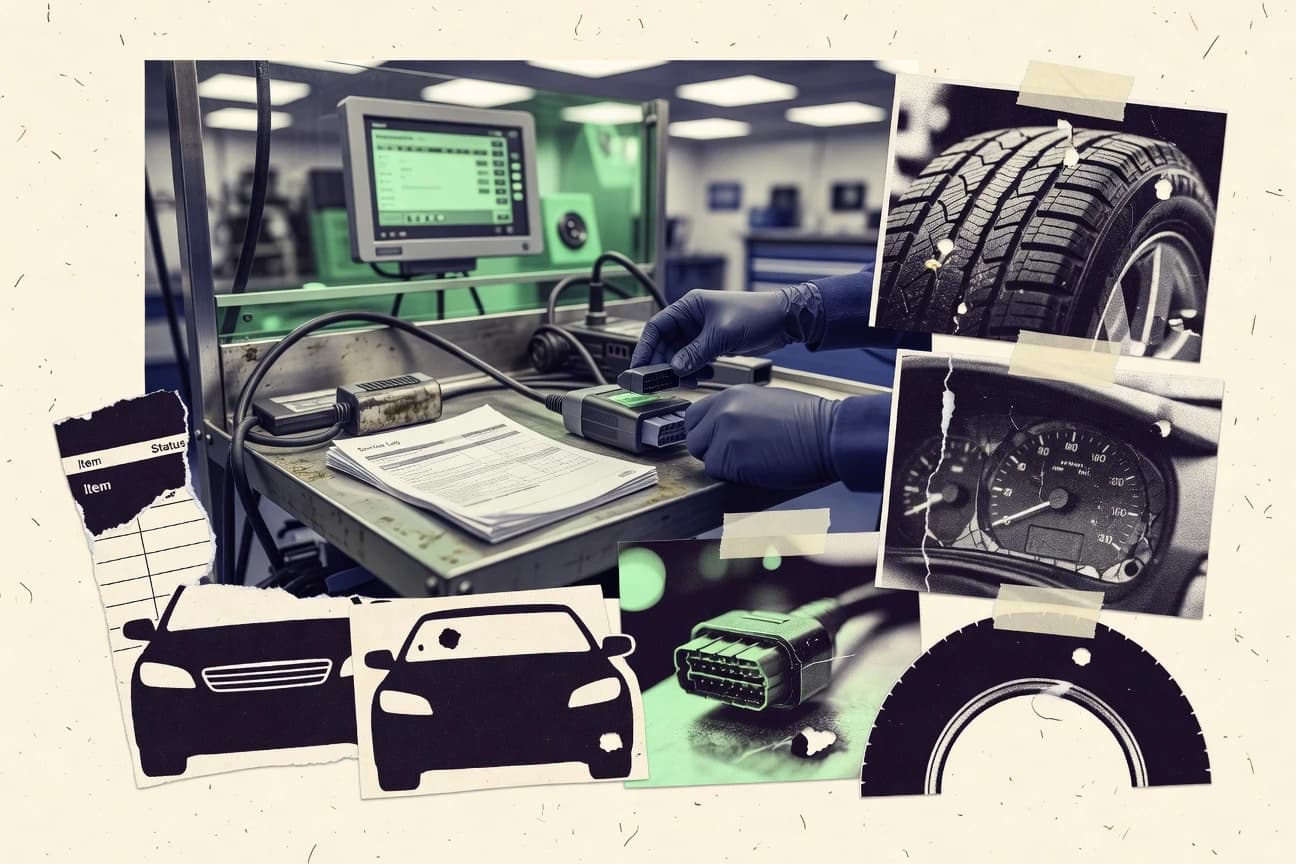
Car Repair Industry Statistics
Even as new tech moves in fast, U.S. car repairs still come with real sticker shock, including an average diagnostic fee of $122 in 2023 and transmission repairs averaging $3,200 with 55% tied to neglect. See why 42% of drivers delayed work over costs averaging $650 per visit and how technician shortages left 76,000 roles unfilled, shaping everything from brake and tire bills to shop labor and EV readiness.

Auto Body Collision Repair Industry Statistics
With 14.2 million U.S. repair orders in 2023 and cycle time averaging 12.4 days, collision repair is moving fast, but complexity is rising where it counts, from structural work on 28% of jobs to ADAS calibrations on 22% of repairs. You will see how hail and total-loss volumes reshape shop capacity, while labor shortages, aluminum and paint hours, and DRP program dominance explain why pricing and parts sourcing keep shifting.
Europe Automotive Industry Statistics
With 185,000 EU fast chargers over 50 kW and 1.4 million all electric vehicles produced, Europe is moving fast while CO2 from new cars still averaged 108.3 g/km in 2023. This page benchmarks the latest EV sales, charging build out, battery and recycling capacity, and automotive jobs and revenue across key countries so you can see where progress is accelerating and where it is lagging.

Ppf Industry Statistics
Get the latest PPF Industry snapshot as the national corpus crossed Rs 1.46 lakh crore by March 2023 and interest and deposits kept accelerating even as new account growth shifted toward specific age and income groups. See how Uttar Pradesh led with 85.2 lakh accounts and how female subscribers now shape nearly half of the subscriber base, while tax saving and payout trends keep turning PPF into a benchmark against other fixed income options.
Diesel Repair Industry Statistics
With U.S. diesel repair revenue hitting $48.7 billion in 2023 and diesel parts markups averaging 42% in independent shops, margins are under real pressure even as diagnostics deliver a 3.2x ROI. This page pairs the cost realities like $2.1 million average annual repair-shop spend and 48% labor cost share with what fleets and regulators are driving, from rising energy costs to emissions compliance trends, so you can plan smarter than the status quo.
Autonomous Vehicle Industry Statistics
Robotaxi operators are already scaling from pilot fleets to real-world mass service, with Waymo hitting 100k rides weekly in Phoenix by 2024 and Baidu Apollo Go reaching 7 million robotaxi rides in China by Q3 2024, while regulators and safety metrics keep rewriting what “ready” means. This page stitches together the most current deployment, funding, and safety signals, from Level 4 licensing momentum in Europe to incident rates and AV hardware performance that are starting to separate winners from noise.

Global Auto Industry Statistics
Electric mobility momentum is reshaping the auto industry, with global public fast charger stock up 40% to 400,000 in 2022 and EV battery production capacity reaching 1,200 GWh. Track how EV sales surged 55% YoY to 10.2 million worldwide and how the same year also saw 14 million people employed directly by the sector and Scope 1 and 2 emissions totaling 1.2 GtCO2e.
Aftermarket Automotive Industry Statistics
Consumers are changing how they service, buy, and even install aftermarket parts, from 77% of European decisions shaped by online research to women making up 42% of US aftermarket parts buyers and loyalty slipping to 48% as price pulls the market. Track the momentum behind a $468.91 billion global aftermarket in 2023, projected to reach $682.71 billion by 2032, alongside demand drivers like 68% of millennials keeping vehicles longer and eco friendly parts rising to 61% of global priorities.