GITNUX MARKETDATA
Browse Our Category
Automotive Services
Latest update:

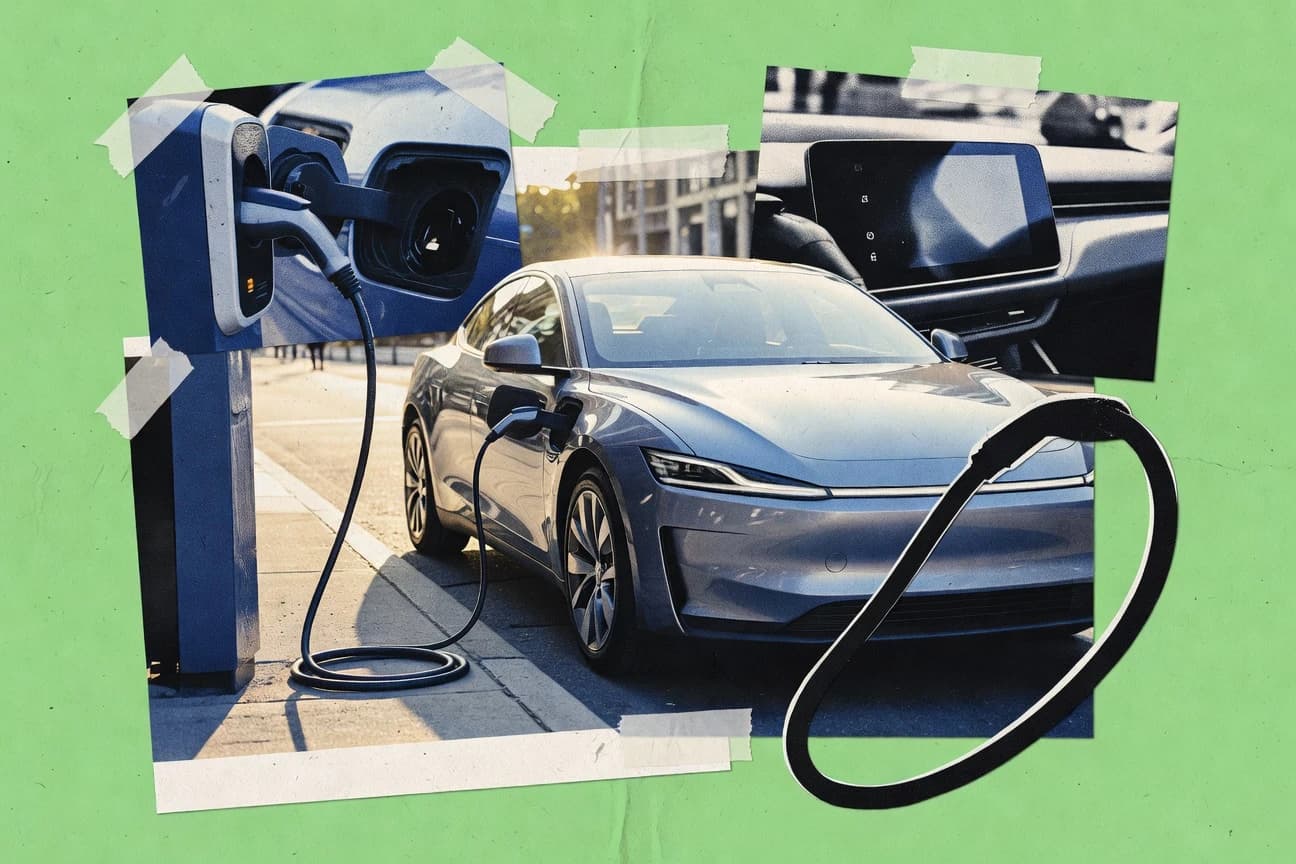
Electric Cars Statistics
Charging costs, efficiency, and emissions are moving targets, and the gap between expectations and reality is as big as the EV boom itself with 4.1 million public fast charging connectors worldwide and charging efficiency typically 85% to 95% wall to battery. See how electrification is reshaping power demand and climate impact, from the 14.4 million BEV and plug in hybrid sales tied to the grid’s decarbonization to lifecycle emissions that are often 50% to 70% lower than gasoline.
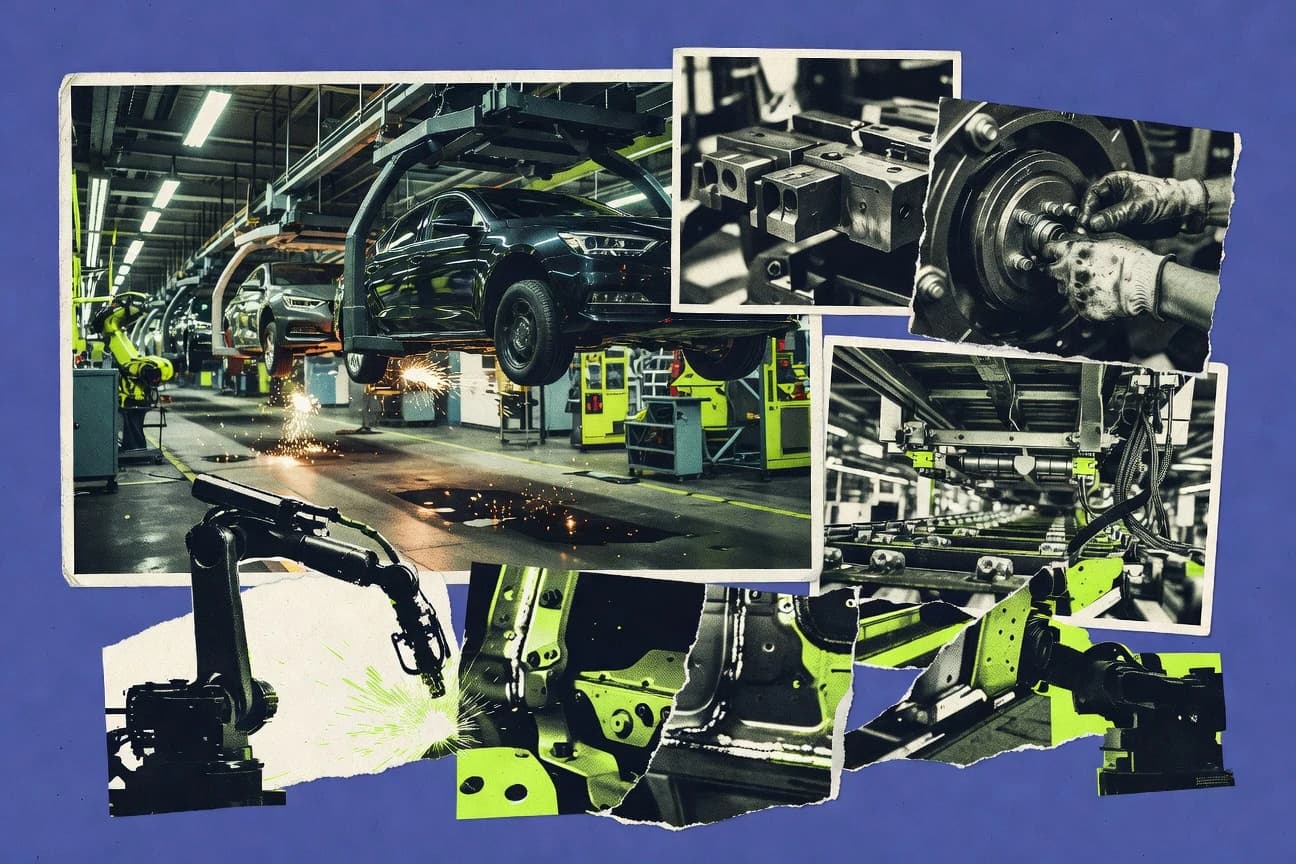
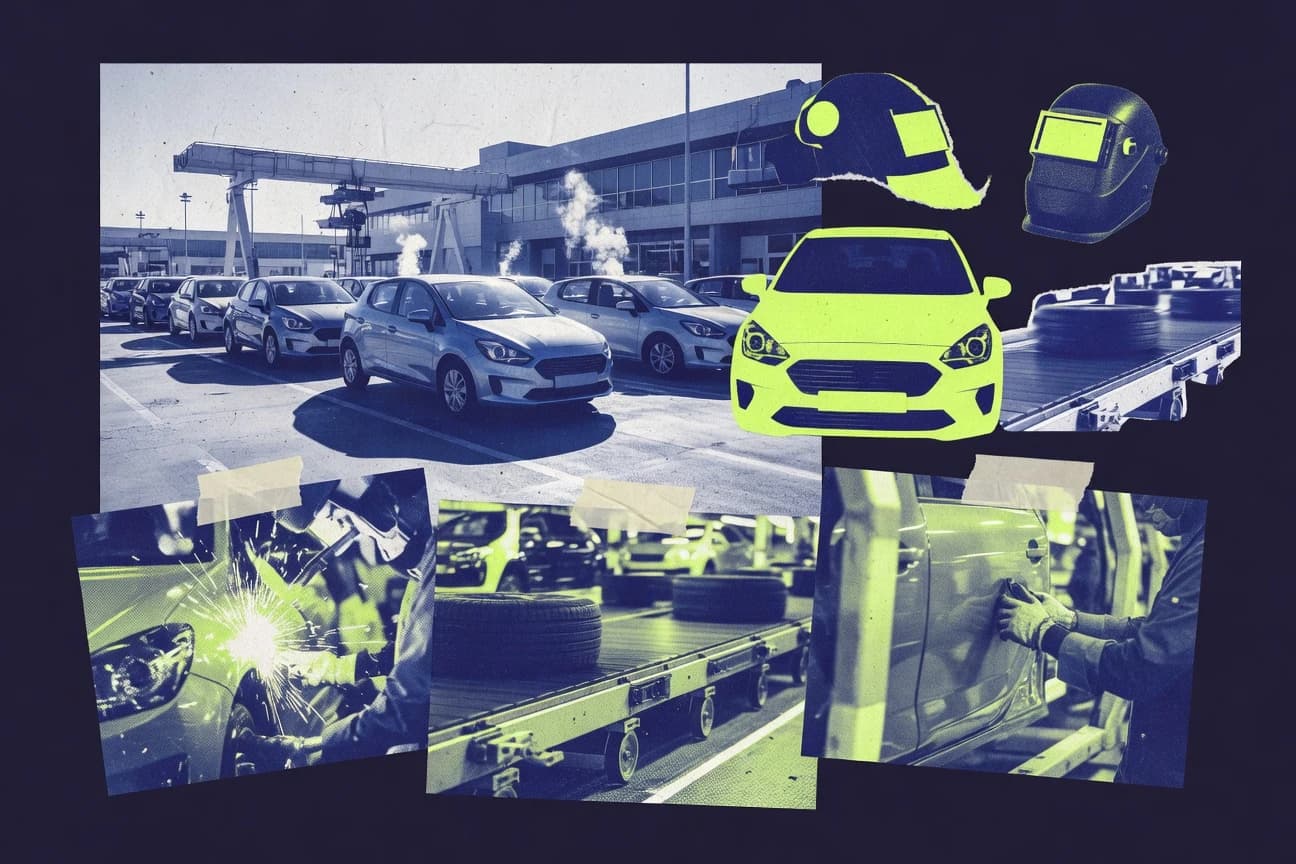
Germany Car Industry Statistics
Germany’s car industry is entering 2025 with a clear picture of what demand, production, and sales are doing right now, including the latest shifts across key markets. Get the sharp contrasts behind the headlines so you can understand why the road ahead looks different from what the latest monthly totals suggest.
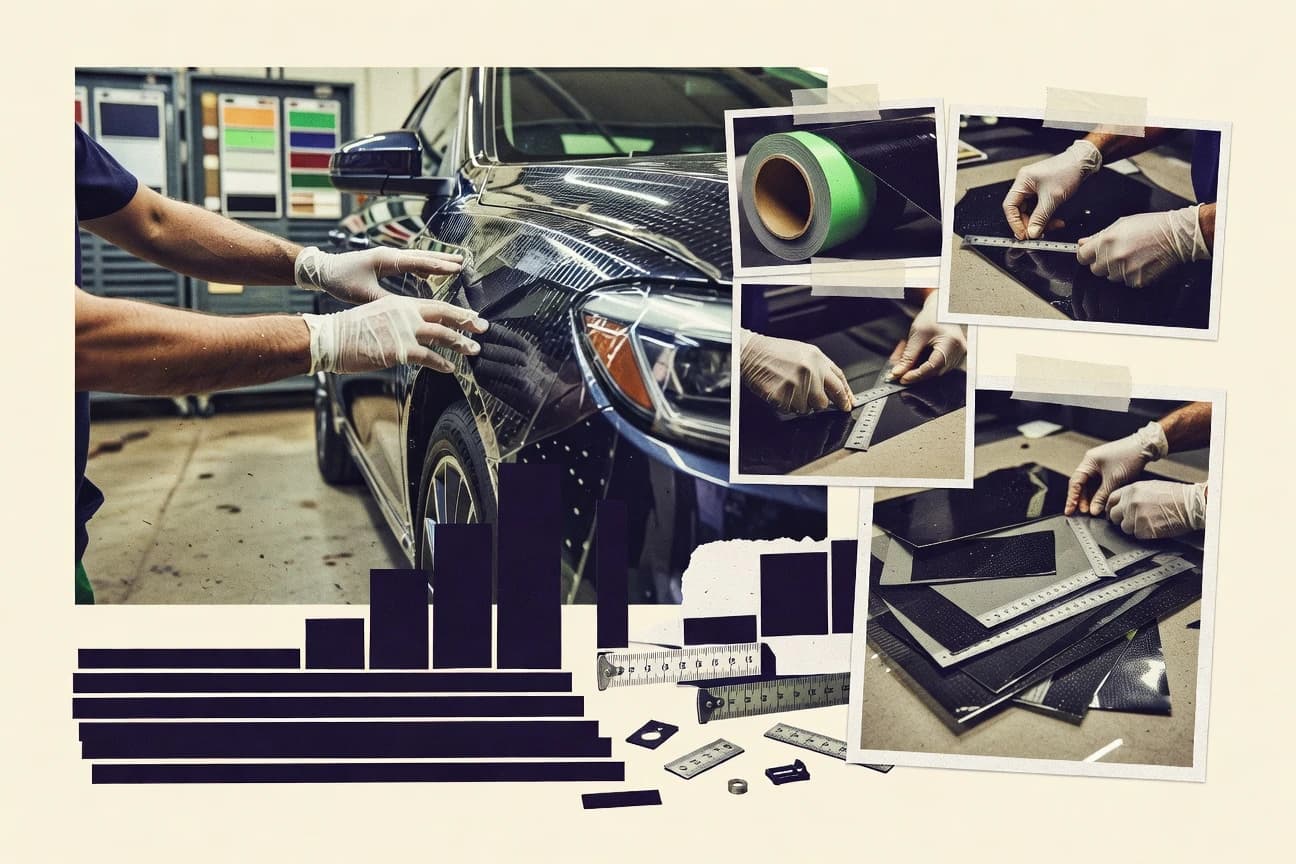
Ppf Film Industry Statistics
See how Ppf Film Industry totals are shifting, with the latest 2025 or 2026 figures putting last year’s assumptions under pressure. This page distills what those numbers mean for demand, production decisions, and where the market is most likely to move next.

France Auto Industry Statistics
From EV surges to shifting production and sales trends, France Auto Industry’s latest statistics lay out how quickly the market is changing heading into 2025 and beyond. You will see where demand is strengthening and where it is slipping, with the kind of near term contrast that makes next year feel less predictable.
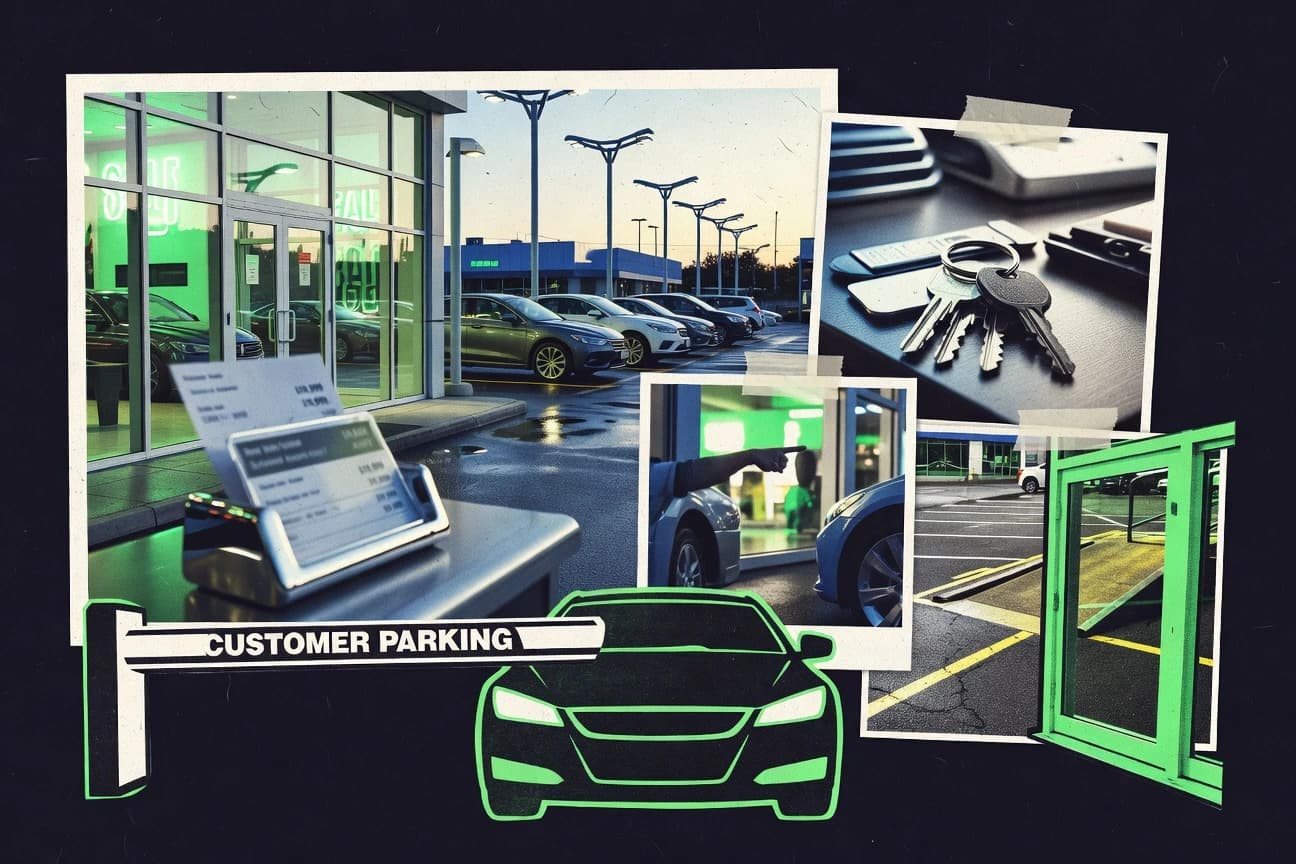
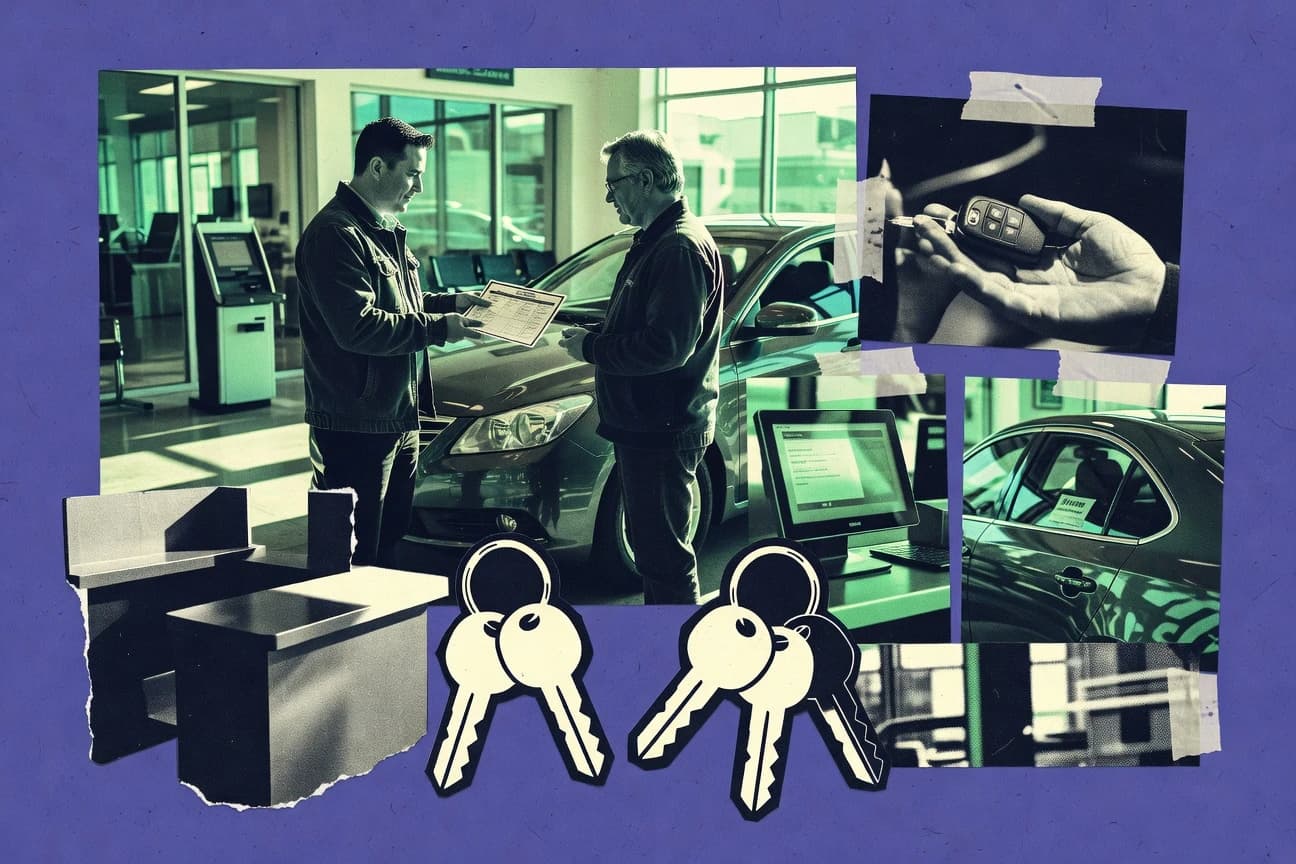
Car Dealership Industry Statistics
Track how 2026 pricing and sales momentum are reshaping car buying at the dealership level, where foot traffic can swing faster than shoppers’ expectations. This page puts the most telling Car Dealership Industry statistics side by side so you can see what changed, what stayed stubbornly the same, and where the next deal will form.
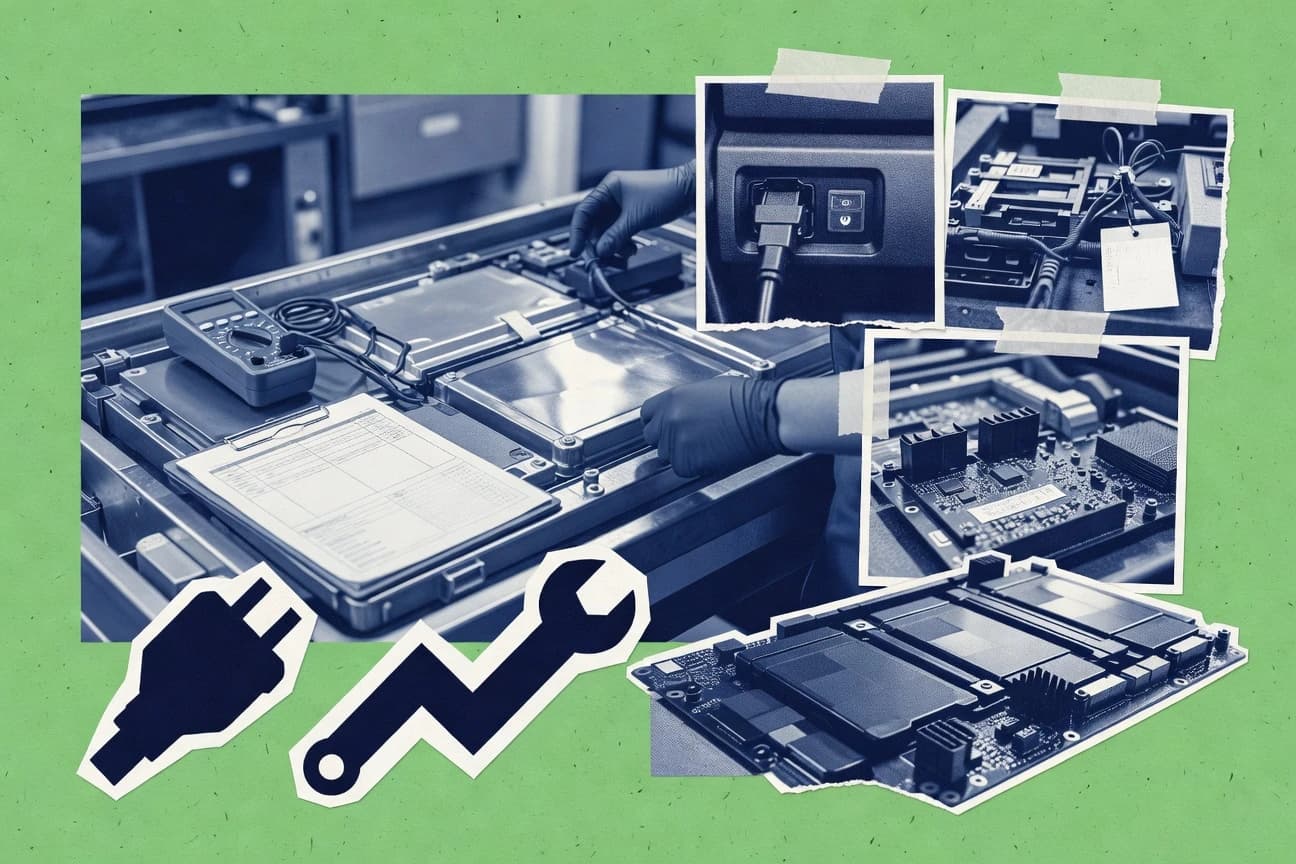
Automotive Ev Industry Statistics
Track how Automotive EV Industry momentum is reshaping what buyers expect and what automakers can deliver, with the latest production, sales, charging, and investment numbers pushing the pace. The contrast between rapid adoption and the infrastructure and supply constraints behind it makes the 2025 and 2026 figures impossible to ignore.
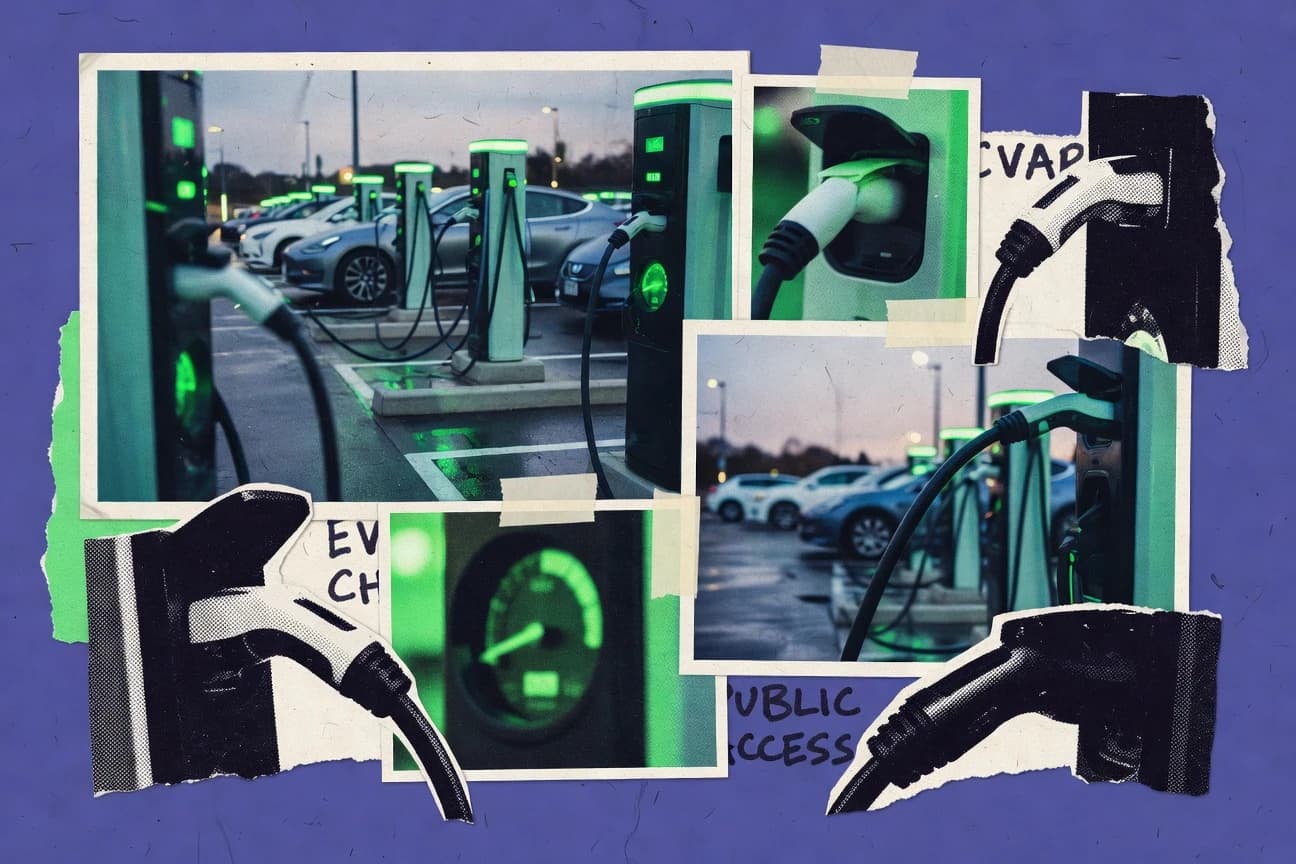
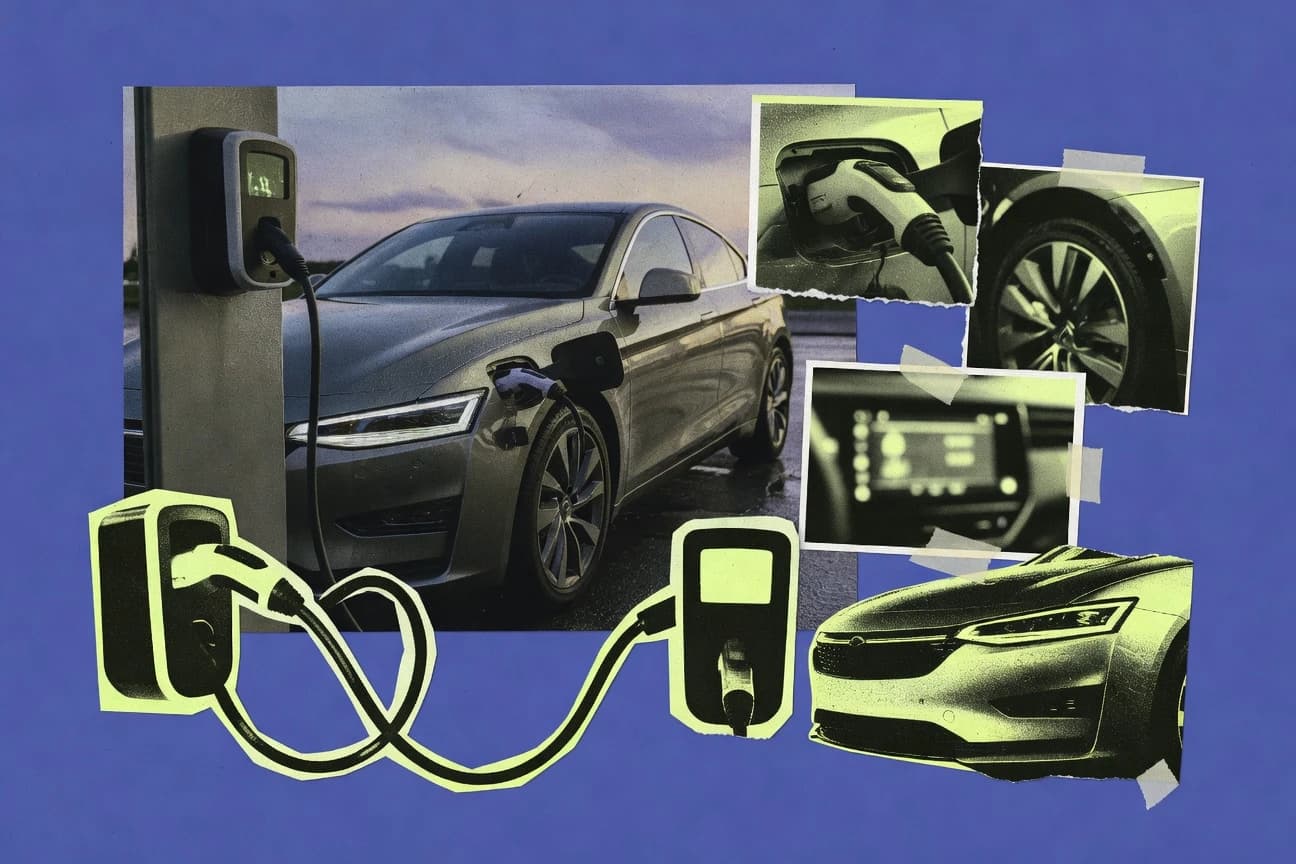
Electric Vehicle Charging Industry Statistics
See how 2026 projections reshape what “fast charging growth” really means, including the sharp swing between installed chargers and actual demand. This page pairs the latest Electric Vehicle Charging Industry figures with the practical gaps drivers feel on the road.
Italy Auto Industry Statistics
Italy’s auto industry is showing a clear change in momentum and you can see it in the latest production, sales, and export figures, with 2026 data included where available. Read the page to understand whether demand is truly shifting or just being carried by the strongest segments.

Express Car Wash Industry Statistics
From a $15.8 billion global car wash market estimate in 2023 to North America express revenue forecasted to keep climbing with double digit growth through 2030, this page puts the expansion pressure and pricing reality side by side, including the $40 to $80 typical U.S. ticket. You will also see what it really takes to scale faster in lanes, with 2 to 3 minute cycles and filtration and runoff rules pushing operators toward touchless systems and water reuse rates of 70 to 90 percent.
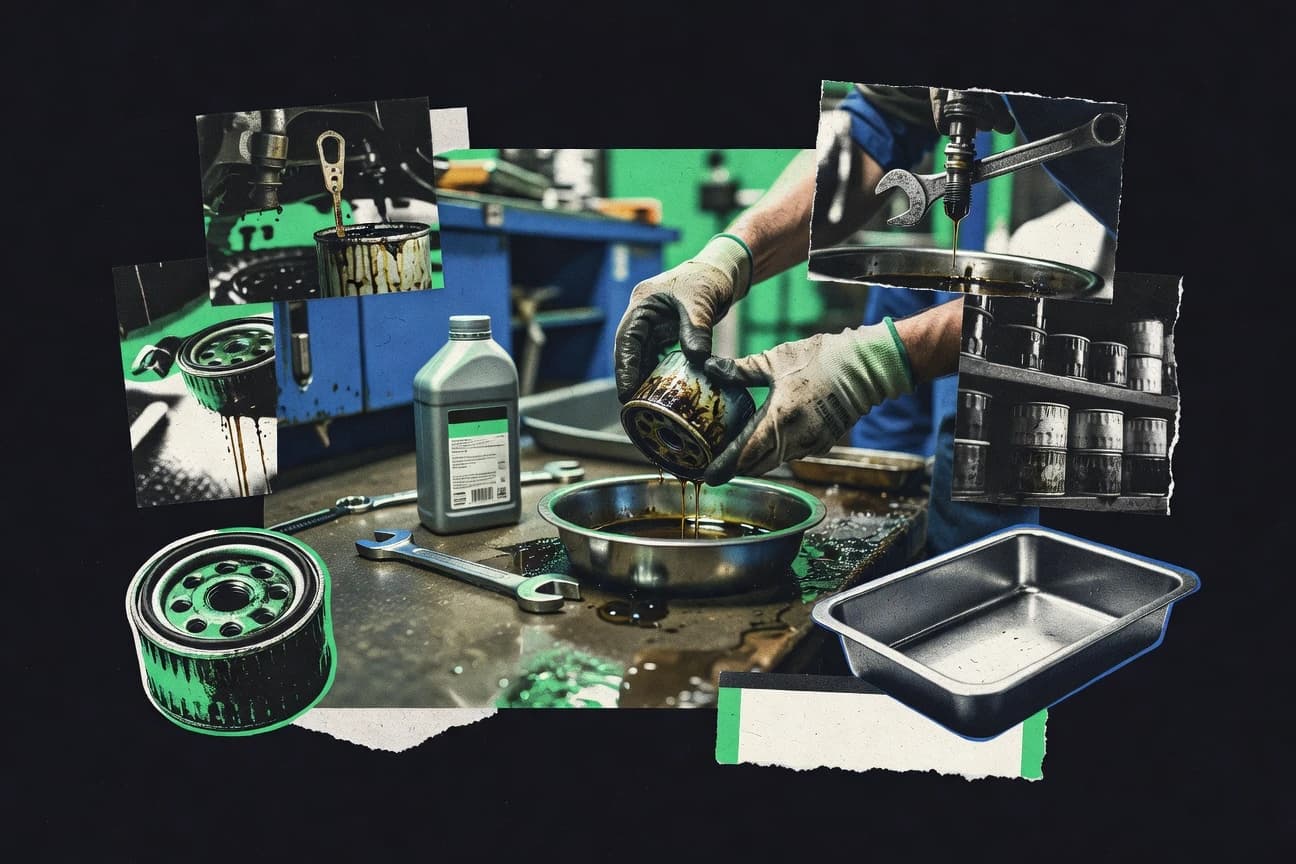
Oil Change Industry Statistics
With motor vehicle and parts dealers retail services pulling $1.6T in U.S. sales, oil change demand is being shaped by rising costs and customer expectations at the same time, from $80.1 WTI in 2024 to wait time wins that can raise purchase likelihood by 4.6x. This page connects the $415.3B U.S. spend on vehicle maintenance and repair with the real operational pressures of labor, regulation under 40 CFR Part 279, and the growing influence of online reviews and manufacturer branded locations.
Auto Dealer Industry Statistics
Dealers are working with a massive $1.6 trillion U.S. new vehicle retail market and $2.1 trillion in used sales, while the online shift is already measurable with 22% of retail transactions happening digitally and 57% of shoppers expecting a true digital retail experience. From 90% of dealers using Google Business Profiles to used vehicle inventory stretching to 44 days and auto loan credit losses holding at 0.62% in Q4 2023, these statistics explain exactly where dealership revenue is headed next and what could disrupt it.
Greater China Automotive Industry Statistics
China’s EV charging backbone keeps scaling, reaching 8.0 million total public outlets in 2023 with 60% of global public chargers, while China also drove 5.64 million electric passenger car sales. The page connects that demand with the hard supply constraints and breakthroughs behind it, from LFP at 53% of new battery installs and 57% of global cell capacity to newer cybersecurity and crash safety rule alignment that can make or break connected-vehicle rollouts.
Alabama Auto Industry Statistics
Alabama’s auto industry output and hiring are moving fast, with 2026 numbers showing how quickly the state is reshaping its manufacturing footprint. Compare the latest figures to recent trends to see where the growth is accelerating and where the demand shifts are forcing new decisions on the factory floor.
Vehicle Ownership Statistics
By 2023, 14.7 million battery electric vehicles were on the road and the Netherlands had 2,300 public charge points per million people, yet car ownership still shapes commuting and household costs across countries. Compare how global passenger car stock reached 1.48 billion vehicles and ownership turns into use, from 79% US worker commutes by car, truck, or van to 7.8 years average vehicle tenure and rising price pressures.

Czech Automotive Industry Statistics
See how Czech automotive keeps reshaping itself right now, from production volumes and sales shifts in 2026 to the latest employment and investment signals that reveal whether growth is widening or stalling. One set of figures moves opposite to what you might expect, and that contrast is exactly what makes the numbers worth a close look.
Automotive Dealership Customer Retention Statistics
In 2025, retention hinges on much more than repeat visits, with the gap between customers who feel genuinely supported and those who do not widening fast. See which dealership actions are most likely to turn first time service into long term loyalty and how those trends are reshaping your retention targets for the year ahead.
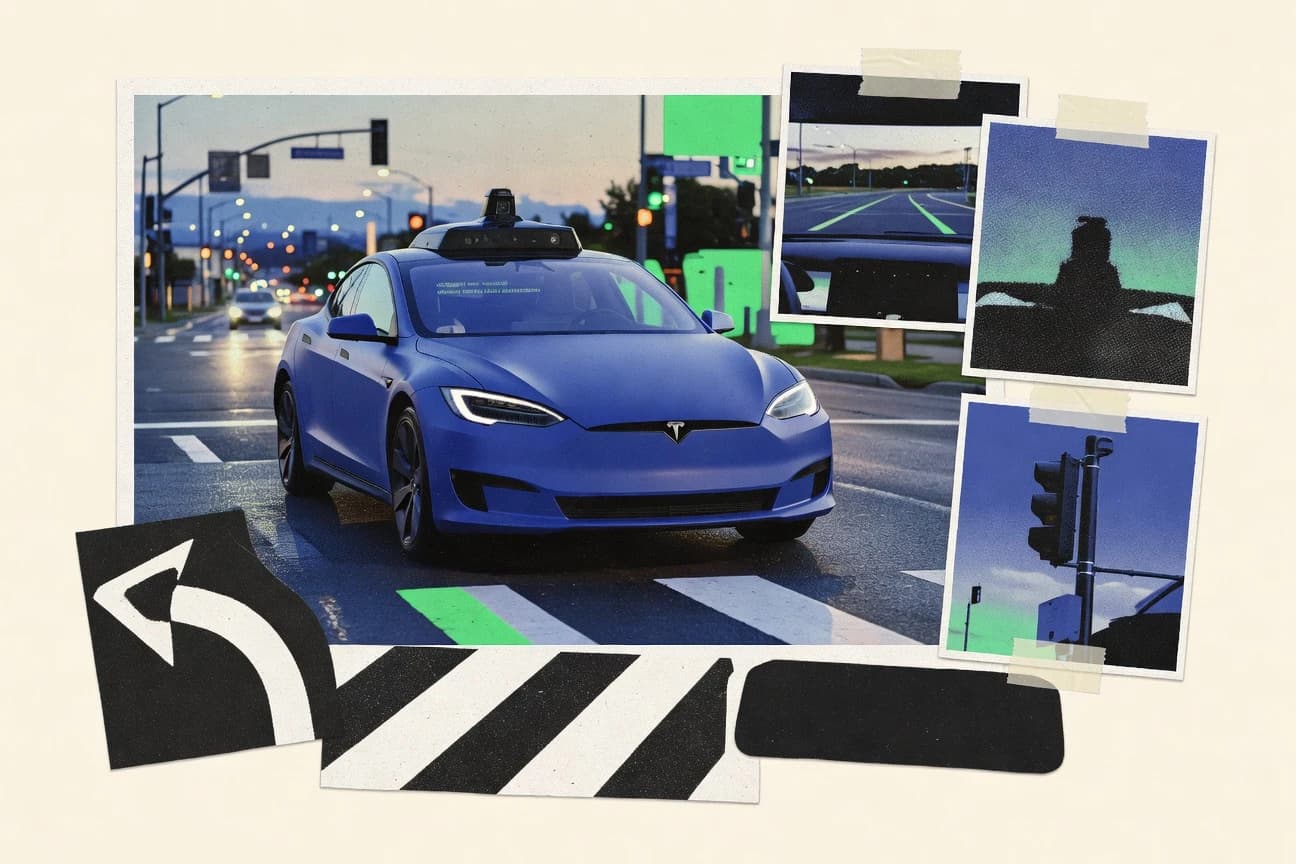
Autonomous Driving Industry Statistics
Autonomous driving momentum is shifting fast, and the latest figures for 2026 spell out why confidence in real world deployments is rising while costs, safety expectations, and regulatory readiness are being tested in the same breath. Read the page to see how the industry’s most important metrics are moving against each other, not in a straight line.
Electric Car Statistics
Battery prices fell to $139 per kWh in 2023 and plug ins became 23% of new car sales globally, even as fast chargers still make up only about 20% of public charging points. Get the key EV signals behind that momentum, from about 18 million electric cars on the roads by end 2023 to the charger build targets, battery tech shifts like LFP at roughly 35% of cells shipped, and the MPGe efficiency ratings that put EVs’ real world performance into perspective.
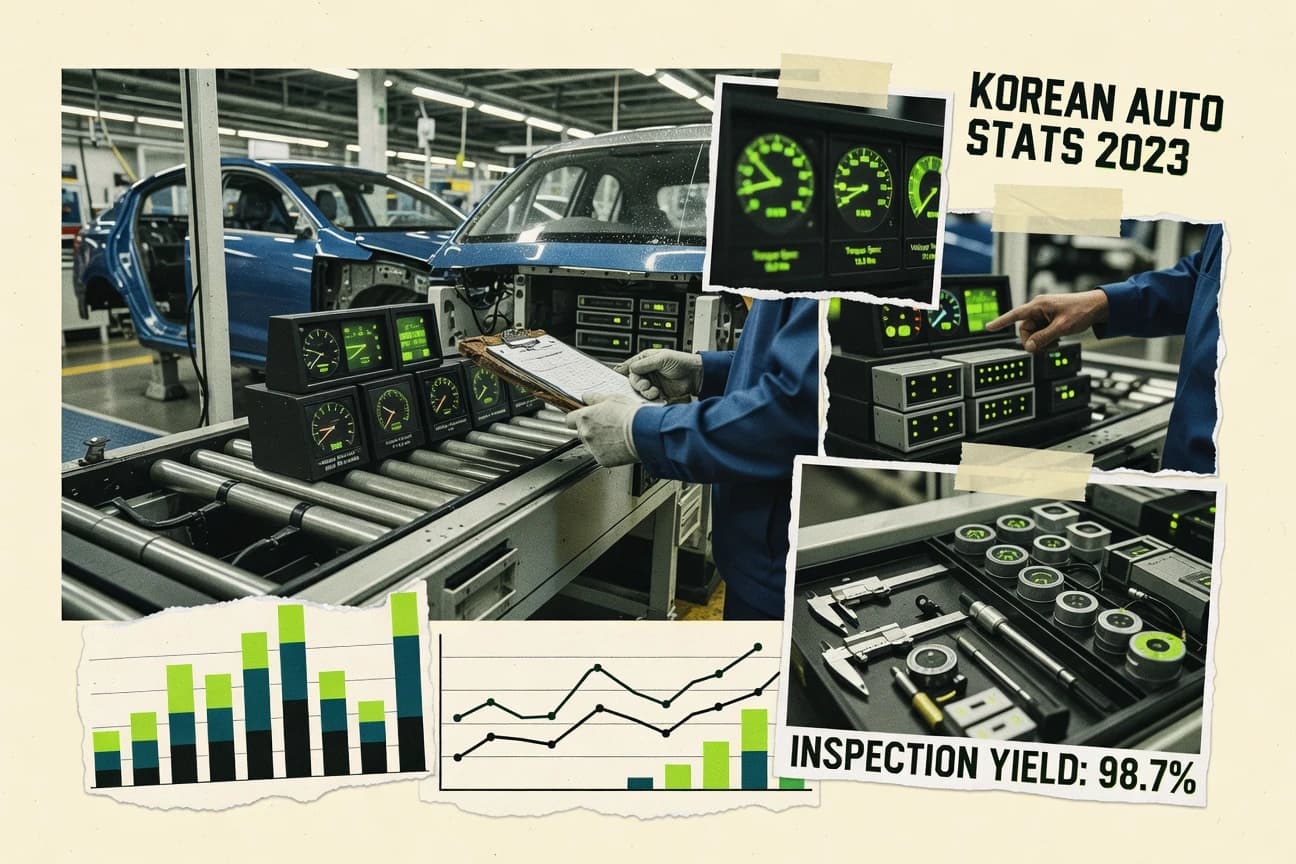
Korean Automotive Industry Statistics
Korean auto industry data in 2025 shows how production, sales, and exports are shifting together rather than moving in step, with each KPI tugging in a different direction. If you want to understand what that imbalance means for 2026 cost pressures and demand planning, this statistics page gives you the quickest way to see the gap.
Japan Automotive Industry Statistics
See how Japan’s auto industry is reshaping demand and production using the latest 2026 snapshot, including key shifts in sales, vehicle registrations, manufacturing output, and EV momentum. The contrast between what’s rolling off Japanese lines now and what drivers are choosing is exactly where the real pressure points and opportunities show up.