
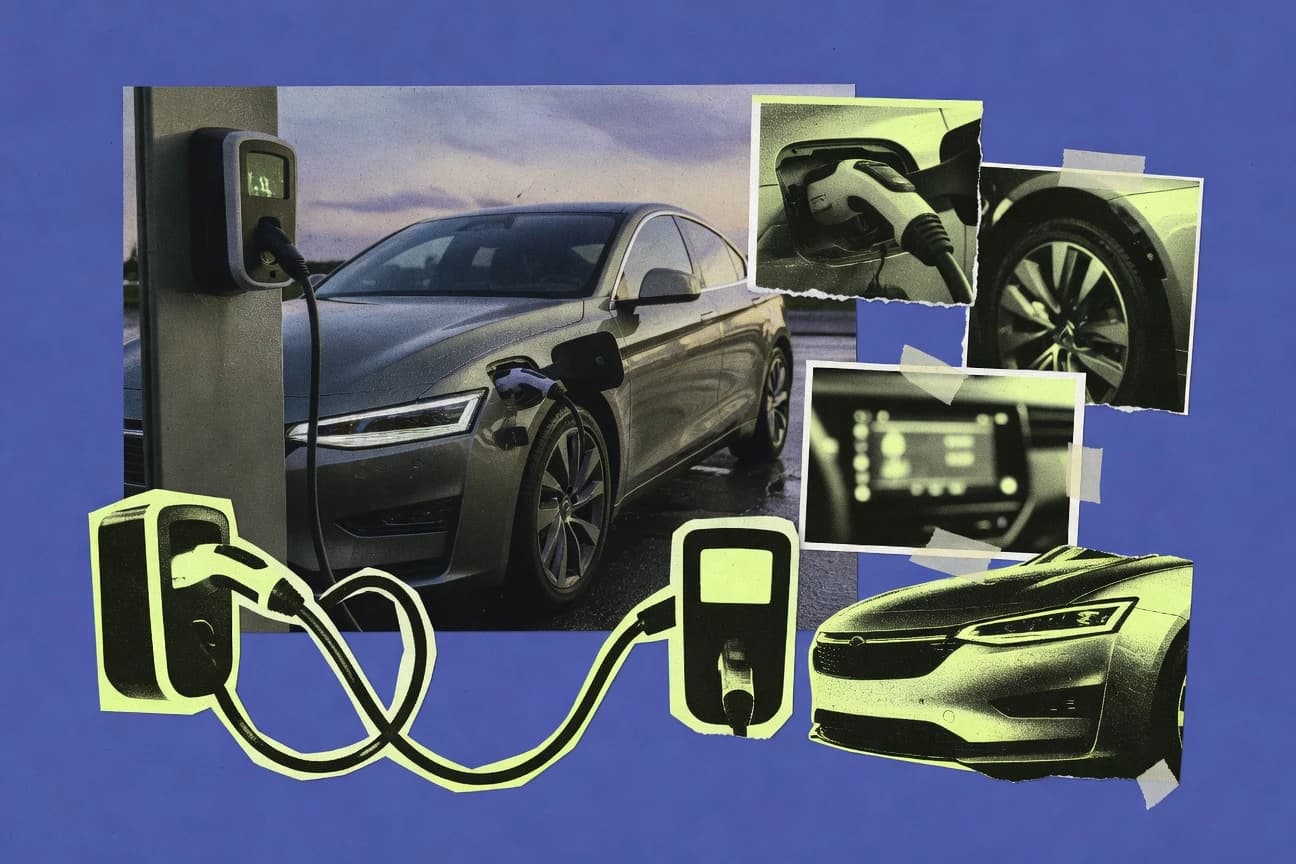

Electric car adoption is spreading globally, but the scale is very different by region. By end-2022, about 14 million electric cars were on the world’s roads, rising to roughly 18 million by end-2023. The page also connects growth to charging availability and policy—like AFIR targets for public points and California’s ZEV mandate—while explaining how efficiency and battery demand shape future supply.
Key Takeaways
- China accounted for 60% of global electric car sales in 2022 (IEA share estimate)
- 14 million electric cars were on the world’s roads by end-2022
- Approximately 18 million electric cars were on the world’s roads by end-2023 (IEA estimate)
- US share: plug-in electric vehicles were about 7% of new vehicle sales in 2023 (IEA/US market estimates)
- In the Netherlands, electric cars were 25% of new car sales in 2022 (RVO / Dutch government-linked statistics reported by CBS/industry releases)
- In the UK, electric cars accounted for 16.5% of new car registrations in 2023 (SMMT)
- Battery pack prices dropped from $1,100 per kWh in 2010 to $139 per kWh in 2023 (BloombergNEF)
- Tesla Model 3 Long Range (per EPA) has an estimated 123 MPGe and a combined energy consumption rate of 24 kWh/100 miles
- US DOE notes that electric motors convert about 77% of energy to motion, compared with about 12% to 30% for ICE vehicles
- Tesla Model Y Long Range (EPA) is rated at 121 MPGe combined
- IEA estimates that fast chargers make up about 20% of public chargers globally (IEA)
- BloombergNEF forecasts that battery demand will grow substantially, reaching about 4,900 GWh by 2030 (BNEF Electric Vehicle Outlook)
- In the EU, the Alternative Fuels Infrastructure Regulation requires deployment of public charging points and provides targets for Member States (AFIR adopted targets)
- 21% of European Union public chargers were DC fast chargers in 2023 (share of public charging outlets by power tier).
- EU member states planned the deployment of 3.2 million public charging points by 2030 under the Alternative Fuels Infrastructure Regulation (AFIR) framework.
By end-2023, about 18 million electric cars drove fast growth as sales shares and charging networks expanded worldwide.
Related reading
01 · Category
Performance Metrics6 stats
01
Tesla Model 3 Long Range (per EPA) has an estimated 123 MPGe and a combined energy consumption rate of 24 kWh/100 miles
02
US DOE notes that electric motors convert about 77% of energy to motion, compared with about 12% to 30% for ICE vehicles
03
Tesla Model Y Long Range (EPA) is rated at 121 MPGe combined
04
Hyundai Ioniq 5 (EPA) is rated at 111 MPGe combined for the AWD model
05
Thermal management and battery longevity: NHTSA reports that electric vehicle battery issues represented a small fraction of vehicle recalls and safety complaints relative to scale (NHTSA recall data)
06
CO2 lifecycle impact: The IPCC AR6 reports that lifecycle greenhouse gas emissions from EVs are typically lower than those from ICE cars, with variation mainly driven by electricity generation (IPCC)
Interpretation
Performance Metrics Interpretation
Within performance metrics, today’s electric vehicles deliver high efficiency with EPA ratings around 111 to 123 MPGe and energy use near 24 kWh per 100 miles for top models, supported by electric motors converting about 77 percent of energy to motion compared with roughly 12 to 30 percent for ICE cars.
02 · Category
Market Size11 stats
01
China accounted for 60% of global electric car sales in 2022 (IEA share estimate)
02
14 million electric cars were on the world’s roads by end-2022
03
Approximately 18 million electric cars were on the world’s roads by end-2023 (IEA estimate)
04
6.6% of new car sales were electric globally in 2021
05
3.1 million electric cars were sold in the EU in 2023, reaching a 25% share of passenger car sales (IEA-reported EU figures)
06
14,000,000 electric cars (BEV+PHEV) on the world's roads in 2022
07
18,000,000 electric cars (BEV+PHEV) on the world's roads in 2023
08
26,000,000 electric cars (BEV+PHEV) on the world's roads in 2024
09
38,000,000 electric cars (BEV+PHEV) on the world's roads in 2025
10
59,000,000 electric cars (BEV+PHEV) on the world's roads in 2026
11
85,000,000 electric cars (BEV+PHEV) on the world's roads in 2027
Interpretation
Market Size Interpretation
By the end of 2023, about 18 million electric cars were already on the world’s roads and China alone made up 60% of global electric car sales in 2022, showing that market size is accelerating but highly concentrated.
report visual · Projection
Global EV fleet (BEV+PHEV) is accelerating
The world EV fleet (BEV+PHEV) grows year over year, with 2027 leading the series and a clear upward trajectory from 2022 to 2027.
14,000,000 electric cars (BEV+PHEV) on world roads
Start
+43.44%
CAGR · 5y
85,011,840 electric cars (BEV+PHEV) on world roads
Projected
20222027
source-verifiediea.org2027
03 · Category
User Adoption5 stats
01
US share: plug-in electric vehicles were about 7% of new vehicle sales in 2023 (IEA/US market estimates)
02
In the Netherlands, electric cars were 25% of new car sales in 2022 (RVO / Dutch government-linked statistics reported by CBS/industry releases)
03
In the UK, electric cars accounted for 16.5% of new car registrations in 2023 (SMMT)
04
In Germany, electric cars accounted for about 25% of new registrations in 2023 (KBA)
05
In a 2024 IEA consumer survey, 70% of respondents reported that they consider charging availability and convenience when deciding to buy an EV (IEA consumer insights)
Interpretation
User Adoption Interpretation
User adoption of electric cars is accelerating, with EVs reaching roughly 25% of new sales or registrations in major markets like the Netherlands and Germany in 2022 to 2023, while a 2024 IEA survey shows 70% of consumers factor charging availability and convenience into their purchase decisions.
More related reading
04 · Category
Industry Trends5 stats
01
IEA estimates that fast chargers make up about 20% of public chargers globally (IEA)
02
BloombergNEF forecasts that battery demand will grow substantially, reaching about 4,900 GWh by 2030 (BNEF Electric Vehicle Outlook)
03
In the EU, the Alternative Fuels Infrastructure Regulation requires deployment of public charging points and provides targets for Member States (AFIR adopted targets)
04
California’s ZEV program requires increasing ZEV sales; CARB reports that 100% of new passenger car sales will need to be ZEVs by 2035 (CARB)
05
Battery chemistry: LFP accounted for a major share of global battery manufacturing in 2023, reaching about 35% of global cells shipped (BNEF)
Interpretation
Industry Trends Interpretation
Industry trends show that the electric-vehicle ecosystem is scaling fast, with fast chargers already making up about 20% of public chargers globally and battery demand forecast to climb to roughly 4,900 GWh by 2030, alongside strong policy pressure like California targeting 100% of new passenger car sales as ZEVs by 2035.
05 · Category
Supply Chain And Energy5 stats
01
Global demand for lithium for battery manufacturing was about 630,000 metric tons (Li) in 2023, driven primarily by EV batteries (industry supply-demand accounting).
02
Global demand for nickel for batteries reached about 350,000 metric tons (contained nickel) in 2023 (industry accounting for battery-focused demand).
03
Global copper demand is strongly linked to EV growth; battery and motor manufacturing contribute to copper consumption estimated at hundreds of thousands of tonnes per year in recent scenario projections.
04
The levelized cost of electricity from utility-scale solar averaged about $0.04–$0.06 per kWh in 2022 across leading markets in technology cost benchmark analyses (IRENA).
05
By 2030, grid-connected battery storage additions are expected to be in the hundreds of GWh per year range globally, supporting EV charging peaks and renewables integration (IEA forecasts summarized in public commentary).
Interpretation
Supply Chain And Energy Interpretation
In the Supply Chain And Energy category, rising EV-driven materials demand is stark with 2023 lithium use for battery manufacturing hitting about 630,000 metric tons and nickel demand reaching around 350,000 metric tons, while energy systems are scaling too with utility solar electricity averaging $0.04 to $0.06 per kWh in 2022 and battery storage additions expected to reach the hundreds of GWh per year by 2030 to support EV charging.
06 · Category
Industry Overview5 stats
01
21% of European Union public chargers were DC fast chargers in 2023 (share of public charging outlets by power tier).
02
EU member states planned the deployment of 3.2 million public charging points by 2030 under the Alternative Fuels Infrastructure Regulation (AFIR) framework.
03
Battery pack prices dropped from $1,100per kWh in 2010 to $139 per kWh in 2023 (BloombergNEF)
04
23% of global new car sales were plug-in electric vehicles in 2023 (BEV+PHEV combined share of new vehicle sales).
05
$138per kWh was the average reported price point for lithium-ion battery cells in 2023 under BloombergNEF methodology (cell/pack price reporting convention varies by source, but BNEF’s annual estimates commonly cited at this level).
Interpretation
Industry Overview Interpretation
In the industry overview, the rapid cost and infrastructure buildup stands out because battery prices fell to about $139 per kWh in 2023 while plug-in cars reached 23% of global new sales that same year and the EU aims to deploy 3.2 million public chargers by 2030, even as only 21% of outlets are DC fast chargers.
Reference
Cite This Report
This report is designed to be cited. We maintain stable URLs and versioned verification dates. Copy the format appropriate for your publication below.
APA
Priya Chandrasekaran. (2026, February 13). Electric Car Statistics. Gitnux. https://gitnux.org/electric-car-statistics
MLA
Priya Chandrasekaran. "Electric Car Statistics." Gitnux, 13 Feb 2026, https://gitnux.org/electric-car-statistics.
Chicago
Priya Chandrasekaran. 2026. "Electric Car Statistics." Gitnux. https://gitnux.org/electric-car-statistics.
Sources & references
34 datasets cited across this report · attribution is report-level
+19 additional datasets cited (not shown individually)