Business Advisory on
Software & Markets
Custom market research, verified industry reports, and expert software & service advisory. Every statistic and recommendation has been independently verified before it reaches you.
- 6,000+
- Verified statistics
- 1,000+
- Reports
- 850+
- Sources
- Daily
- Updated
Cited by hundreds of publications
Featured data
Evidence from our latest market research
Cosmetics market growth toward 2030
Dark Mode adoption is rising across platforms and time
Upskilling & Reskilling Drives Measurable Outcomes in Makeup Careers
AI adoption and market scale in investment industry
Tailored market research & advisory
From custom research to comprehensive industry reports and expert software selection guidance — get the insights you need to drive strategic decisions.
Custom Market Research
Tailored research solutions designed around your specific business questions. Our expert analysts deliver actionable insights within 2–6 weeks.
- Market Sizing & Forecasting
- Competitor Analysis
- Customer Segmentation
- Market Entry Strategy
Software Advisory
Find the right software for your business. Our analysts evaluate vendors using AI-verified best lists, market data, and hands-on testing to deliver a clear recommendation.
- Needs Assessment & Scoping
- Vendor Shortlisting via Best Lists
- Feature-by-Feature Comparison
- Final Recommendation & Roadmap
Buy Industry Reports
Access comprehensive pre-made industry reports with instant download. Professional market intelligence at your fingertips.
- Instant Download
- 50+ Industries Covered
- 5-Year Forecasts
- Competitive Analysis
Tool comparisons & reviews
Independently verified best lists and product comparisons.

Top 10 Best Computational Fluid Dynamics Software of 2026
Written by Alexander Schmidt·Fact-checked by Nicholas Chambers
Ranking of the top 10 computational fluid dynamics software options with feature comparisons for CFD teams using tools like CONVERGE, Fluent.

Top 10 Best Amazon Keyword Software of 2026
Written by Julian Richter·Edited by Felix Zimmermann·Fact-checked by Peter Sandoval
Ranked roundup of the top 10 amazon keyword software tools, comparing SellerSprite, MerchantWords, and SmartScout for Amazon listing research.

Top 10 Best Bim Data Management Software of 2026
Written by David Kowalski·Edited by Astrid Bergmann·Fact-checked by Peter Sandoval
Top 10 ranking of bim data management software options for BIM teams, with feature comparisons and tradeoffs. Includes Revizto, Asite, BIMData.

Top 10 Best Event Rental Inventory Management Software of 2026
Written by Felix Zimmermann·Edited by Marcus Afolabi·Fact-checked by Maya Johansson
Top 10 ranking of event rental inventory management software, comparing Curate, Goodshuffle Pro, TapGoods by features and fit for teams.

Top 10 Best Business Financial Software of 2026
Written by Margot Villeneuve·Edited by Stefan Wendt·Fact-checked by Rebecca Hargrove
Ranked roundup of top business financial software options with feature and pricing comparisons for finance teams, plus Odoo, QuickBooks Online, NetSuite.

Top 10 Best Lead Routing Software of 2026
Written by Elif Demirci·Edited by Katherine Brennan·Fact-checked by Astrid Bergmann
Top 10 lead routing software ranking with criteria and tradeoffs for sales teams, covering Openprise, Default, and LeanData comparisons.

Top 10 Best Construction Programme Software of 2026
Written by Kevin O'Brien·Edited by David Kowalski·Fact-checked by Peter Sandoval
Rank and compare top construction programme software with clear criteria, including nPlan, Oracle Primavera Cloud, and Procore.

Top 10 Best Cloud Based Lending Software of 2026
Written by Elena Vasquez·Edited by Kevin O'Brien·Fact-checked by Abigail Foster
Ranked roundup of cloud based lending software for teams comparing MeridianLink Consumer Lending, Abrigo Lending, and Temenos Lending features and tradeoffs.
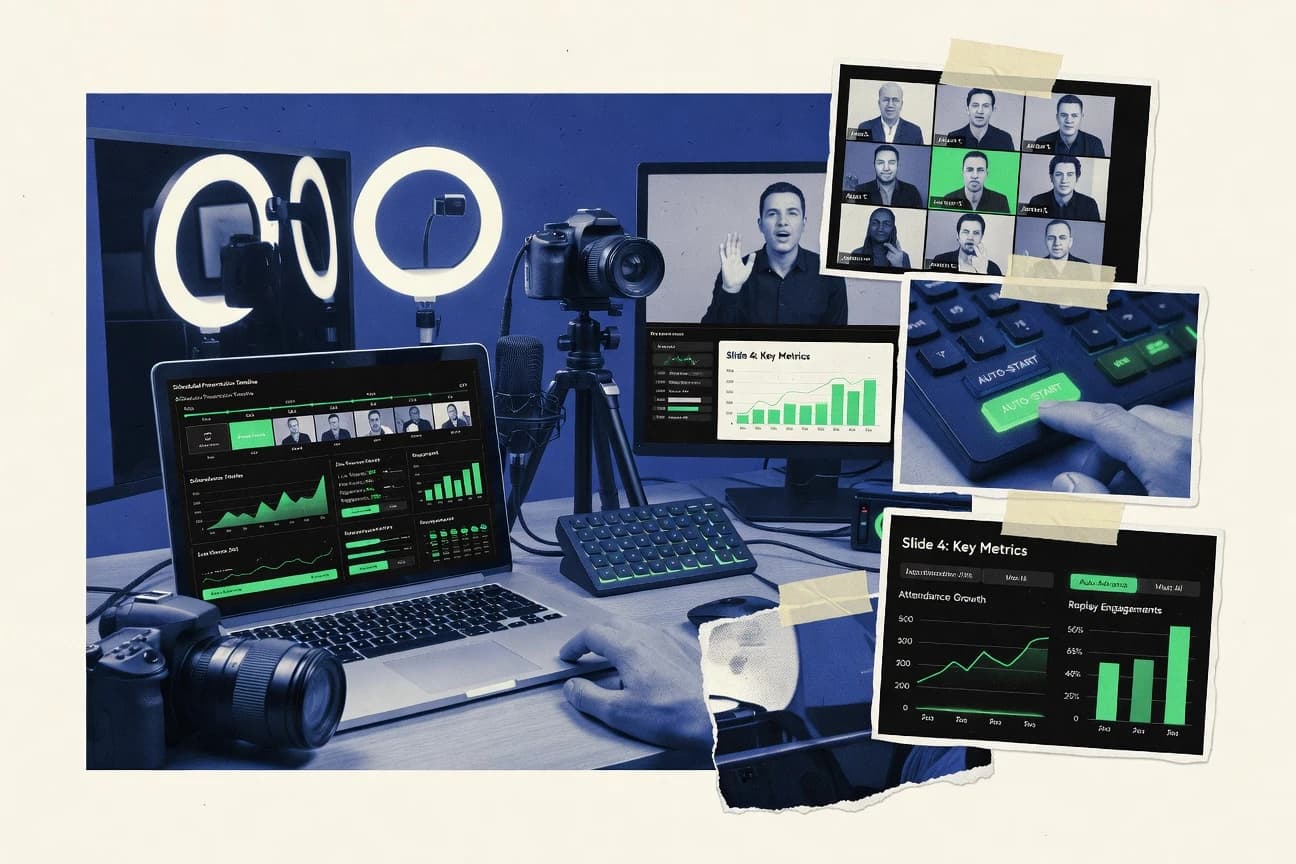
Top 10 Best Automated Webinar Software of 2026
Written by Lars Eriksen·Edited by Margot Villeneuve·Fact-checked by Peter Sandoval
Ranked list of the top 10 automated webinar software for online events, with a comparison of key features and tradeoffs for teams.

Top 10 Best Mobile Field Reporting Software of 2026
Written by Gabrielle Fontaine·Edited by Alexander Schmidt·Fact-checked by Rajesh Patel
Ranked roundup of mobile field reporting software for field teams. Compares tools like GoCanvas, Form.com, and Dashpivot by features and tradeoffs.

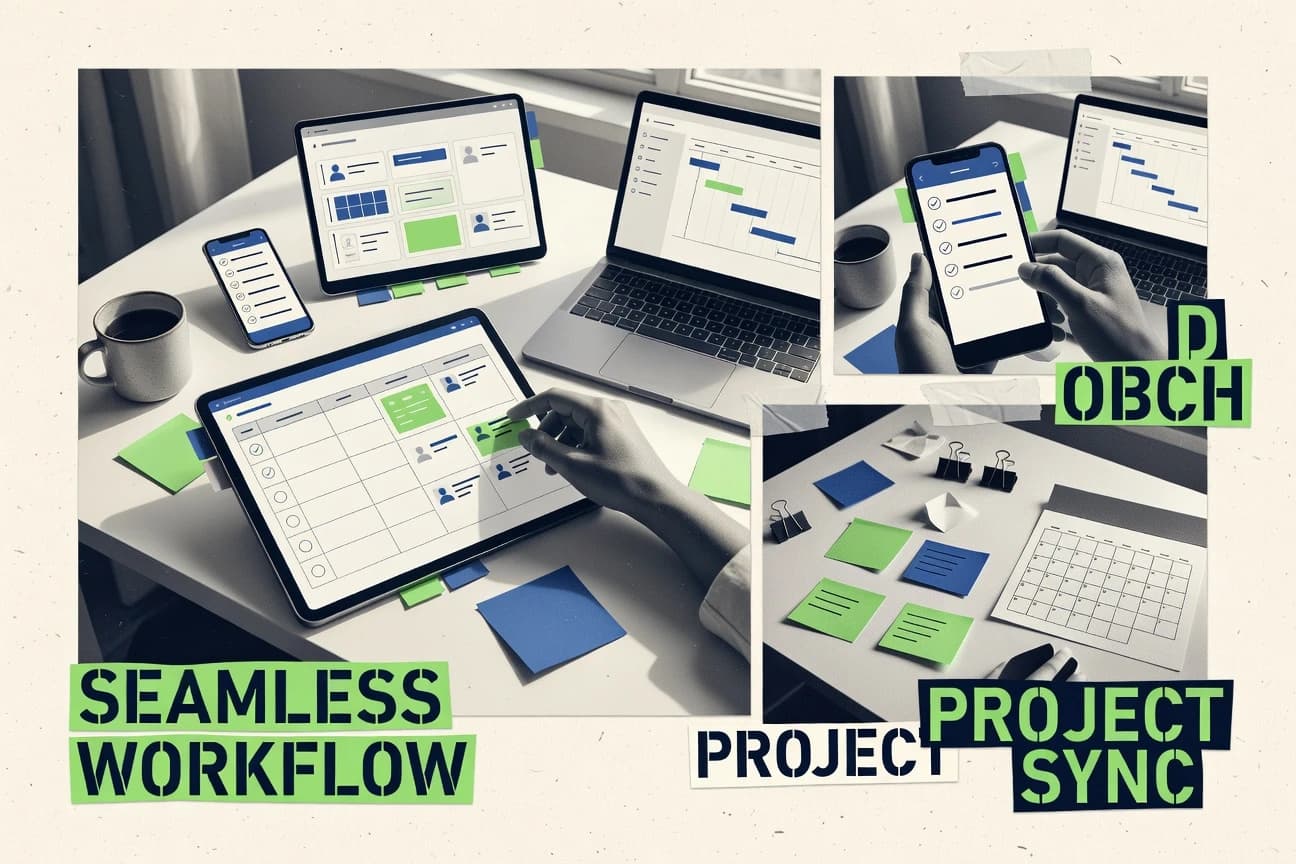
Top 10 Best Project Management And Invoicing Software of 2026
Written by David Sutherland·Edited by Gabrielle Fontaine·Fact-checked by Claire Beaumont
Ranked roundup of project management and invoicing software, comparing Avaza, Paymo, and Zoho One for teams evaluating features and fit.
Top 10 Best Easy To Use Project Management Software of 2026
Written by Diana Reeves·Edited by Catherine Wu·Fact-checked by Astrid Bergmann
Top 10 easy to use project management software ranked by ease, features, and pricing notes for teams comparing tools like Basecamp, ClickUp, and Paymo.

Top 10 Best Pipette Software of 2026
Written by Marcus Engström·Edited by Samuel Norberg·Fact-checked by Rajesh Patel
Rank the top 10 pipette software tools for lab teams with criteria, strengths, and tradeoffs, including Formulatrix MANTIS and INTEGRA VIALAB.

Top 10 Best Wholesale Distributors Software of 2026
Written by David Kowalski·Edited by Timothy Grant·Fact-checked by Rajesh Patel
Top 10 wholesale distributors software ranking with feature tradeoffs for procurement and inventory teams, including Odoo, JOOR, and Cin7.

Top 10 Best Sign Making Software of 2026
Written by Diana Reeves·Edited by Nikolas Papadopoulos·Fact-checked by Yumi Nakamura
Ranked top 10 sign making software with feature comparisons, hardware fit notes, and selection pro tips for shops using Caldera, ONYX, or Easy Cut Studio.

Top 10 Best Promotion Software of 2026
Written by Lars Eriksen·Edited by Claire Beaumont·Fact-checked by Olivia Thornton
Top 10 promotion software ranking covers features and tradeoffs for referral and discount programs, including SweepWidget, Antavo, and ReferralCandy.
Browse our research
Industry reports & market data
Access comprehensive market research reports across key industry verticals. Available for instant download or as part of our custom research services.


Recently updated reports
Stay up-to-date with our latest data updates.

Small Business Payroll Statistics
Small businesses spend a huge portion of their revenue on employee payroll and benefits.

Payroll Statistics
Global payroll markets are booming, driven by outsourcing, automation, and diverse workforce trends.

Fast Fashion Growth Statistics
The fast fashion industry is growing rapidly worldwide despite increasing criticism.

Supply Chain In The Fashion Industry Statistics
The fashion industry's supply chain is a major source of global pollution and human exploitation.

Diversity Equity And Inclusion In The Fast Fashion Industry Statistics
Fast fashion reports show varied progress on diversity, equity, and inclusion across brands and supply chains.

Upskilling And Reskilling In The Fast Fashion Industry Statistics
Fast fashion faces urgent workforce reskilling needs across digital and sustainable skills.

Remote And Hybrid Work In The Staffing Industry Statistics
Remote and hybrid work models are now essential, productive, and preferred in the staffing industry.

Paycheck To Paycheck Statistics
More than 78% of American workers report living paycheck to paycheck, and the details behind that number are just as alarming. From skipping meals and relying on high APR payday loans to postponing medical care and selling possessions for cash flow, these findings map how debt and rising costs squeeze households every month. If you want to see which groups are hit hardest and which spending choices keep the cycle going, the full dataset is worth your attention.

Ach Fraud Statistics
ACH fraud hit $2.3 billion in US losses in 2022, a 15% jump driven largely by business email compromise schemes that target ACH transfers. This dataset also breaks down how different industries and victim groups were affected, from $700 million in return fraud losses for financial institutions to $1.2 billion in B2B losses and $120 million stolen from people over 65. Keep reading to see which attack types and controls made the biggest differences, and where the risk is still rising.

Diversity Equity And Inclusion In The Sales Industry Statistics
Nearly 56% of employees say there are not enough diversity and inclusion efforts in their workplace, and 30% of employees report they have personally experienced discrimination at work. In sales settings, the numbers also reveal gaps in belonging, fairness, and leadership accountability, from pay concerns to ineffective or unenforced DEI initiatives. This post breaks down the statistics to show what sellers and employers are facing and what that means for performance, retention, and trust.

HR Tech Industry Statistics
HR technology software revenue is projected to climb from $32.2B in 2024 to $67.5B by 2030, a 13.0% CAGR. That growth shows up across recruiting, talent management, analytics, payroll, learning, and even HR chatbots and automation, with many markets expanding fast and AI reshaping how work gets done. Explore the full dataset and you will see where budgets are headed and which HR tech capabilities are moving from “nice to have” to core operations.

HR In The Spa Industry Statistics
With therapist pay shaped by details like tips making up 35% of total compensation and 83% earning an average of $28.50 per hour, spa work looks very different from what many assume. This post breaks down the numbers behind benefits like paid time off, insurance, and tuition help, alongside hiring and retention trends such as 62% average industry turnover and what drives it down. If you care about how HR decisions affect real outcomes in spas, these findings are worth digging into.

Work From Home Productivity Statistics
Asana found WFH communication volume jumped 50% in 2022, and many teams felt the overload immediately. From video fatigue cutting collaboration effectiveness by 20% to async communication boosting productivity by 15%, this post pulls together hard numbers on what helps and what quietly derails remote work. It is a deep look at how tools, habits, and home distractions are reshaping productivity in real life.

HR Outsourcing Statistics
With 68% of companies already outsourcing at least one HR function in 2023, up from 52% in 2019, it is clear this is no longer a niche move. The data spans payroll adoption at 72% in the US to rising cloud HR outsourcing at 67% globally, plus sharp differences across RPO, benefits, compliance, and gig workforce models. Dive into the full dataset to see where the biggest cost, time, and risk gains are actually coming from.

AI In The Peo Industry Statistics
By 2024, 84% of PEO leaders using AI said they had moved at least one HR function to full scale deployment, while machine learning in risk assessment reached 52% in 2023 and compliance monitoring hit 68% of firms. Follow the jump from early pilots to measurable impact on claims, payroll, and audit readiness, where AI adoption is tied to higher pass rates and faster resolution times instead of just promising productivity.

Remote And Hybrid Work In The Restaurant Industry Statistics
Remote and hybrid work in restaurants is no longer a perk but a measurable lever, with hybrid models driving 2.4x productivity adjusted ROI in 2024 while remote office space savings reached 18% in 2023. Yet the split is sharp, from 12% of corporate staff fully remote after COVID to just 5% of frontline workers shifting by 2024, alongside the tech and compliance gaps that keep many schedules from running as smoothly as the spreadsheets.
How we rate confidence
Each label summarizes how much signal we saw in our review pipeline—including cross-model checks—not a legal warranty. Use them to scan which stats are best backed and where to dig deeper. Bands follow a steady target mix: about 70% Verified, 15% Directional, and 15% Single source across row-level indicators.
Strong alignment across our automated checks and editorial review: multiple corroborating paths to the same figure, or a single authoritative primary source we could re-verify.
All four model checks registered full agreement for this band.
The evidence points the same way, but scope, sample, or replication is not as tight as our Verified band. Useful for context—not a substitute for primary reading.
Mixed agreement: some checks fully green, one partial, one inactive.
One traceable line of evidence right now. We still publish when the source is credible; treat the number as provisional until more routes confirm it.
Only the lead check registered full agreement; others did not activate.
Trust & transparency standards
We hold ourselves to high standards in security, privacy, ethics, and quality. Each badge is a self-declared commitment unless stated otherwise.
Climate Conscious Company
Carbon-aware hosting & sustainable operations
Securely-Hosted Infrastructure
Enterprise cloud, 99.9% uptime SLA
GDPR Compliant
Full EU General Data Protection compliance
Data Protected by Design
Privacy-first, data minimization
SSL/TLS Encrypted
TLS 1.3 on all data transmissions
Ethical Research Standards
Methodology aligned with academic integrity
Diversity & Inclusion Committed
D&I across hiring, content & partnerships
AI-Assisted, Human-Verified
AI accelerates; humans make every final decision
SOC 2 Principles Aligned
Practices aligned with SOC 2 trust criteria
Digital Accessibility Committed
Working toward WCAG 2.1 AA
Responsible AI Use Policy
Transparent AI governance & disclosure
Independent & Editorially Neutral
Independent Product Evaluation; editorial independence
Secure Payment Processing
PCI-compliant providers, tokenized
13 active commitments
Self-declared standards. Third-party certs noted where applicable.
As seen in
Companies & media that referenced us
A small selection of organizations that have cited our AI-verified market research. Real citations — Independent Product Evaluation.
About Gitnux
The people behind the data
Full team profiles →Founded in 2021. Four researchers across three continents. Every statistic independently verified before publication. Trusted by decision-makers at 500+ organizations worldwide.

Abigail Foster
Senior Data Analyst
Abigail Foster spent five years as a philanthropy technology researcher at an independent social sector advisory firm in Indianapolis. She later worked as a freelance social sector analyst. She trained in Nonprofit Management and Economics, holding a Master's in Nonprofit Management and a Bachelor's in Economics. At Gitnux, she reports on nonprofit management technology, donor analytics, and philanthropic data.

Aisha Okonkwo
Research Analyst
Aisha Okonkwo spent four years at an economic advisory firm in London producing emerging market analyses before freelancing for development publications. She is a Research Analyst at Gitnux and covers emerging market dynamics, African tech ecosystems, and cross-border e-commerce. She earned a Master's in Development Economics and a Bachelor's in International Relations.

Alexander Schmidt
Industry Analyst
Alexander Schmidt earned a Bachelor's in Economics and a Master's in Data Science. Previously, he spent four years as a data analyst at an independent technology research firm in Berlin, producing quarterly reports on European software adoption. He later worked as a freelance technology journalist for German and English-language business publications. At Gitnux, he handles the technology and SaaS research verticals.

Astrid Bergmann
Senior Data Analyst
Astrid Bergmann spent four years as an aquaculture industry researcher at an independent marine resources advisory institute in Bergen. She later worked as a freelance marine economy analyst. She is a Senior Data Analyst at Gitnux, covering aquaculture data, seafood market economics, and marine resource management metrics. Her background includes a Master's in Marine Biology and a Bachelor's in Environmental Science.

Catherine Wu
Market Intelligence
Catherine Wu spent five years as an IP market researcher at an independent technology licensing advisory firm in Washington, D.C. She later worked as a freelance IP analyst. Her background includes a Master's in Law and a Bachelor's in Computer Science. At Gitnux, she specializes in intellectual property data, patent analytics, and technology licensing market trends.

Christopher Morgan
Industry Analyst
Christopher Morgan earned a Master's in Statistics and a Bachelor's in Mathematics. He spent five years as a gaming industry researcher at an independent gambling advisory firm in London. He later worked as a freelance gaming market analyst. At Gitnux, he reports on sports betting technology, gambling regulation data, and gaming platform analytics.

Claire Beaumont
Senior Research Analyst
As a Senior Research Analyst at Gitnux, Claire Beaumont tracks education technology, corporate learning, and digital credentialing. She holds a Master's in Learning Sciences and a Bachelor's in Cognitive Science. Previously, she spent five years at an independent education research organization leading program evaluations before advising VC firms as a freelance edtech analyst.

Daniel Varga
Research Analyst
Daniel Varga holds a Master's in Industrial-Organizational Psychology and a Bachelor's in Business Administration. As a Research Analyst at Gitnux, he specializes in HR technology, workforce analytics, and organizational development. Previously, he spent four years at a European HR advisory practice designing engagement surveys and benchmarking reports. He later consulted independently for multinational corporations.

David Kowalski
Research Analyst
David Kowalski spent four years at a European network advisory firm before freelancing as a telecom analyst. He is a Research Analyst at Gitnux, covering telecommunications infrastructure, 5G deployment, and spectrum policy. He earned a Master's in Electrical Engineering and a Bachelor's in Physics.

David Sutherland
Market Intelligence
David Sutherland earned a Master's in Economics and a Bachelor's in Business Administration. As a Market Intelligence specialist at Gitnux, he covers global beer and spirits market data, brewery economics, and alcohol regulatory statistics. Previously, he spent five years as a beverage industry researcher at an independent drinks market advisory firm in Edinburgh. He later worked as a freelance beverage market analyst.
Got questions?
Frequently asked questions
Everything you need to know about our market research services
What is Gitnux?
Gitnux is an independent market research company providing comprehensive industry data, statistics, and custom research solutions. We equip forward-thinking companies and professionals with data-driven insights and actionable research to help them make informed strategic decisions.
Is Gitnux reliable?
Gitnux uses a five-step editorial process where human researchers curate data from primary sources, internal AI systems independently verify each claim through reproduction analysis and cross-referencing, and human editors make the final publication decision. Our research team includes analysts with backgrounds in business analytics (IIM Bangalore), behavioral economics (University of Warwick), data science (University of Mannheim), and environmental policy (Seoul National University). Read more in our Editorial Process section.
What is Gitnux Market Data?
Gitnux Market Data is our flagship section featuring thoroughly researched and visually prepared reports on various industry topics. Our Market Data Reports have been referenced by hundreds of major publications including Microsoft, Google, Harvard Business Review, and The Guardian as authoritative sources. We continuously update our reports to ensure accuracy and relevance.
How often is the data updated?
We follow a strict schedule for data updates. Most of our reports are updated quarterly, while rapidly evolving industries receive more frequent updates. Each report includes its last update date and scheduled revision information.
Can I use Gitnux data in my own publications?
Yes, you can cite Gitnux data in your publications with proper attribution. We ask that you include a link to the original report page when citing online. For academic or commercial publications, please contact us for detailed citation guidelines.
Do you offer custom research services?
Yes! We offer tailored market research solutions starting at €5,000. Our expert analysts can help with market sizing, competitor analysis, customer segmentation, market entry strategies, and more. We also offer Software Advisory — independent vendor selection based on our 1,000+ AI-verified Best Lists — from €2,500. Projects typically take 2-6 weeks. Visit our Services page or contact us to discuss your research needs.
Can I buy comprehensive industry reports?
Absolutely! We offer premium industry reports starting at €499 with instant download. Our reports include market size & forecasts, competitive landscape, trend analysis, and comprehensive data tables. We cover 50+ industries with regular updates. Browse our catalog on the Services page.
How many reports and industries do you cover?
We have published over 1,000+ market data reports covering 50+ major industries including Technology & SaaS, E-Commerce, Healthcare, Financial Services, Manufacturing, and more. Our library is continuously growing with new reports added monthly.
Who uses Gitnux data?
Our research is used by Fortune 500 companies, consulting firms, investors, startups, journalists, and academics worldwide. Our data has been cited by Microsoft, Adobe, Google, Fortune, Harvard Business Review, The Guardian, PBS, and hundreds more leading organizations.
How can I suggest a topic for research?
We welcome topic suggestions from our users. Please use our contact page to submit your ideas for future market data reports. While we can't guarantee coverage of every suggestion, we carefully consider user input when planning our research calendar.