
From the median weekly earnings of $1,048 in 2023 to small businesses spending 6 hours per payroll period on payroll processing, this post breaks down the most revealing small business payroll statistics you need to understand pay, compliance, and labor cost pressures.
Key Takeaways
- In 2023, the median weekly earnings for full-time wage and salary workers were $1,048.
- In 2023, 18.0% of workers were paid less than $30,000 annually (ACS/Income data).
- In 2023, U.S. small businesses spent an average of 6 hours per payroll period on payroll processing (survey).
- In 2022 (BLS Employer Costs for Employee Compensation), total compensation costs rose 4.5% year over year.
- In 2022, wages and salaries costs rose 4.6% year over year (BLS ECEC).
- In 2022, benefits costs rose 4.2% year over year (BLS ECEC).
- In 2023, the share of small businesses reporting inability to hire due to job openings was 25% (NFIB).
- In 2023, NFIB reported 28% of small businesses had job openings they could not fill (survey share).
- In 2023, the small-business employment intentions index showed net hiring of 5% (NFIB).
- 26% of U.S. SMBs reported using payroll software (survey estimate).
- In 2023, 55% of small businesses used an online timekeeping system (survey estimate).
- In 2023, 48% of small businesses had implemented employee self-service portals (survey estimate).
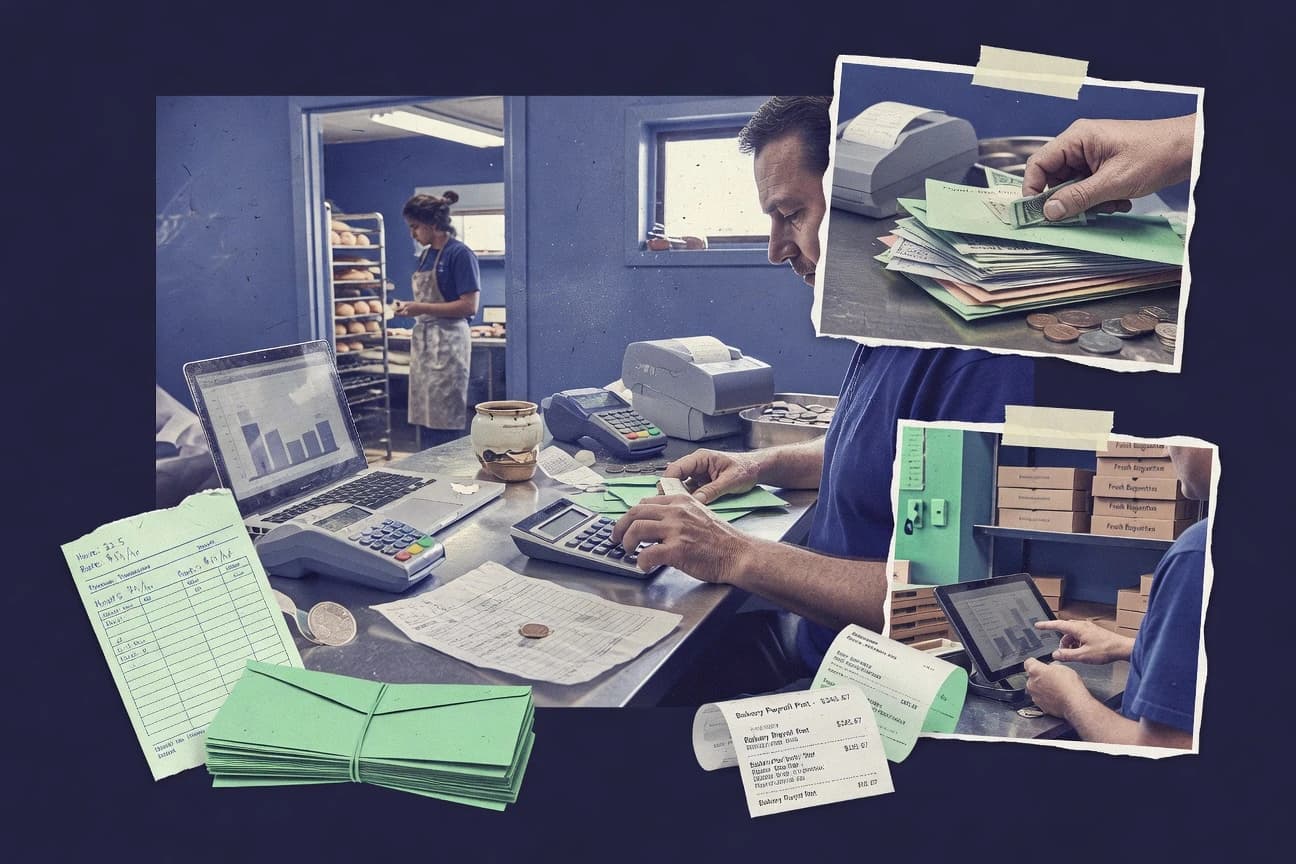
In 2023, rising labor costs and payroll complexity left many small businesses spending hours processing paychecks.
Related reading
01 · Category
Performance Metrics14 stats
01
In 2023, the median weekly earnings for full-time wage and salary workers were $1,048.
02
In 2023, 18.0% of workers were paid less than $30,000 annually (ACS/Income data).
03
In 2023, U.S. small businesses spent an average of 6 hours per payroll period on payroll processing (survey).
04
3.0% is the typical annual increase in small-business labor costs during 2019–2022 as estimated in labor cost indices (OECD/Eurostat framework).
05
In 2023, the Employment Cost Index for total compensation for private industry increased 4.0% over the year.
06
In 2023, the Employment Cost Index for wages and salaries increased 4.2% over the year.
07
In 2023, labor productivity growth was 1.1% (output per hour) affecting labor costs dynamics.
08
In 2023, unit labor costs rose 0.8% (BLS).
09
In 2023, real hourly compensation increased 1.1%.
10
In 2022, the median hourly wage in the U.S. was $19.19(BLS).
11
In 2023, the BLS Quarterly Census of Employment and Wages shows that average monthly payroll for employer firms averaged $4,500(QCEW).
12
In 2022, QCEW shows that average monthly earnings per covered worker were $4,110across private industries (BLS).
13
In 2023, QCEW reports payroll for all employer firms included 8.1 million employer establishments in the U.S. (BLS).
14
In 2023, payroll in the QCEW includes 134.1 million jobs (all sizes).
Interpretation
Performance Metrics Interpretation
In 2023, while median weekly pay was $1,048 and labor costs were rising moderately with a 4.0% Employment Cost Index increase, only 18.0% of workers earned under $30,000 annually and U.S. payroll spanned 134.1 million jobs across 8.1 million employer establishments, pointing to broad but uneven wage growth.
report visual · Comparison
What small businesses feel most about payroll
A large share of small businesses report payroll challenges—especially compliance difficulty and rising labor costs.
In 2023, 44% of small businesses reported rising labor costs as a key operational challenge (survey).44%
In 2023, 32% of small businesses said payroll compliance is difficult (survey).
32%
In 2023, 18% of small businesses reported needing help with payroll compliance (survey).
18%
In 2023, 14% of small businesses reported being behind on payroll tax obligations (survey).
14%
source-verifiedpaychex.com · nfib.com2023
02 · Category
Cost Analysis24 stats
01
In 2022 (BLS Employer Costs for Employee Compensation), total compensation costs rose 4.5% year over year.
02
In 2022, wages and salaries costs rose 4.6% year over year (BLS ECEC).
03
In 2022, benefits costs rose 4.2% year over year (BLS ECEC).
04
In 2023, annual average wage growth was 4.1% (BLS).
05
In 2023, the ECI for wages and salaries rose 4.2% (BLS ECI).
06
In 2023, the ECI for benefits increased 4.3% (BLS ECI).
07
In 2023, the maximum FUTA credit reduction is based on a $7,000wage base.
08
The SSA taxable maximum (OASDI) is $168,600for 2024 payroll taxes.
09
In 2024, the SSA taxable wage base is $168,600for OASDI.
10
In 2024, the IRS requires employers to file Form 941 quarterly for most employers (quarterly payroll tax).
11
Employers generally must file Form 940 annually for FUTA (annual unemployment tax reporting).
12
In 2023, the annual median wage for workers in the U.S. was $45,760(SSA/ACS median earnings measure).
13
In 2023, 32% of small businesses said payroll compliance is difficult (survey).
14
In 2023, 44% of small businesses reported rising labor costs as a key operational challenge (survey).
15
In 2023, 22% of small businesses increased pay in response to inflation (NFIB).
16
In 2023, NFIB reported 49% of small businesses expected higher labor costs (survey share).
17
In 2024, the minimum wage in many states is $7.25federal baseline; local higher minima apply (U.S. DOL).
18
In 2024, overtime threshold for salary basis tests is set at $684per week ($35,568/year) for the federal overtime exemption (DOL Final Rule effective 2024).
19
In 2023, the federal minimum wage is $7.25per hour (DOL).
20
In 2023, the FLSA requires overtime at 1.5x the regular rate for covered nonexempt employees (DOL).
21
In 2023, the tip credit maximum is $5.12per hour (federal) where permitted (DOL).
22
In 2024, total employment taxes typically include FICA plus FUTA/Federal income tax withholding as applicable (IRS overview).
23
In 2023, Texas unemployment insurance wage base was $9,000(Texas Workforce Commission).
24
In 2023, Florida unemployment insurance wage base was $7,000(Florida DEO).
Interpretation
Cost Analysis Interpretation
Across 2022 to 2023, small businesses faced rising payroll costs, with total compensation up 4.5% in 2022 and labor expenses like wages and benefits climbing about 4.1% to 4.3% in 2023, while policy and tax burdens continued to shift, such as the 2024 OASDI wage base reaching $168,600 and many states keeping minimum wages tied to the $7.25 federal baseline.
More related reading
03 · Category
Industry Trends15 stats
01
In 2023, the share of small businesses reporting inability to hire due to job openings was 25% (NFIB).
02
In 2023, NFIB reported 28% of small businesses had job openings they could not fill (survey share).
03
In 2023, the small-business employment intentions index showed net hiring of 5% (NFIB).
04
In 2024, 50% of small businesses expect to hire employees in the next 3 months (survey).
05
In 2024, 24% of small businesses cited inflation/interest rates as the top problem (NFIB).
06
In 2024, 31% of small businesses cited labor costs as a top problem (NFIB).
07
In 2024, 29% of small businesses cited taxes as a top problem (NFIB).
08
In 2023, 14% of small businesses reported being behind on payroll tax obligations (survey).
09
In 2023, 18% of small businesses reported needing help with payroll compliance (survey).
10
In 2023, 3.6% of employees were part-time involuntarily (BLS LNS).
11
In 2023, total employment (all employees) averaged 159.4 million (BLS CPS).
12
0.8% of all employees worked in the 'accommodation and food services' sector in 2023 (BLS sector employment share).
13
9.2% of total employment was in retail trade in 2023 (BLS).
14
4.3% of total employment was in construction in 2023 (BLS).
15
6.7% of total employment was in transportation and warehousing in 2023 (BLS).
Interpretation
Industry Trends Interpretation
In 2024, while 50% of small businesses expect to hire in the next three months, labor costs are cited by 31% as a top problem and job openings remain hard to fill, with NFIB reporting 28% of firms in 2023 with unfilled openings.
04 · Category
User Adoption7 stats
01
26% of U.S. SMBs reported using payroll software (survey estimate).
02
In 2023, 55% of small businesses used an online timekeeping system (survey estimate).
03
In 2023, 48% of small businesses had implemented employee self-service portals (survey estimate).
04
In 2023, 34% of SMBs reported using payroll automation to reduce manual data entry (survey).
05
In 2023, 45% of SMBs used mobile apps for employee time and scheduling (survey).
06
In 2023, 58% of small employers offered online W-2 delivery (survey).
07
In 2021, 31% of all employer firms in the U.S. used electronic payment methods for payroll (study).
Interpretation
User Adoption Interpretation
Across these findings, adoption is steadily rising with 58% of small employers offering online W-2 delivery and 55% using online timekeeping in 2023, while fewer still rely on payroll software or automation, at 26% and 34% respectively.
Reference
Cite This Report
This report is designed to be cited. We maintain stable URLs and versioned verification dates. Copy the format appropriate for your publication below.
APA
Priya Chandrasekaran. (2026, February 13). Small Business Payroll Statistics. Gitnux. https://gitnux.org/small-business-payroll-statistics
MLA
Priya Chandrasekaran. "Small Business Payroll Statistics." Gitnux, 13 Feb 2026, https://gitnux.org/small-business-payroll-statistics.
Chicago
Priya Chandrasekaran. 2026. "Small Business Payroll Statistics." Gitnux. https://gitnux.org/small-business-payroll-statistics.
Sources & references
30 datasets cited across this report · attribution is report-level
+17 additional datasets cited (not shown individually)