GITNUX MARKETDATA
Browse Our Category
Wedding Event Planning
Latest update:


Wedding Venue Industry Statistics
U.S. couples keep choosing venues with intention while budgets get squeezed by inflation pressure and higher service labor costs, and 73% of wedding vendors say cancellations hit revenue. With 70% of consumers relying on online planning, reviews and ratings shaping bookings, and event tech adoption rising fast alongside a 12% annual growth forecast for event management software, this page shows what is most likely to boost repeat demand and protect margins for venues in 2026.

Vietnam Wedding Industry Statistics
Vietnam’s wedding market is no longer moving at the same pace, with 2025 figures pointing to sharper changes in spending and planning than many couples expected. Before you lock in venues and vendors, these Vietnam Wedding Industry statistics highlight what is actually shifting across the market and where demand is tightening.

Uae Wedding Industry Statistics
UAE wedding industry numbers for 2025 reveal how quickly budgets, services, and guest expectations are shifting compared with the years everyone thinks they remember. If you are planning, pricing, or simply benchmarking a wedding business, these timely statistics will tell you what is actually changing and where the real demand is moving next.
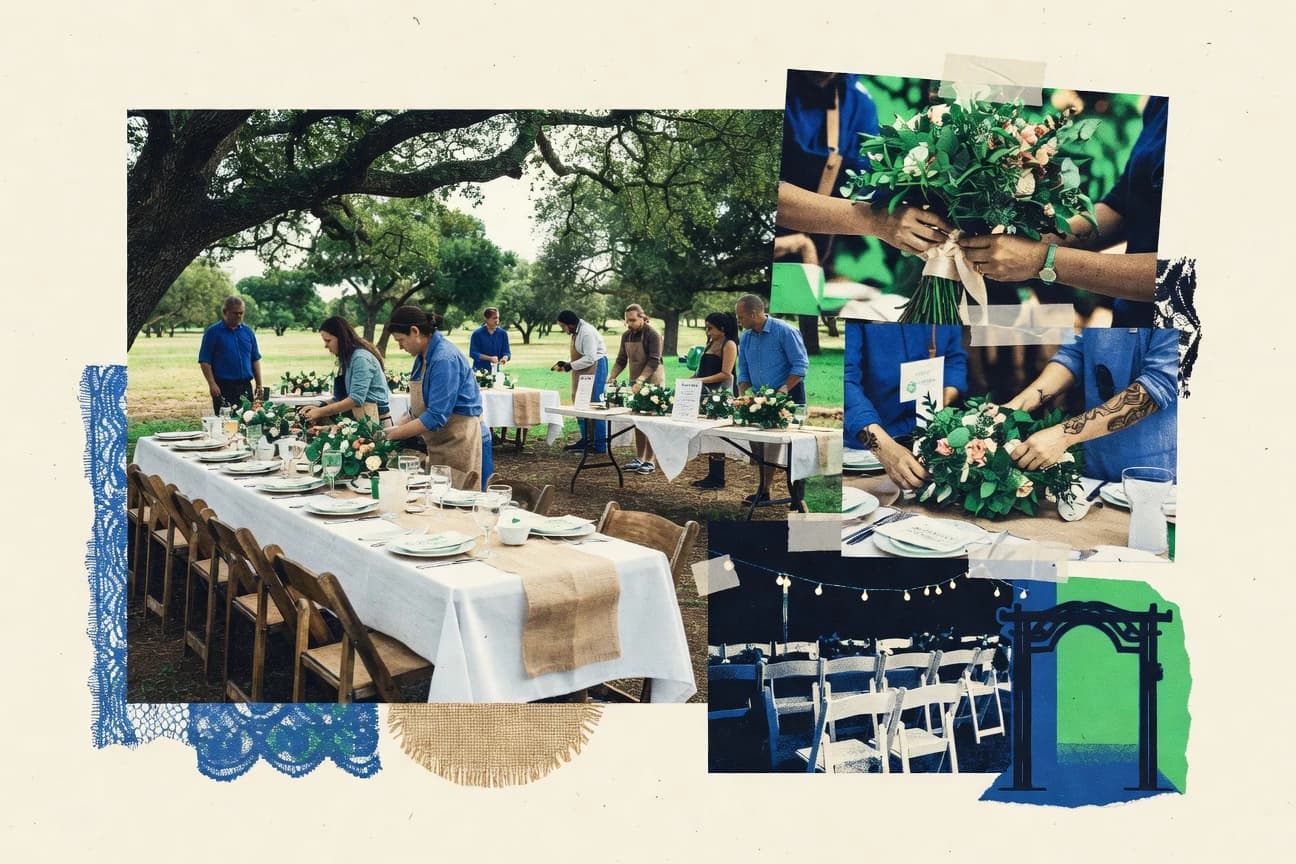
Texas Wedding Industry Statistics
Texas couples are reshaping wedding spending fast, with 2026 forecast figures pointing to a sharper split between high end “wow” upgrades and careful value choices. Use these Texas Wedding Industry statistics to spot what is changing now and what buyers and vendors may be able to bet on next.

Spain Wedding Industry Statistics
Spain’s wedding industry is showing a sharp shift in demand and spend, with 2025 figures revealing how couples are rebalancing budgets and priorities. If you want to understand what those changes mean for venues, planners, and suppliers this year, these Spain wedding industry statistics make the trends impossible to ignore.

Luxury Wedding Industry Statistics
See how Luxury Wedding Industry spending is shifting toward experiences, with 2025 data revealing the strongest demand signals for premium services and tighter date and vendor planning. You will learn where budgets are expanding and where they are being squeezed so you can benchmark decisions with confidence.

Bridal Industry Statistics
From COVID driven delays to budget tightening, bridal demand is being reshaped in real time, with 63% of US couples saying wedding planning stress affected when they bought bridal apparel. You will also find current retail and e-commerce pressure points that directly hit pricing and conversion, from a $1,600 average US wedding dress price in 2024 and 39% of shoppers abandoning if checkout is too complicated to how 61% of couples search online for dress styles before visiting stores.

Wedding Cost Statistics
From venue inflation to the parts most couples forget, this page breaks down the real price of getting married in 2024, when the national average wedding cost climbed to $33,000. You will see how details like a bride’s $1,600 dress, $2,500 photo coverage, and a $6,000 venue rental add up, plus what you can save long term by choosing a $600 tux purchase over rentals.

Wedding Ring Statistics
Most people take about 3 months to shop, yet 40% now buy engagement rings online and 72% research on social media before they even walk into a store. From 46% choosing lab grown in 2023 to 40% of rings needing a resize within the first year, Wedding Ring lays out the choices, costs, and surprises that shape modern proposals.

Wedding Statistics
From white to off white, DIY to drone, today’s weddings balance tradition with quick shifts like 80% of couples going on honeymoon soon after the ceremony and 15% already choosing a short minimoon first. Get the year’s most telling contrasts, including ring and ceremony trends, new tech habits like QR RSVPs, and the real money picture where the U.S. average wedding hits $35,000 in 2023 yet 47% of couples still go over budget.

Destination Wedding Statistics
Destination weddings average $35,000 in total costs, yet international planning can push hidden line items higher, from 25% pricier imported flowers to $1,200 legal fees, so couples are budgeting carefully alongside the 39% average guest attendance. If you want the most up to date picture of where demand is actually going, the global market is projected to reach $35.2 billion by 2030, with travel influenced by everything from all inclusive preference to a 28% cost based drop in would be attendees.
Wedding Planner Statistics
Wedding planners are now saving US couples 20 to 30 percent on expenses while charging about 10 to 15 percent of the budget, and couples report 92 percent satisfaction compared with 75 percent for DIY. But the real surprise is the spread of real world fees and outcomes across regions, from UK planning at roughly £1,500 to £5,000 to destinations where commissions and travel can push costs far higher, revealing how strategy beats guesswork.

Party Industry Statistics
With U.S. consumers planning 65% of parties in 2024 and online shopping taking 55% of party supply buys, this page breaks down why budgets are shifting toward personalization, eco choices, and faster planning. It pairs essentials like the $19.5 billion global party supplies market in 2023 and average baby shower costs of $500 in the U.S. with the newer signals shaping 2025 to 2030 growth, from biodegradable demand up 50% since 2021 to hybrid corporate events and AI tools gaining a real foothold.
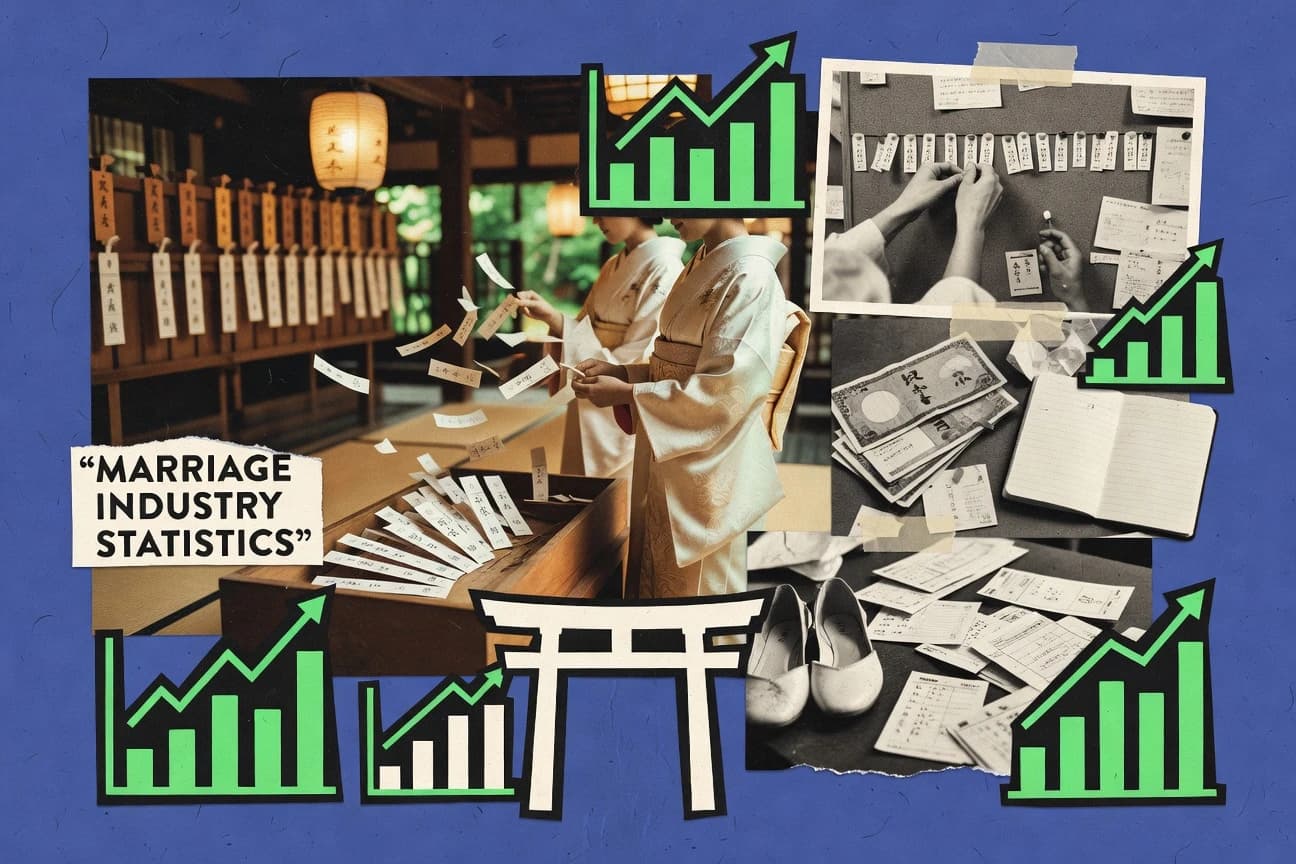
Japan Marriage Industry Statistics
With Japan recording 183,677 divorces in 2022 and a divorce rate of 1.57 per 1,000, the page connects who initiates breakups and when marriage fails, from the 40–44 age group to a median divorce timeline of 12.5 years. It also ties family outcomes to policy and industry costs, including mothers receiving custody in 90% of cases, grey divorce jumping 20% since 2012, and how a recovery wedding market near 2.8 trillion yen reshapes choices for couples.

Indian Wedding Industry Statistics
A typical middle class Indian wedding budget lands around ₹20 to 30 lakhs, but the biggest reveal is how quickly those line items stack up, from jewellery at 25 to 30 percent to mandap, decor, and rituals that can push total spend close to the luxury zone for the right add ons. If you are planning in 2025, it helps to know what matters most now as 65 percent of couples favor sustainable wedding themes and 72 percent of millennials are choosing destination weddings instead of traditional home ceremonies.

Korea Wedding Industry Statistics
With the total Korean wedding market now projected to reach 18.5 trillion KRW by 2030 and small weddings climbing toward 55 percent of the market by 2027, the pressure to spend smarter is everywhere. Marriage demand is still cooling, couples are planning with social media muscle and eco and K culture touches, and even 2023 costs tell the story as budgets shift under 150 million KRW for more couples.

Bridal Fashion Industry Statistics
Age and values are reshaping bridal style fast, with 76% of US brides falling into the millennial and Gen Z range and 72% shopping 6 to 12 months ahead, while online try on and virtual tools are cutting friction and returns. The market is expanding beyond tradition and size norms too, including a global 35% surge in plus size bride shoppers and a luxury segment that still holds 28% of the worldwide bridal wear market, plus eco and circular choices moving from trend to expectation.

India Wedding Industry Statistics
From 72% of millennials choosing destination weddings to 80% more urban couples going live with wedding streaming after COVID, India’s wedding industry is updating fast as 70% plan within six months of engagement and 70% now pair it with health conscious menus. Read the page to see how sustainability is moving beyond decor with 65% opting for eco friendly elements and 52% choosing lab grown diamonds, while the business behind the celebration employs over 20 million people and keeps growing toward a USD 75 billion market by 2028.

Brazil Wedding Industry Statistics
Brazil’s wedding industry topped R$ 28.5 billion in 2023, with couples budgeting R$ 145,000 on average for an urban celebration and catering rising to R$ 350 per guest. From São Paulo venue rentals that take 31% of the budget to sustainable themes favored by 68% of couples, this page shows exactly where Brazilian weddings spend the most and what is changing fast.

Ireland Wedding Industry Statistics
Ireland weddings kept moving fast into 2023, but the story is in the contrasts, with couples spending an average of €32,000 and the industry adding €1.45 billion to the economy, while guest lists shrank to 112 and 71% now meet online. From 8% LGBTQ+ ceremonies and 67% choosing sustainable options to tech add ons like RSVP apps and booming micro weddings, these sector figures explain exactly what couples are prioritising and how venues and suppliers are adapting.