
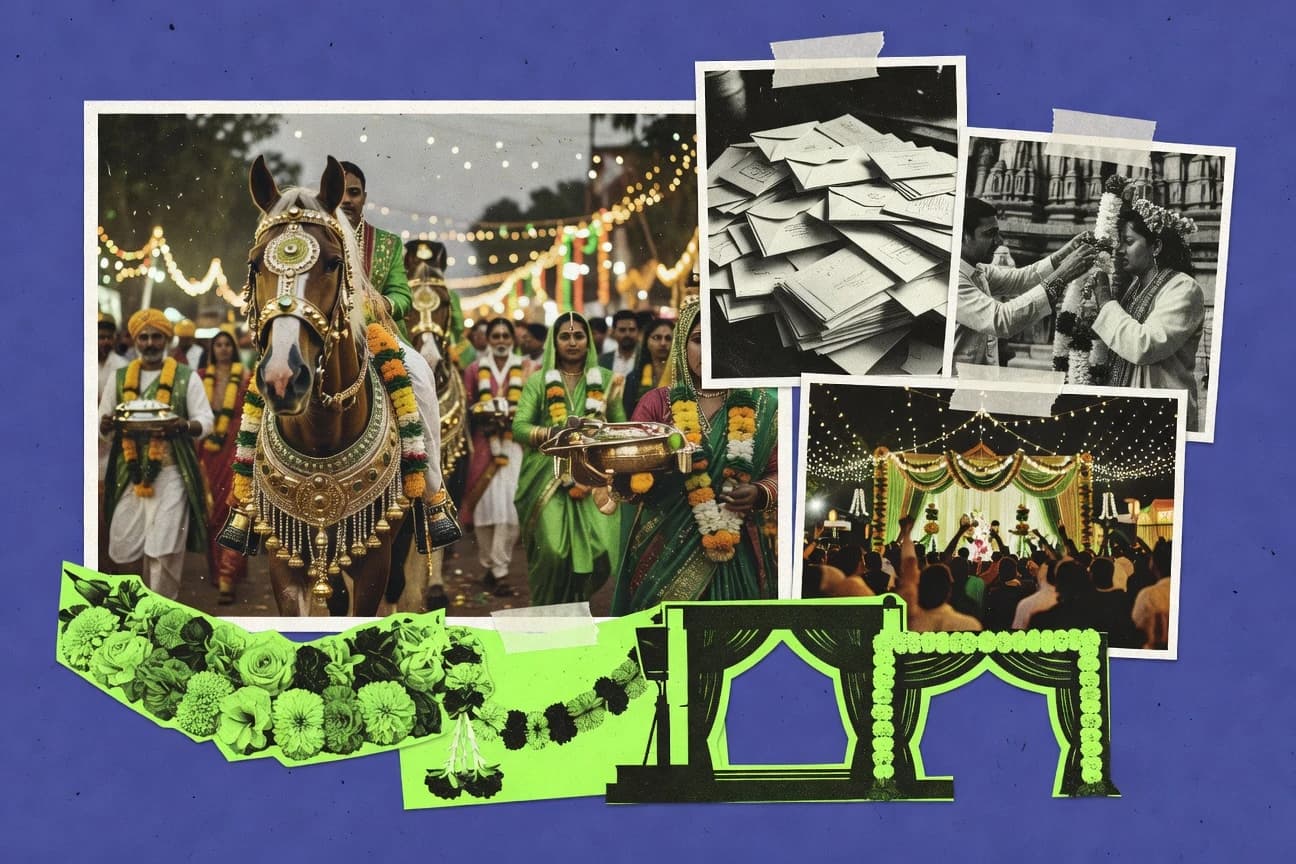

Explore India’s wedding industry as it evolves across regions and budgets—from venue and jewelry spend to planners and caterers powering celebrations. The sector supports over 20 million people and is led by specialists such as about 50,000 wedding planners and 5 million catering workers. You’ll also track how preferences shift in 2023, including eco-friendly elements, pastel palettes, destination weddings, and the rise of live streaming after COVID—plus where spending concentrates in Delhi-NCR, Rajasthan, and Maharashtra.
Key Takeaways
- 65% of couples prefer sustainable wedding elements like eco-friendly decor in 2023.
- 72% of millennials opt for destination weddings over traditional ones.
- Live streaming of weddings increased by 80% post-COVID among urban couples.
- The wedding industry employs over 20 million people directly and indirectly in India.
- Wedding planners number around 50,000 professionals nationwide.
- Caterers employ 5 million workers for wedding events annually.
- The Indian wedding industry was valued at approximately USD 50 billion in 2023, marking a 25% growth from pre-pandemic levels.
- In 2022, the wedding sector contributed around 1.2% to India's GDP, driven by luxury spending.
- The industry is projected to reach USD 75 billion by 2028, with a CAGR of 8.5% from 2023-2028.
- North India accounts for 40% of total wedding spending, with Delhi-NCR leading at INR 10,000 crore annually.
- South India weddings average 1,000 guests, 20% higher than national average.
- Rajasthan destination weddings: 25% of national total, generating INR 5,000 crore.
- Average cost of an Indian wedding in 2023 was INR 20-50 lakhs (USD 24,000-60,000) for middle-class families.
- Luxury weddings averaged INR 5 crore (USD 600,000) per event in 2023.
- Jewelry spending constitutes 40% of total wedding budget, averaging INR 15 lakhs.
In 2023, India’s wedding industry grew fast as destination choices, live streaming, and luxury spending reshaped budgets.
Related reading
01 · Category
Consumer Trends & Preferences30 stats
01
65% of couples prefer sustainable wedding elements like eco-friendly decor in 2023.
02
72% of millennials opt for destination weddings over traditional ones.
03
Live streaming of weddings increased by 80% post-COVID among urban couples.
04
55% of brides choose pastel color palettes for 2023 weddings.
05
Personalized wedding invitations via apps used by 40% of couples.
06
68% prefer fusion cuisine over pure traditional menus.
07
Pre-wedding shoots chosen by 75% of Gen Z couples.
08
60% opt for celebrity choreographers for sangeet performances.
09
Eco-friendly jewelry rentals preferred by 45% to reduce costs.
10
70% use wedding planning apps like WedMeGood.
11
Theme weddings (royal, beach) up 50% in popularity.
12
52% choose lab-grown diamonds over natural for sustainability.
13
Virtual reality wedding previews adopted by 30% luxury couples.
14
65% prioritize health-conscious menus with vegan options.
15
Minimalist decor preferred by 58% urban brides.
16
Drone photography in 40% of high-end weddings.
17
75% couples plan weddings within 6 months of engagement.
18
Gender-neutral wedding attire rising at 35% adoption.
19
62% incorporate tech like LED walls for entrances.
20
Pet-inclusive weddings up by 25% among young couples.
21
48% choose off-season dates for cost savings.
22
Handmade artisanal decor favored by 55%.
23
70% use social media for vendor discovery.
24
Flash mob performances in 42% sangeet events.
25
67% prefer intimate weddings with <200 guests.
26
AR filters for invitations used by 28%.
27
53% opt for experiential gifting over material.
28
Wellness pre-wedding rituals up 40%.
29
61% choose international honeymoon destinations post-wedding.
30
Vintage theme weddings surged 35% in 2023.
Interpretation
Consumer Trends & Preferences Interpretation
In India’s wedding consumer trends, sustainability is becoming a mainstream preference with 65% of couples choosing eco friendly elements in 2023, alongside growing digital and experience driven choices like 80% higher live streaming and 72% of millennials favoring destination weddings.
02 · Category
Industry Employment & Services28 stats
01
The wedding industry employs over 20 million people directly and indirectly in India.
02
Wedding planners number around 50,000 professionals nationwide.
03
Caterers employ 5 million workers for wedding events annually.
04
Jewelry designers and craftsmen: 2 million in wedding segment.
05
Venue managers and staff: 1.5 million jobs created yearly.
06
Makeup artists certified for weddings: 100,000+, growing 20% YoY.
07
Photographers and videographers: 200,000 full-time in industry.
08
Florists and decorators employ 3 million seasonal workers.
09
DJs and entertainers: 50,000 professionals servicing weddings.
10
Choreographers for sangeet: 30,000 active in 2023.
11
Mehendi artists: 150,000, with 40% freelance for weddings.
12
Tailors for bridal wear: 1 million in unorganized sector.
13
Event staff (waiters, cleaners): 4 million temporary hires per season.
14
Wedding tech startups employ 10,000 developers and marketers.
15
Tourism jobs from weddings: 2 million in hospitality.
16
Goldsmiths and jewelers: 500,000 specialized for weddings.
17
Invitation printers employ 100,000 artisans.
18
Transport drivers for baraat: 300,000 seasonal jobs.
19
Priest and astrologer services: 50,000 full-time.
20
Bakery chefs for wedding cakes: 80,000 specialized.
21
Security personnel for events: 1 million hires annually.
22
Digital marketers for wedding vendors: 20,000 roles.
23
Sustainable decor craftsmen: 200,000 emerging jobs.
24
Live band musicians: 100,000 performers.
25
Wedding coordinators in hotels: 50,000 staff.
26
Gift packaging artisans: 150,000.
27
Pre-wedding content creators: 40,000 influencers/freelancers.
28
Tent fabricators and riggers: 250,000 workers.
Interpretation
Industry Employment & Services Interpretation
Across India’s Industry Employment and Services ecosystem, the wedding sector supports over 20 million jobs, powered by fast growing specialist roles like 100,000 plus wedding makeup artists with 20% year over year growth.
03 · Category
Market Size & Economic Impact30 stats
01
The Indian wedding industry was valued at approximately USD 50 billion in 2023, marking a 25% growth from pre-pandemic levels.
02
In 2022, the wedding sector contributed around 1.2% to India's GDP, driven by luxury spending.
03
The industry is projected to reach USD 75 billion by 2028, with a CAGR of 8.5% from 2023-2028.
04
During 2023, over 10 million weddings took place in India, generating USD 15 billion in immediate revenue.
05
The luxury wedding segment alone accounted for USD 20 billion in 2023, up 30% YoY.
06
Wedding-related tourism contributed USD 12 billion to the economy in 2023.
07
The industry's gold and jewelry segment was worth USD 25 billion in FY2023.
08
Banquets and venues generated USD 8 billion in revenue in 2023.
09
Catering services for weddings contributed USD 10 billion in 2023.
10
Wedding apparel and fashion segment reached USD 15 billion in 2023.
11
The digital wedding planning market grew to USD 2 billion in 2023.
12
Post-COVID recovery saw a 40% surge in wedding industry revenue in 2022.
13
The industry supports ancillary sectors worth USD 30 billion annually.
14
In 2023, destination weddings added USD 5 billion to the market.
15
Jewelry rentals for weddings hit USD 1.5 billion in 2023.
16
Wedding planners' revenue reached USD 3 billion in FY2023.
17
The makeup and beauty services segment was valued at USD 4 billion in 2023.
18
Photography and videography contributed USD 2.5 billion in 2023.
19
Entertainment and DJ services generated USD 1.8 billion in 2023.
20
Invitation and stationery market for weddings: USD 500 million in 2023.
21
Honeymoon travel bookings from weddings: USD 6 billion in 2023.
22
Car rental for wedding processions: USD 1.2 billion in 2023.
23
Floristry and decoration services: USD 7 billion in FY2023.
24
The overall wedding industry tax contribution was USD 5 billion in 2023.
25
Export of wedding-related services reached USD 2 billion in 2023.
26
SME contribution to wedding industry: 70% of total USD 50 billion market.
27
Online wedding marketplaces generated USD 1 billion in 2023.
28
Pre-wedding shoot market: USD 800 million in 2023.
29
Sustainable wedding practices segment: USD 500 million growth in 2023.
30
The Indian wedding industry saw a 15% increase in venture funding to USD 300 million in 2023.
Interpretation
Market Size & Economic Impact Interpretation
India’s wedding industry is expanding fast with a USD 50 billion market in 2023 and a projected rise to USD 75 billion by 2028 at an 8.5% CAGR, making it a meaningful and growing driver of economic impact through luxury spending and wedding tourism that added USD 12 billion in 2023.
More related reading
04 · Category
Regional & Cultural Variations27 stats
01
North India accounts for 40% of total wedding spending, with Delhi-NCR leading at INR 10,000 crore annually.
02
South India weddings average 1,000 guests, 20% higher than national average.
03
Rajasthan destination weddings: 25% of national total, generating INR 5,000 crore.
04
Maharashtra luxury weddings cost 30% above national average.
05
Bengal weddings emphasize gold, with 300g average per event.
06
Punjab weddings feature 50% higher baraat expenses due to horses and bands.
07
Kerala temple weddings: 60% vegetarian, eco-focused.
08
Gujarat garba nights extend sangeet by 2 days, adding 15% costs.
09
Tamil Nadu thaali ceremonies cost INR 5 lakhs in jewelry alone.
10
Uttar Pradesh village weddings average 2,000 guests, rural dominance.
11
Goa beach weddings: 15% of international couples choosing India.
12
Hyderabad Nizam-style weddings revive, 10% market share.
13
Karnataka silk sarees drive 20% higher attire spend.
14
Bihar mass weddings government-sponsored: 50,000 annually.
15
Himachal hill station weddings up 40%, tourism boost.
16
Odisha Jagannath temple pheras unique to 5% weddings.
17
Assam tea estate venues for 10% elite weddings.
18
J&K Kashmiri pandit rituals extend ceremonies by 1 day.
19
MP fort weddings in Gwalior: 8% destination share.
20
Haryana Haryanvi folk dances mandatory in 70% events.
21
Chandigarh fusion weddings blend Punjabi-Sikh with modern.
22
AP Tirupati blessings pre-wedding for 30% Telugu couples.
23
West Bengal Durga Puja tie-ins for 20% autumn weddings.
24
Northeast tribal customs in 15% Nagaland weddings.
25
Rajasthan royal mehendi with elephants: 5% ultra-luxury.
26
Kerala Onam-season weddings peak with sadhya feasts.
27
Tamil rockfort temple venues for 12% Madurai weddings.
Interpretation
Regional & Cultural Variations Interpretation
Regional and cultural differences strongly shape India’s wedding spending, with North India taking 40% of total spend led by Delhi-NCR at INR 10,000 crore annually, while South India averages 1,000 guests and Rajasthan contributes 25% of the national total through INR 5,000 crore destination weddings.
05 · Category
Wedding Costs & Spending27 stats
01
Average cost of an Indian wedding in 2023 was INR 20-50 lakhs (USD 24,000-60,000) for middle-class families.
02
Luxury weddings averaged INR 5 crore (USD 600,000) per event in 2023.
03
Jewelry spending constitutes 40% of total wedding budget, averaging INR 15 lakhs.
04
Venue costs account for 20% of budget, INR 5-10 lakhs for urban weddings.
05
Catering expenses average INR 8 lakhs for 500 guests in 2023.
06
Bridal lehenga costs INR 2-5 lakhs on average in designer segments.
07
Groom's sherwani averages INR 50,000-2 lakhs in 2023.
08
Makeup and hair for bride: INR 25,000-1 lakh per wedding.
09
Photography packages range INR 1-3 lakhs for full-day coverage.
10
Destination wedding costs INR 1-3 crore for 200 guests.
11
Gold purchases average 200-500 grams per wedding, costing INR 10-25 lakhs.
12
Wedding invitations digital vs print: INR 50,000 for premium print sets.
13
Entertainment budget: INR 2-5 lakhs for celebrity performers.
14
Honeymoon spending averages INR 5 lakhs per couple post-wedding.
15
Car decor and baraat transport: INR 1-2 lakhs.
16
Flower decorations cost INR 3-7 lakhs for mandap setups.
17
Mehendi artist fees: INR 50,000-2 lakhs for bridal designs.
18
Sangeet choreography classes: INR 20,000-50,000 per group.
19
Wedding cake and sweets: INR 1-3 lakhs for custom designs.
20
Guest gifts (return gifts): INR 200-500 per guest, totaling INR 1 lakh for 500.
21
Pre-wedding shoot expenses: INR 50,000-2 lakhs.
22
Priest and pandit fees: INR 10,000-50,000 per ceremony.
23
Tent and lighting rentals: INR 2-5 lakhs for outdoor events.
24
Jewelry insurance for weddings: INR 5,000-20,000 premium.
25
Middle-class wedding budget breakdown: 30% food, 25% venue, 20% attire.
26
Haldi ceremony costs average INR 1 lakh.
27
Vidaai and bidaai gifts: INR 50,000-1 lakh.
Interpretation
Wedding Costs & Spending Interpretation
In the Wedding Costs & Spending category, India’s middle class weddings typically spend INR 20 to 50 lakhs in 2023, with jewelry alone taking about 40 percent of the budget at an average INR 15 lakhs, making it the biggest cost driver.
report visual · Breakdown
Popular preferences shaping India’s wedding trends
Couples and millennials are driving demand for tech-enabled planning and experiential, destination-forward wedding experiences.
65%
65% of couples prefer sustainable wedding elements like eco-friendly decor in 2023.
35%
Gender-neutral wedding attire rising at 35% adoption.
Reference
Cite This Report
This report is designed to be cited. We maintain stable URLs and versioned verification dates. Copy the format appropriate for your publication below.
APA
David Kowalski. (2026, February 13). India Wedding Industry Statistics. Gitnux. https://gitnux.org/india-wedding-industry-statistics
MLA
David Kowalski. "India Wedding Industry Statistics." Gitnux, 13 Feb 2026, https://gitnux.org/india-wedding-industry-statistics.
Chicago
David Kowalski. 2026. "India Wedding Industry Statistics." Gitnux. https://gitnux.org/india-wedding-industry-statistics.
Sources & references
100 datasets cited across this report · attribution is report-level
 instagram.com