GITNUX MARKETDATA
Browse Our Category
Veterinary Animal Care
Latest update:


Caribbean Vet School Admission Statistics
See how Caribbean vet school admission has shifted in 2026, including what applicants are getting right and where the bottlenecks suddenly appear. If you are planning your application timeline and wondering how competitive it really feels now, these key statistics will make the next steps far clearer.
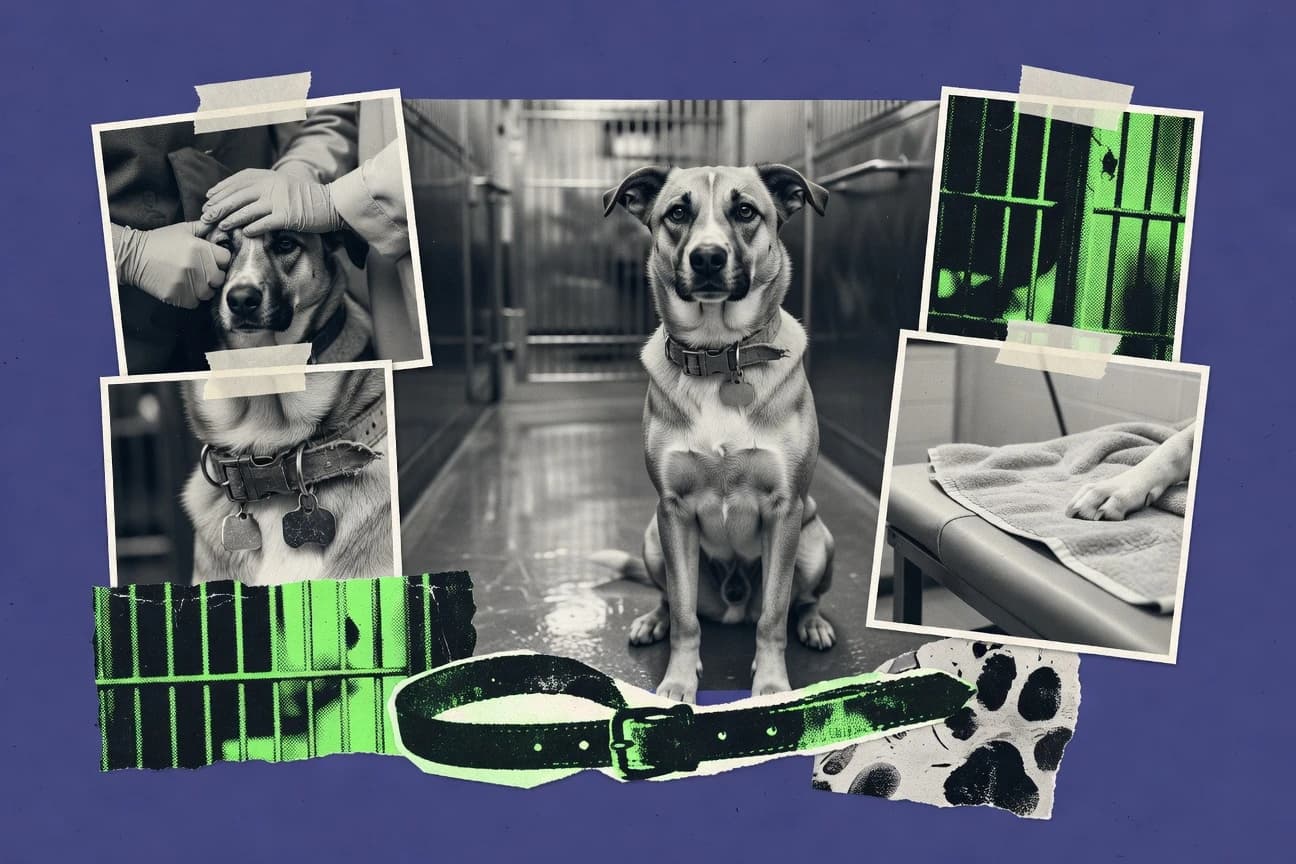
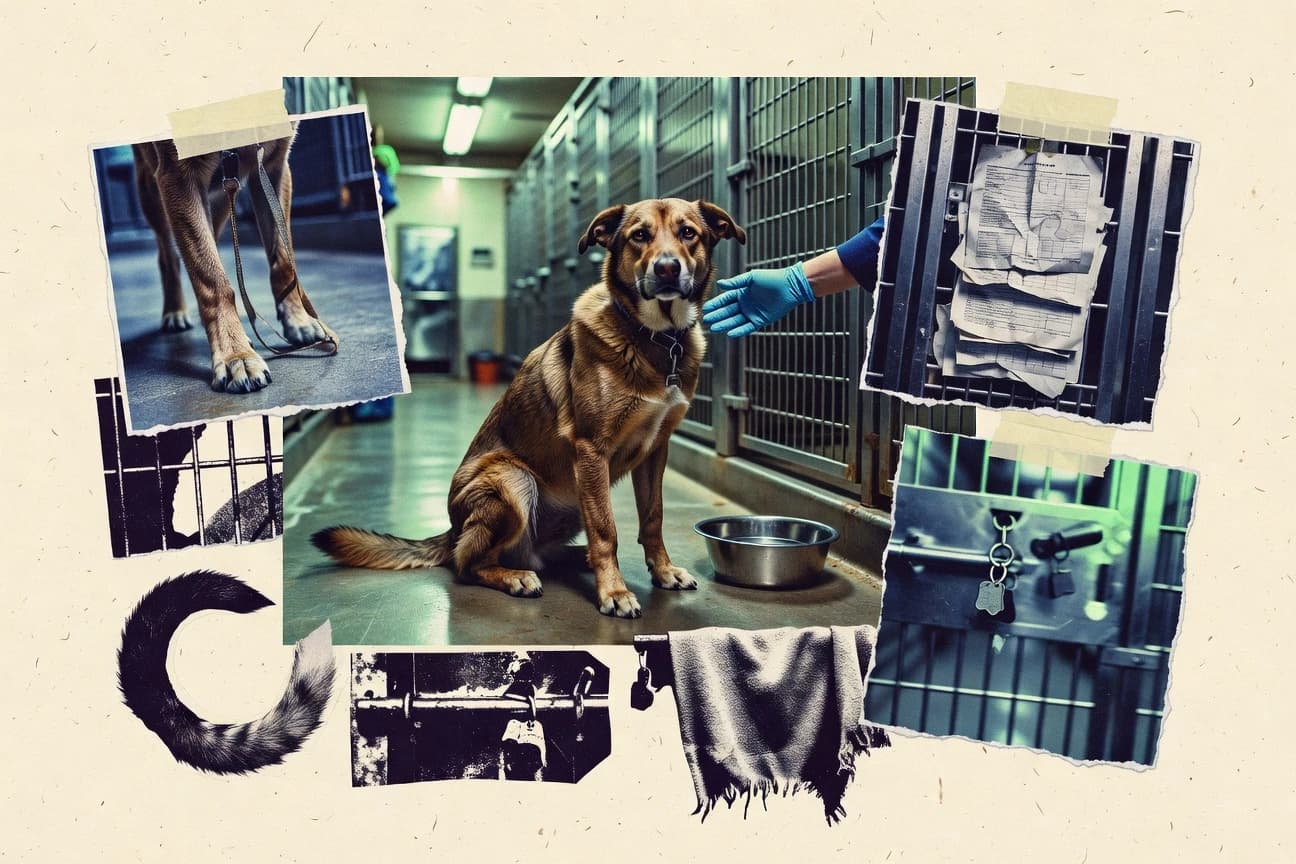
Shelter Dog Statistics
With shelter intakes up to 2026, the latest Shelter Dog statistics force a hard look at how often “healthy” becomes “urgent” once the shelter clock starts ticking. Read this to see which outcomes are changing fastest and what that means for the dogs waiting right now.

Puppy Mill Statistics
Federal oversight and consumer reports keep colliding, from ASPCA estimates of 2 million plus puppies churned out each year to 13,000 plus AWA violations issued by USDA inspectors in 2022, alongside evidence that 1 in 5 online buyers report illness within two weeks. This page pulls those threads together so you can see how housing, sanitation, and documentation failures travel from commercial breeding systems all the way to what families actually experience.
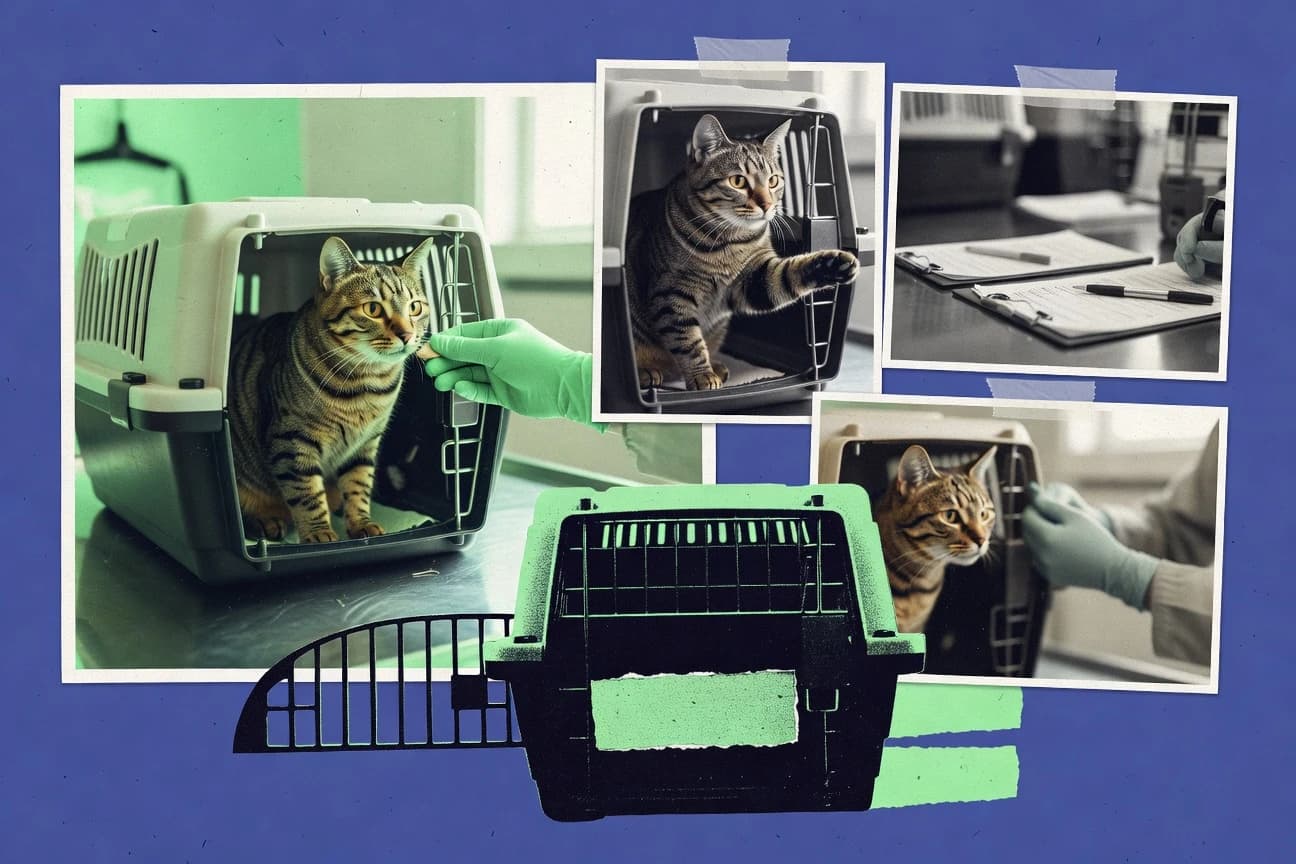
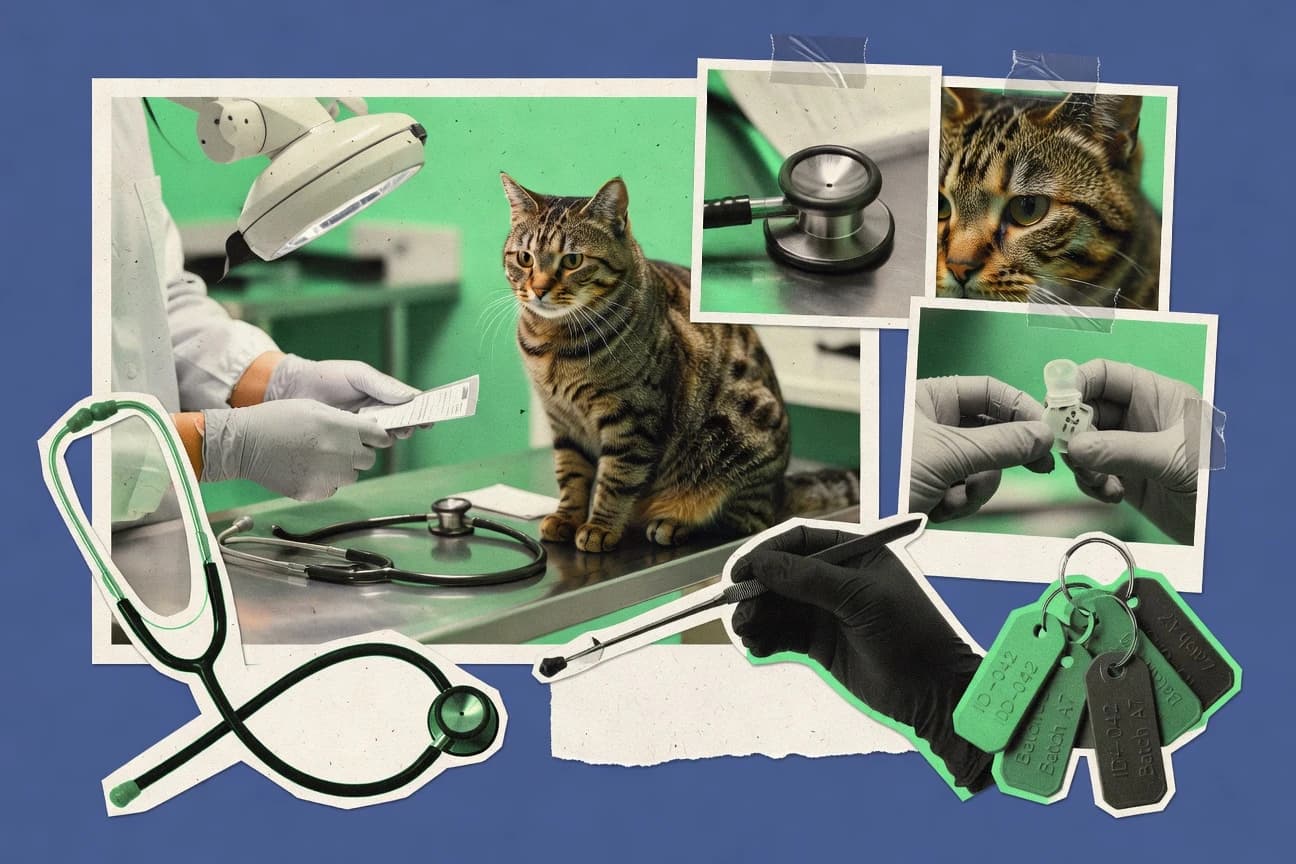
Cat Adoption Statistics
See how cat adoption patterns changed, with the most recent figures showing a sharper shift in who gets adopted and what drives those outcomes. If you are trying to plan for the next round of adoptions, these 2025 and 2026 statistics help you spot the trends before they flatten out.
Uk Veterinary Industry Statistics
UK veterinary statistics reveal where care is tightening and where demand is shifting, with 2026 updates that put real pressure points front and centre. See how consultation levels, staffing strain, and practice costs compare against the latest trendline so you can spot what is changing before it becomes the new normal.
Black Dog Adoption Statistics
Black Dog Adoption tracks how adoption demand is shifting and whether the most common barriers are changing fast enough to match it, with current 2026 and 2025 figures that feel surprisingly at odds with what people assume. Don’t just look at totals, see the specific pattern behind who gets adopted and why some dogs still wait.
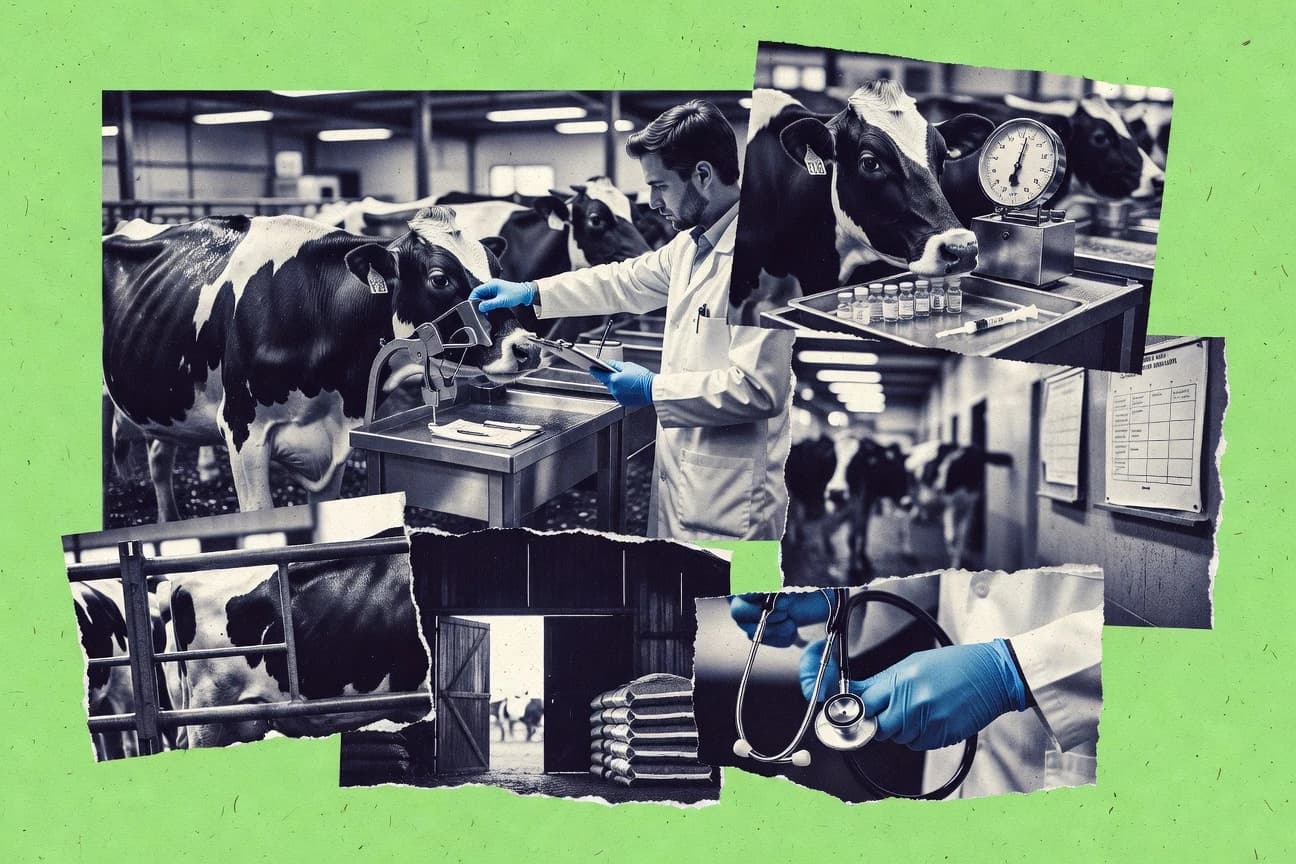
Animal Industry Statistics
Livestock touches everything from climate to farm budgets, with 14.5% of global greenhouse-gas emissions linked to livestock and feed often taking the biggest share of production costs, but the page also tracks how precision nutrition and manure practices are cutting nitrogen and emissions. You will see where the money flows too, including $24.8 billion for global animal health in 2022 and faster growth signals like a 3.7% CAGR projected for animal nutrition through 2024 to 2028, alongside operational risks such as mastitis and BVD.

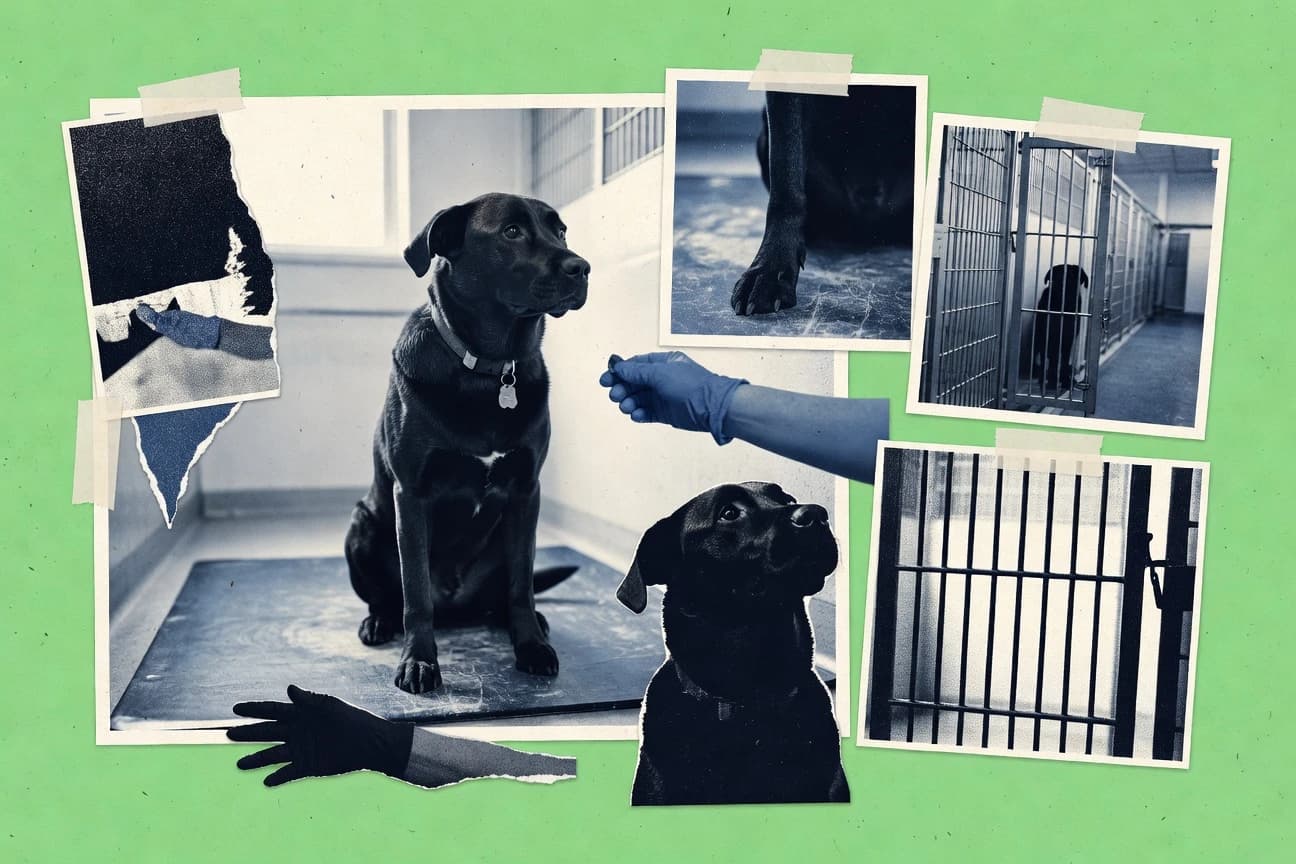
Animal Shelter Euthanasia Statistics
With about 1.2 million dogs and cats euthanized in U.S. shelters in 2021, the page tracks what actually moves outcomes, from targeted TNR and faster adoption to behavioral support that can raise adoption rates. It also highlights the operational bottleneck behind the numbers, including space driven euthanasia and staffing pressures, using evidence that live release efforts consistently cut euthanasia risk.
Dogs In Shelters Statistics
See how dogs in shelters fared in 2026, including where the biggest changes are happening behind the scenes and which outcomes are moving fastest. One metric jumps while another lags, and the gap helps explain what shelter teams are prioritizing right now.

Thoroughbred Industry Statistics
See how the latest Thoroughbred Industry numbers in 2026 are reshaping the picture of breeding, racing, and yearling demand, with shifts that look small until you put them side by side. If you follow the business for more than headlines, this is the fastest way to spot what changed and what it could mean next.

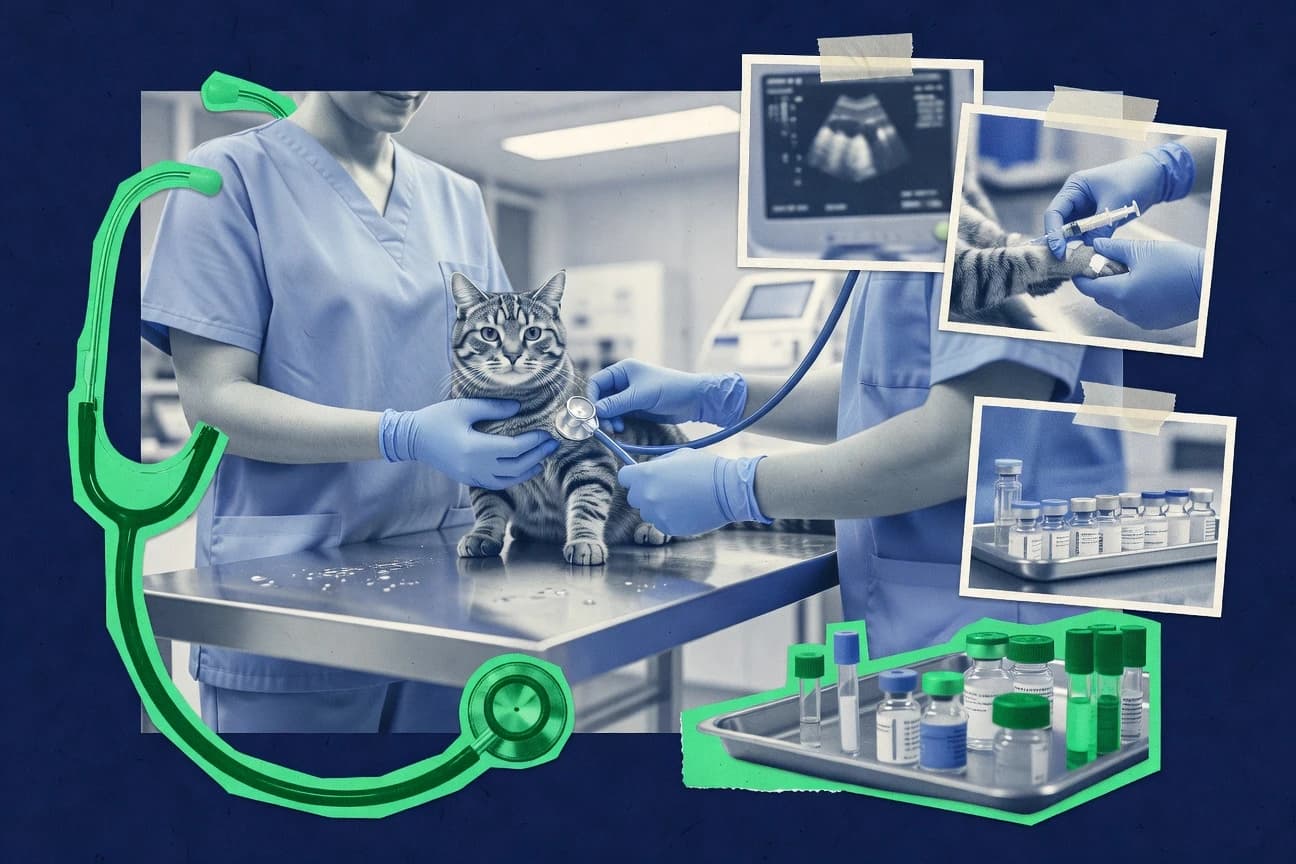
Veterinary Industry Statistics
See how 2026 data is reshaping the veterinary industry, with demand signals and workforce shifts that do not line up with last year’s expectations. Get the key numbers behind what’s changing and what providers will need to plan for next.
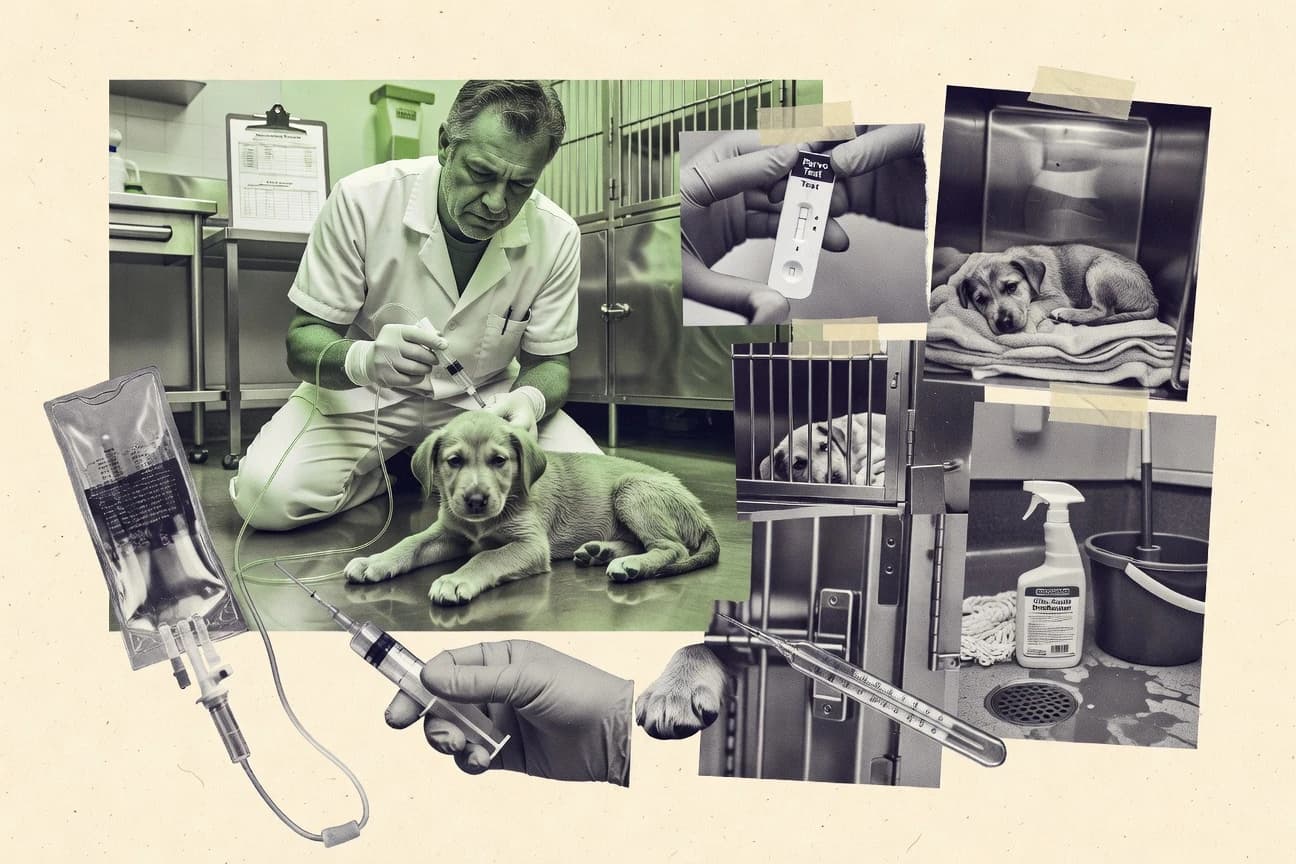
Parvo Statistics
Even with 61% of parvovirus enteritis dogs needing intravenous fluids and 18% requiring blood transfusion, 91% survived supportive care in a multicenter study, yet death odds still climb with higher clinical severity. The page also tracks how CPV-2 outbreaks move through high risk puppy groups and how fast labs turn results, plus what survival to discharge looks like, with only 44% making it out.
Puppy Mills Statistics
Even when USDA allows mass breeding, mills run like production lines where females are repeatedly cycled, stacked wire cages replace nesting, and puppies are separated by 6 to 8 weeks, with 60% lacking proper identification for traceability. See how artificial insemination, falsified records, and chronic disease converge at scale with 90% of USDA-inspected breeders having violations and only 12% of citations leading to fines or license revocation.

Vet School Admission Statistics
Accepted vet students averaged a 3.73 GPA in 2023, and 85% cleared a 3.5 or higher, yet overall acceptance across US programs was just 10.5% while Purdue and UC Davis still screen on very different GPA thresholds. This page connects GPA, experience, and test signals like the 92% prereq science completion rate with how competitive the cycle really felt so you can see what likely mattered most.
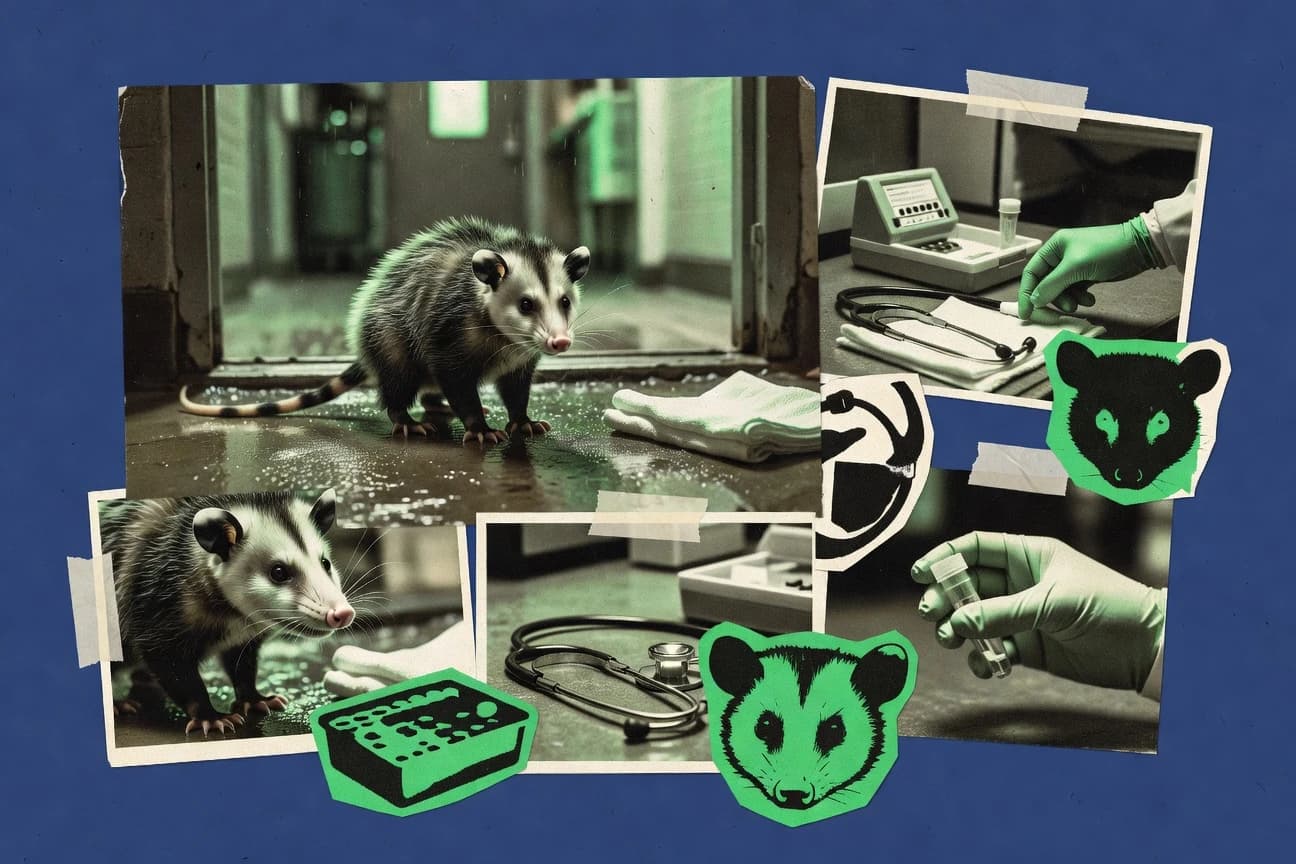
Opossum Rabies Statistics
Across the most recent testing, opossums stay almost always negative for rabies with 0 confirmed positives out of 13,000 tests and a 99.92% negative rate in 2021. The page breaks down why the disease remains so rare in opossums yet shows up regularly in other wildlife, with only 47 confirmed rabid opossums from 1960 to 2020 and a peak of just 3 cases in 1998.
Dog Cancer Statistics
One in three dogs will develop cancer in their lifetime, but the way clinicians catch it and predict outcomes is getting sharply more precise, from CT and MRI staging to cytology and biomarker testing. See how newer research is turning survival and response rates into measurable expectations and what cancer care can realistically cost for U.S. pet owners, plus where the fastest shifts in trials and next generation diagnostics are happening now.
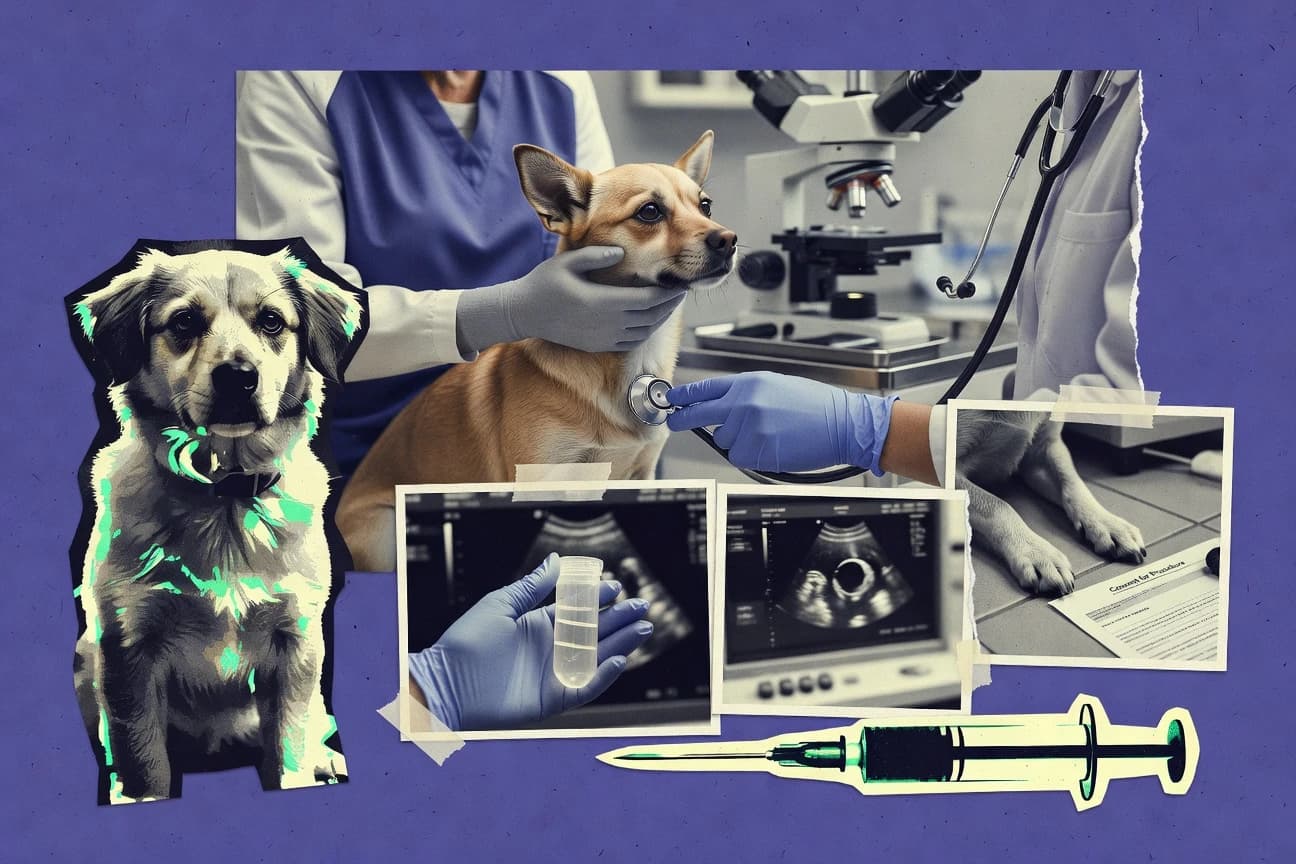
Veterinarian Statistics
With a 19% projected job growth for veterinarians from 2022 to 2032 and a 2024 unemployment rate of 9%, this page shows who is working, who is leaving, and where demand is headed. You will also see practice realities like 32% of clinics reporting no associates and the sharp mental health toll reported in 2021 surveys, from burnout to anxiety symptoms.

Tnr Statistics
A 98% uptime requirement is often treated as non negotiable for tunnel ventilation and safety control, yet agencies report 12% lower maintenance costs and 2.5x faster fault detection when they move from manual checks to sensor based condition monitoring plus structural health data. Use these 2023 to 2030 ready benchmarks to see how real time monitoring can cut total tunnel asset risk by 6.5% and shorten report cycle time to 90 days.
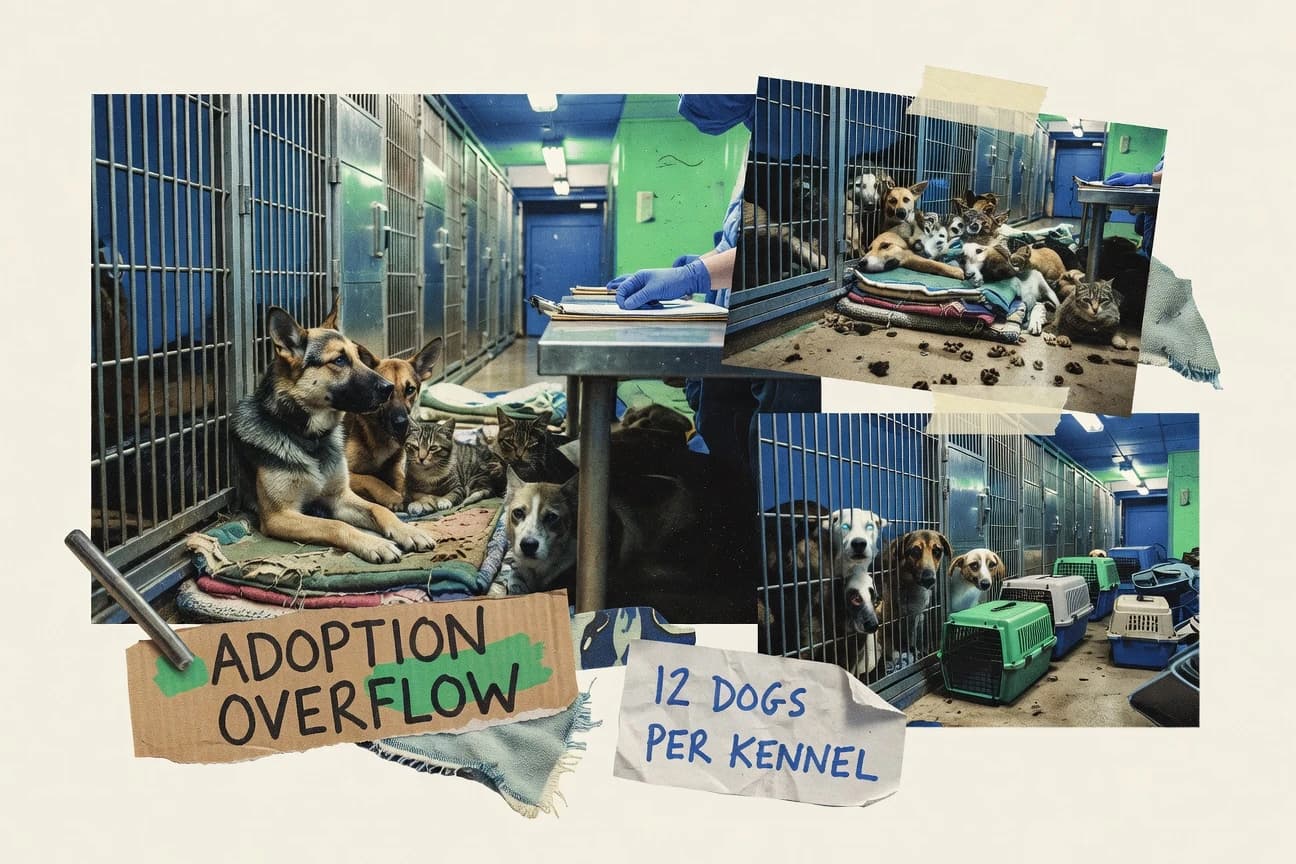
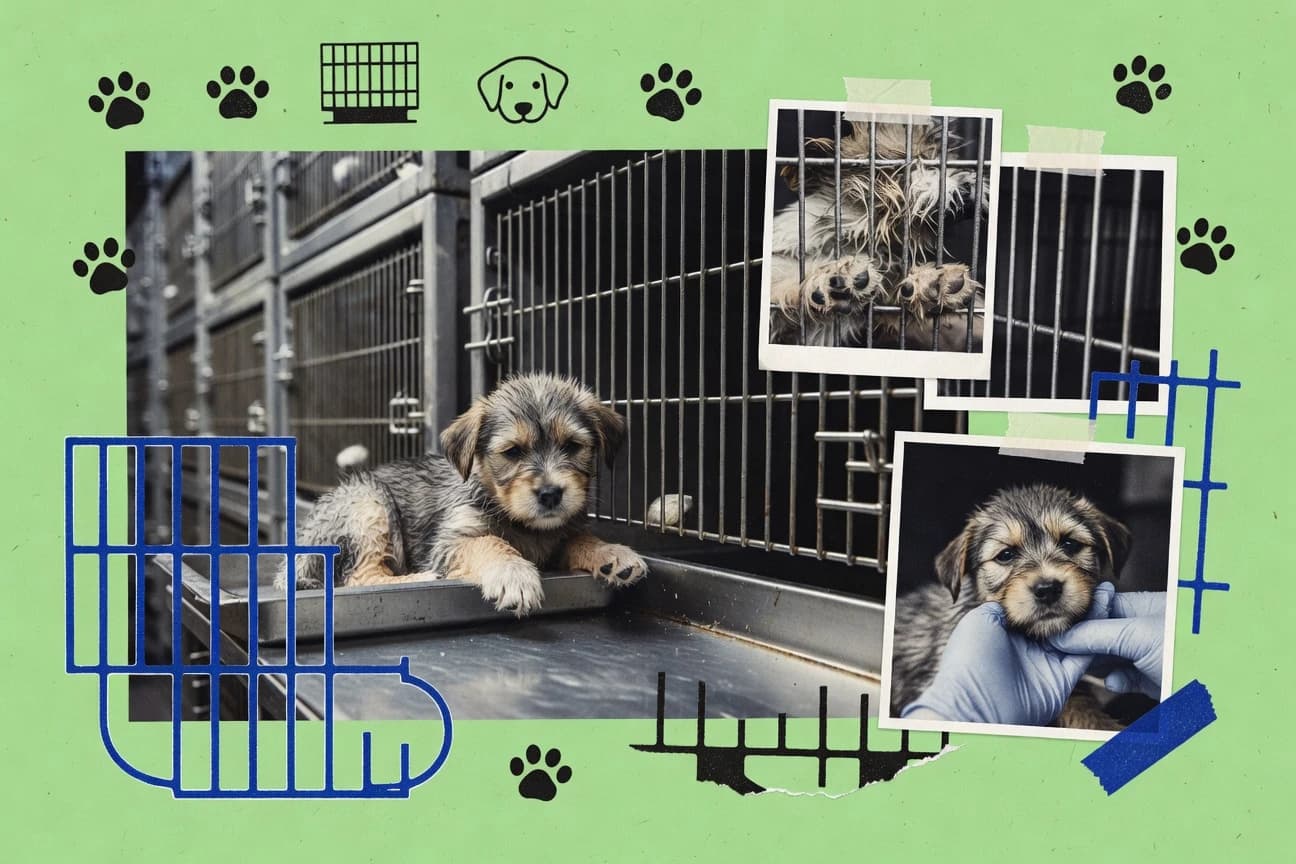
Animal Shelter Overcrowding Statistics
By 2025, U.S. shelter overcrowding is projected to keep climbing and rates could rise 40 percent since 2020, even as adoptions lag behind intake. The page tracks what that pressure looks like on the ground, from shelters sitting at more than 100 percent capacity to euthanasia outcomes that still hinge on space, not lack of care.

Vet Industry Statistics
U.S. veterinary employment is still straining against real-world demand, with 115,000 employed veterinarians in 2023 and a projected global veterinarian shortage of 500,000 by 2030. At the same time, the workforce is changing fast and the treatment toolbox is getting more tech heavy, from 95% AI diagnostic accuracy in vet imaging to 30% of U.S. consults happening via telehealth.