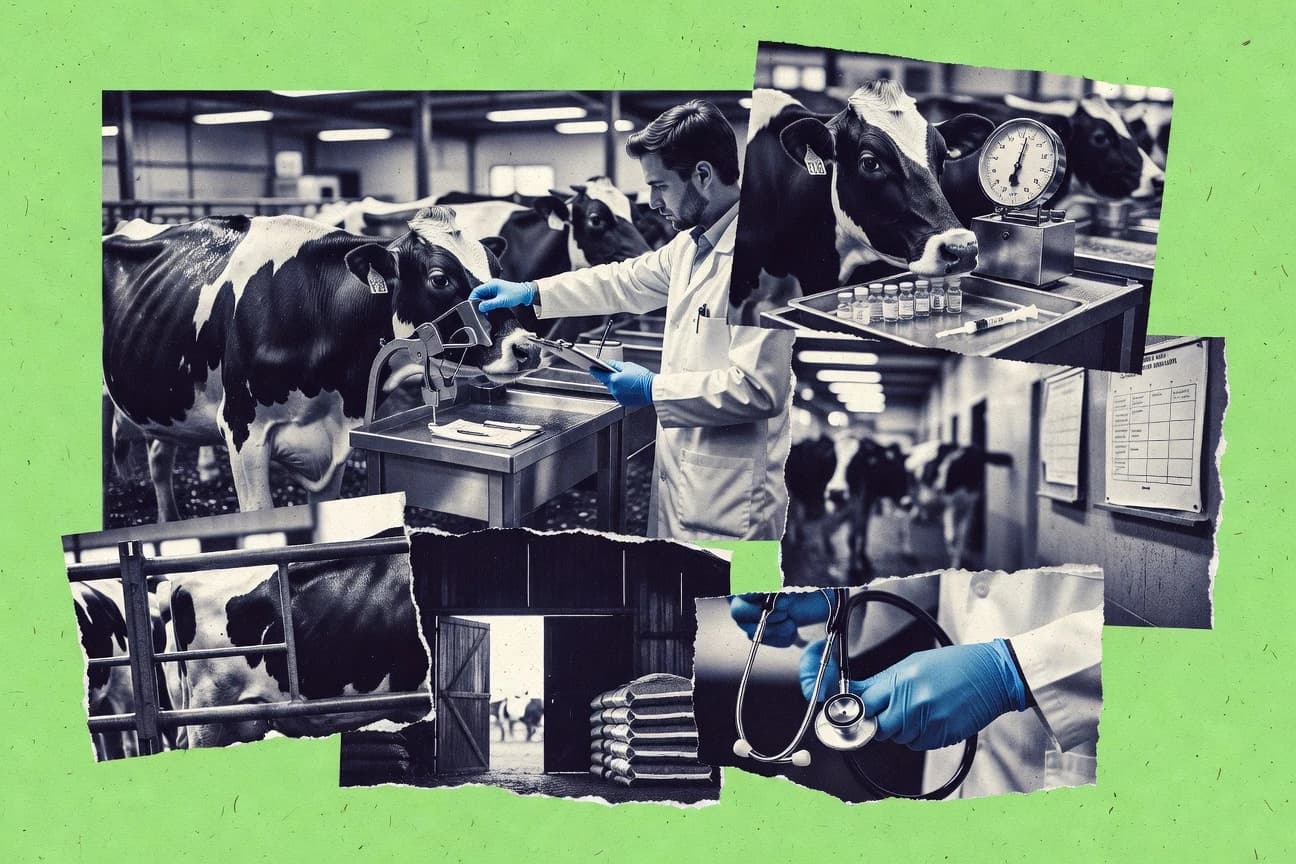

Livestock supply chains sit at the intersection of climate pressure and on-farm economics, with livestock responsible for 14.5% of global greenhouse-gas emissions. Agriculture also accounts for 52% of anthropogenic methane emissions, including emissions from enteric fermentation and manure management. Recent market sizing reinforces the stakes for feed, health, and productivity, including a $18.2 billion global veterinary medicines market in 2023.
Key Takeaways
- 14.5% of global greenhouse-gas emissions come from livestock (median estimate), 2015
- 52% of global anthropogenic methane emissions are from agriculture, including enteric fermentation and manure management for livestock (share reported for agriculture in methane emissions inventories)
- 1.3 billion tonnes of food are wasted globally per year, representing a portion of upstream animal feed and production losses
- In 2022, global soybean production was 364 million tonnes, a key protein meal feed ingredient (FAOSTAT oilseeds production)
- 6.7% of global GDP is spent on food, and livestock-related food represents a major share of food expenditure (World Bank/FAO synthesis on food expenditure structure)
- $24.8 billion global animal health market in 2022 (same analyst dataset; year-over-year TAM figure)
- In 2023, US farm cash receipts from livestock and dairy totaled $143.2 billion (USDA ERS or NASS receipts summary in Livestock and Dairy report)
- In 2022, global poultry meat production exceeded 98 million tonnes, driven by high feed conversion efficiency relative to other livestock meats.
- In 2023, WHO reported that influenza A(H5N1) outbreaks affected multiple countries, reinforcing surveillance costs and productivity risk for poultry sectors.
- A study of dairy herds reported that lameness prevalence averaged 23% across participating farms, which is directly tied to reduced milk yield and increased culling risk.
- In 2022, the global dairy market size was $573.3 billion, reflecting demand for milk and related products sourced from livestock.
- Global cattle meat trade exceeded 11 million tonnes (carcass weight equivalent) in 2022, showing durable cross-border demand for ruminant meat.
- The global animal health market reached $24.8 billion in 2022.
- The global veterinary medicines market reached $18.2 billion in 2023.
- The global animal vaccines market reached $31.4 billion in 2023.
Livestock systems shape climate, food demand, and animal health markets, with growing adoption of feed and mitigation innovations.
Related reading
01 · Category
Industry Trends5 stats
01
14.5% of global greenhouse-gas emissions come from livestock (median estimate), 2015
02
52% of global anthropogenic methane emissions are from agriculture, including enteric fermentation and manure management for livestock (share reported for agriculture in methane emissions inventories)
03
1.3 billion tonnes of food are wasted globally per year, representing a portion of upstream animal feed and production losses
04
1.56 billion people, roughly 20% of the world’s population, rely on livestock for their livelihoods (FAO/ILRI figure cited for 2019-era assessments)
05
3.7% compound annual growth rate (CAGR) projected for global animal nutrition market for 2024–2028 (industry analyst projection)
Interpretation
Industry Trends Interpretation
The biggest industry trend is that livestock is both a major climate driver and a growing market focus, with 14.5% of global greenhouse gas emissions and 52% of anthropogenic methane coming from agriculture plus livestock-related feed losses that add up to 1.3 billion tonnes of wasted food each year.
02 · Category
Market Size8 stats
01
In 2022, global soybean production was 364 million tonnes, a key protein meal feed ingredient (FAOSTAT oilseeds production)
02
6.7% of global GDP is spent on food, and livestock-related food represents a major share of food expenditure (World Bank/FAO synthesis on food expenditure structure)
03
$24.8 billion global animal health market in 2022 (same analyst dataset; year-over-year TAM figure)
04
$18.2 billion global veterinary medicines market in 2023 (industry analyst reported market sizing for veterinary medicines)
05
$31.4 billion global animal vaccines market in 2023 (industry analyst reported market sizing for animal vaccines)
06
6.1% year-over-year growth in global poultry meat production to reach 111.3 million tonnes in 2023, according to OECD-FAO Agricultural Outlook baseline projections.
07
$46.3 billion global aquaculture feeds market size in 2023, reflecting rapid expansion of feed demand tied to animal protein farming.
08
$29.9 billion global veterinary diagnostics market size in 2023 (lab and point-of-care diagnostics), indicating investment in animal health testing capacity.
Interpretation
Market Size Interpretation
The market size data points to strong and growing demand across Animal Industry, with global animal health at $24.8 billion in 2022, veterinary medicines rising to $18.2 billion in 2023, animal vaccines reaching $31.4 billion in 2023, and poultry meat production climbing 6.1% year over year to 111.3 million tonnes in 2023.
03 · Category
Cost Analysis1 stats
01
In 2023, US farm cash receipts from livestock and dairy totaled $143.2 billion (USDA ERS or NASS receipts summary in Livestock and Dairy report)
Interpretation
Cost Analysis Interpretation
In 2023, US farm cash receipts from livestock and dairy totaled $143.2 billion, underscoring the large scale of revenue that animal producers must effectively manage within cost analysis to sustain profitability.
04 · Category
Health & Productivity5 stats
01
In 2022, global poultry meat production exceeded 98 million tonnes, driven by high feed conversion efficiency relative to other livestock meats.
02
In 2023, WHO reported that influenza A(H5N1) outbreaks affected multiple countries, reinforcing surveillance costs and productivity risk for poultry sectors.
03
A study of dairy herds reported that lameness prevalence averaged 23% across participating farms, which is directly tied to reduced milk yield and increased culling risk.
04
A global review found that mastitis affects about 20–25% of dairy cows at any time, with substantial productivity losses.
05
In 2023, global trade in live animals and animal products reached $200+ billion, indicating broad market exposure to animal health and biosecurity constraints.
Interpretation
Health & Productivity Interpretation
Across Health and Productivity, the data show that disease and welfare issues already impose major losses at scale, with mastitis hitting about 20–25% of dairy cows and lameness averaging 23% of herds while global poultry production tops 98 million tonnes and is therefore highly sensitive to outbreaks like H5N1 that raise surveillance and productivity risk.
05 · Category
Production & Trade2 stats
01
In 2022, the global dairy market size was $573.3 billion, reflecting demand for milk and related products sourced from livestock.
02
Global cattle meat trade exceeded 11 million tonnes (carcass weight equivalent) in 2022, showing durable cross-border demand for ruminant meat.
Interpretation
Production & Trade Interpretation
In 2022, the Production and Trade side of the animal industry was clearly strong as the global dairy market reached $573.3 billion while global cattle meat trade surpassed 11 million tonnes, underscoring sustained cross border demand for livestock products.
06 · Category
Regulatory & Policy7 stats
01
The global animal health market reached $24.8 billion in 2022.
02
The global veterinary medicines market reached $18.2 billion in 2023.
03
The global animal vaccines market reached $31.4 billion in 2023.
04
In 2019, antimicrobial resistance caused an estimated 4.95 million deaths globally, a policy driver for veterinary antibiotic stewardship in animal production.
05
The World Organisation for Animal Health (WOAH) lists 117 diseases in its terrestrial animal health code scope (as of the latest consolidated code listings), guiding national veterinary regulation.
06
EU Regulation (EC) No 1831/2003 covers additives for use in animal nutrition, including authorized growth promoters and other regulated additives (policy foundation for nutrition-related practices).
07
The EU’s Regulation (EU) 2019/6 on veterinary medicinal products entered into application in 2022 for implementing rules on authorization and antimicrobial stewardship.
Interpretation
Regulatory & Policy Interpretation
Regulatory and policy forces are intensifying alongside rapid market growth, with the global veterinary medicines market reaching $18.2 billion in 2023 and animal vaccines $31.4 billion in 2023 while WOAH’s terrestrial code already covers 117 diseases and antimicrobial resistance drove an estimated 4.95 million deaths globally in 2019.
More related reading
07 · Category
Cost & Efficiency7 stats
01
Feed accounts for the largest share of livestock production costs, with typical estimates of ~50–70% depending on species and system design.
02
In a randomized field trial, probiotic supplementation improved broiler feed conversion ratio (FCR) by 4.2% relative to control under commercial conditions.
03
A meta-analysis reported that dietary phytase supplementation improved phosphorus digestibility by an average of 20–30%, reducing feed cost drivers tied to mineral inputs.
04
Automated milking systems (robotic dairying) can increase labor productivity by 20–40% per worker versus conventional milking routines, improving operating efficiency.
05
In 2023, global precision livestock farming (PLF) adoption increased by 25% year over year in surveyed farms, reflecting efficiency investments.
06
A systematic review found that vaccination programs can reduce herd mortality by 10–25% depending on disease burden and coverage.
07
A modeling study estimated that improved manure management can reduce ammonia emissions from livestock systems by up to 30% without major productivity losses, supporting cost-efficiency in mitigation investments.
Interpretation
Cost & Efficiency Interpretation
Feed remains the dominant cost driver at roughly 50 to 70% of livestock production costs, but targeted health and nutrition efficiency gains like a 4.2% better broiler FCR with probiotics and 20 to 30% improved phosphorus digestibility from phytase show how much savings can be unlocked within the Cost and Efficiency category.
08 · Category
Emissions & Climate1 stats
01
12.0% of all anthropogenic greenhouse-gas emissions come from the agricultural sector (including crops, livestock, and other land-based activities), 2010–2016 estimate range, measured as the median share reported by multiple peer-reviewed assessments.
Interpretation
Emissions & Climate Interpretation
In the Emissions and Climate category, agriculture contributes 12.0% of all anthropogenic greenhouse gas emissions, showing that animal-related production is a major driver of global climate impact.
09 · Category
Disease & Biosecurity3 stats
01
43% of surveyed farms reported attempting at least one specific biosecurity measure (e.g., visitor controls, disinfection, and quarantine) in a large commercial swine biosecurity survey, 2019.
02
6.3% of US broiler farms reported using all recommended biosecurity practices in a national survey dataset analyzed in a peer-reviewed study covering 2015–2017 operations.
03
4.2% of US dairy herds reported at least one clinical episode of bovine viral diarrhea (BVD) within a 12-month window in a national producer survey analysis, 2019.
Interpretation
Disease & Biosecurity Interpretation
Across Disease and Biosecurity efforts, only 6.3% of US broiler farms fully use all recommended practices and 43% of surveyed farms attempt at least one measure, while just 4.2% of US dairy herds report a BVD clinical episode within 12 months, suggesting widespread partial compliance alongside relatively lower observed disease reporting.
10 · Category
Demand & Trade2 stats
01
4.3% of US households used SNAP benefits in a given month as reported by USDA (administrative data), with livestock-derived foods forming a major share of food expenditure among beneficiaries (contextual demand driver).
02
86% of global poultry meat production is concentrated in Asia (share of production by region), reflecting structural demand and supply concentration in the OECD-FAO outlook regional tables (2022 baseline).
Interpretation
Demand & Trade Interpretation
Demand and Trade for animal products are shaped by broad consumer support and regional production shifts, with 4.3% of US households using SNAP in a month and with 86% of global poultry meat production concentrated in Asia.
11 · Category
Production Efficiency3 stats
01
20.5% reduction in nitrogen excretion when using a precision feeding strategy in dairy cattle (average across trials summarized in a meta-analysis), improving manure N capture potential.
02
11.2% reduction in greenhouse-gas intensity per unit of milk (kg CO2e/kg ECM) with forage-based diet optimization under pasture/mixed systems in a systematic review of dairy LCA studies.
03
1.6% average improvement in swine average daily gain (ADG) with phase feeding strategies in grow-finish systems, based on a meta-analysis of multiple randomized and observational studies.
Interpretation
Production Efficiency Interpretation
Across production efficiency measures, tailored nutrition strategies consistently improve outputs while reducing waste, with precision feeding cutting nitrogen excretion by 20.5% in dairy cattle, forage-based diet optimization lowering greenhouse-gas intensity by 11.2% per kg of milk, and phase feeding boosting swine average daily gain by 1.6% in grow-finish systems.
report visual · Comparison
How large livestock’s footprint is in key impact areas
Livestock accounts for a substantial share of greenhouse-gas emissions and a major portion of methane emissions linked to agriculture.
52% of global anthropogenic methane emissions are from agriculture, including enteric fermentation and manure management52%
14.5% of global greenhouse-gas emissions come from livestock (median estimate), 2015
14.5%
1.3 billion tonnes of food are wasted globally per year, representing a portion of upstream animal feed and production l
1.3
source-verifiedscience.org · ipcc.ch · fao.org2015
Reference
Cite This Report
This report is designed to be cited. We maintain stable URLs and versioned verification dates. Copy the format appropriate for your publication below.
APA
Felix Zimmermann. (2026, February 13). Animal Industry Statistics. Gitnux. https://gitnux.org/animal-industry-statistics
MLA
Felix Zimmermann. "Animal Industry Statistics." Gitnux, 13 Feb 2026, https://gitnux.org/animal-industry-statistics.
Chicago
Felix Zimmermann. 2026. "Animal Industry Statistics." Gitnux. https://gitnux.org/animal-industry-statistics.
Sources & references
44 datasets cited across this report · attribution is report-level
+20 additional datasets cited (not shown individually)