GITNUX MARKETDATA
Browse Our Category
Transportation Vehicles
Latest update:

Vietnam Auto Industry Statistics
EVs are still a small slice of new-car sales, with about 7% of new light-duty vehicle registrations in 2023, yet Vietnam’s market is already building serious momentum across charging capacity, components, and exports valued in the billions. The page pulls together the full drivetrain of policy and economics, from Euro 5 and E10 blending to fuel prices and the scale of registered vehicles, so you can see exactly where Vietnam’s auto industry is headed next.

Pickup Truck Industry Statistics
Pickup trucks still dominate US demand with 44.1% of all new light truck sales becoming pickups in 2023, yet the affordability squeeze is visible in the latest price and operating cost pressure, including a $1,150 average incentive per pickup in Q1 2024 and AAA’s $11,450 estimated annual cost to operate in 2024. If you want to understand why buyers are choosing pickups anyway, the page ties market momentum to fuel and safety realities, from $3.45 gasoline and $4.00 diesel averages to ADAS priorities among 17% of buyers and higher pickup involvement in occupant fatalities.

Carpooling Statistics
From US households saving $1,200 a year to billions in Europe and beyond kept out of tolls, fuel bills, and parking fees, Carpooling statistics turn “shared rides” into a measurable payback you can spot immediately. You will also see how carpool growth and safety policies are reshaping emissions and crash risk, with EU directives and local HOV systems pushing participation higher than ever.
Motor Industry Statistics
Electric cars are already 10.7% of global car sales, while the industry’s spending and risk curve keeps climbing, with $170 billion forecast for automotive cybersecurity by 2030 and $2.0 trillion announced for EV supply chain investment in 2023. Track how Europe’s 6.4 million auto manufacturing jobs and the US’s 770,000 automotive manufacturing workers intersect with hard cost pressures like $760/ton steel and $82 oil, plus tech adoption from ADAS in 22% of US vehicles to eCall activations reaching 10.4 million in the EU.

Public Transportation Statistics
Find out what it takes to keep people riding when demand is there but reliability decides the outcome, from 17.6% naming schedule and reliability as the top ridership driver to 54% saying they would use transit more if it improved. The page also tracks the shift toward electrified and smarter operations, including 6,000+ electrified buses across 21 U.S. systems, alongside the realities passengers feel most, like crowding.

Ship Industry Statistics
Shipping still carries about 90% of the world’s trade by volume but the 2025 outlook is what sharpens the focus, with UNCTAD projecting 2.4% growth in merchandise volumes and 2.8% in seaborne volumes alongside Asia’s 37% share of containerized trade moving through major hubs. From EEXI CII compliance surging past 80% of relevant ships and DCS fuel reporting exceeding 99% of applicable tonnage to fuel price spreads that can jump above $200 per metric ton under IMO 2020, this page connects policy, productivity, and cost pressure in a way you cannot see from any single KPI.

Brazil Motorcycle Industry Statistics
From urban crashes that account for 58% of motorcycle incidents to Euro 4 equivalent rules and a 10% drop in new-bike CO2 per km, Brazil’s motorcycle story is shifting fast. Financing risk sits at 3.2% NPL, prices are rising 8.7% year over year, and with electric two wheelers reaching a 2.1% share, this page connects safety, cost, and policy to explain where Brazil’s ride economy is headed next.
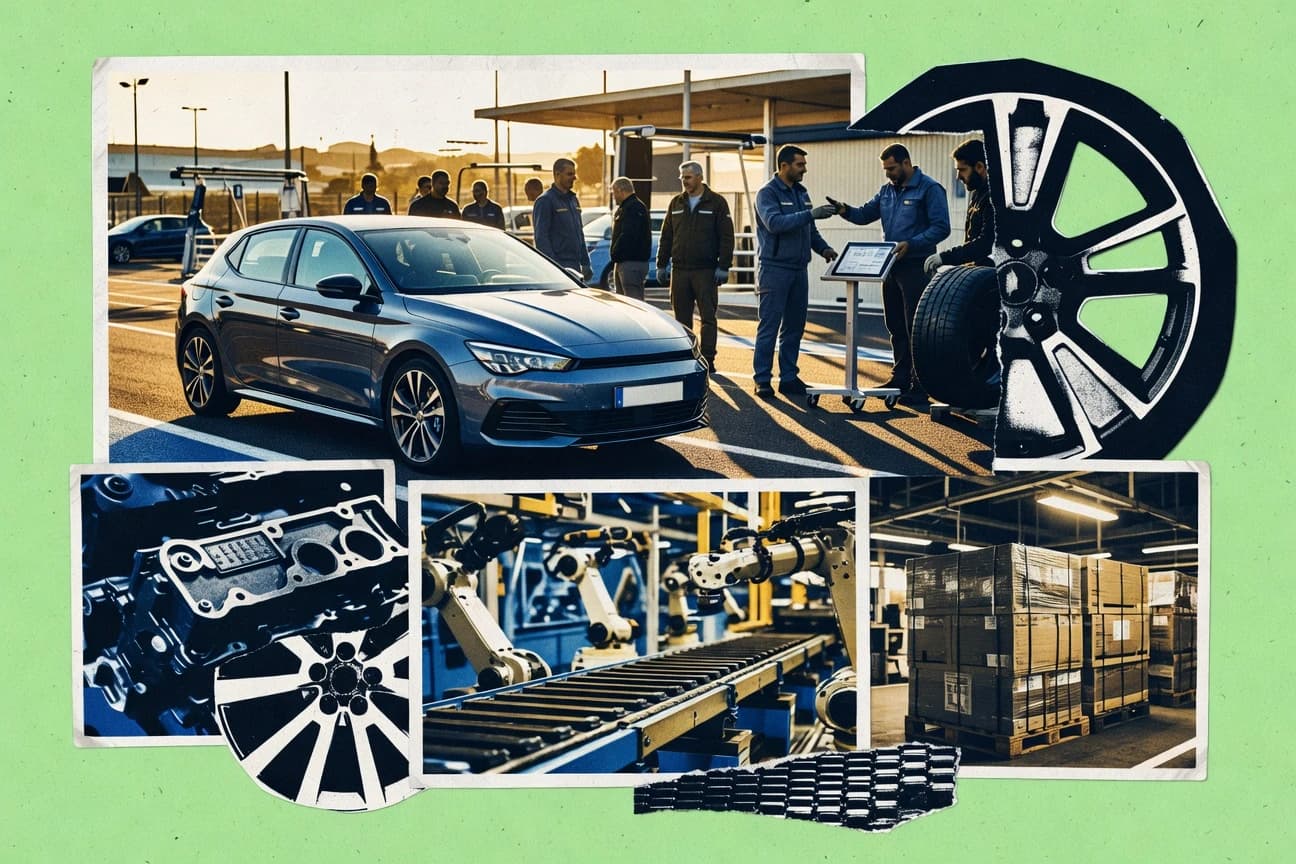
Spain Car Industry Statistics
Spain’s auto sector is still powering ahead with 2.96 million vehicles produced in 2023 and 98% of them finding buyers abroad, while jobs are shifting toward assembly, R and D, and logistics with 471,000 direct workers plus 1.2 million indirect roles in the supply chain. Track how workforce realities such as women up to 22% and temporary contracts at 25% sit alongside investment like €900 million for auto electrification and €800 million in circular economy projects, all while regional demand contrasts sharply from Valladolid’s 8.5% unemployment to plants like Martorell’s 13,000 employees.

Electric Boat Industry Statistics
Electric Boat’s throughput meets real-world friction, from 86% of complex submarine supply-chain elements coming from specialized global suppliers to a 45% share of major shipbuilding projects slipping because of integration and supply-chain issues. For operators and planners, the 2023 target of 12 SSBNs at sea at policy level and the cost and schedule impacts behind nuclear sustainment collide with modern industry signals like 19% lower rework from digital quality practices, workforce shortages, and energy intensity gains, showing exactly where procurement, labor, and delivery timelines are won or lost.

Semi Truck Industry Statistics
With 23.5% of USDOT inspected carriers getting placed out of service in 2023 for safety violations and 5.6% of roadside inspections leading to out of service violations for commercial motor vehicles, the enforcement pressure on semi truck operators is harder than ever to ignore. Pair that with diesel at about $4.00 a gallon and trucking revenue topping $123.7 billion in 2023, and you get a page that connects safety, maintenance, and cost drivers that shape fleet decisions week to week.

Boat Lift Industry Statistics
With corrosion and energy costs quietly reshaping every winch cycle, this page pulls together the most current pressure points for boat lift projects, including a 4.3% 2023 rise in US steel mill product prices that feeds directly into replacement and new-build fabrication. It also connects weather and safety realities, from 28 US billion-dollar disasters in 2023 to PLC repeatability expectations for electro-mechanical controls, so you can budget, specify, and harden marinas and ports with fewer surprises.
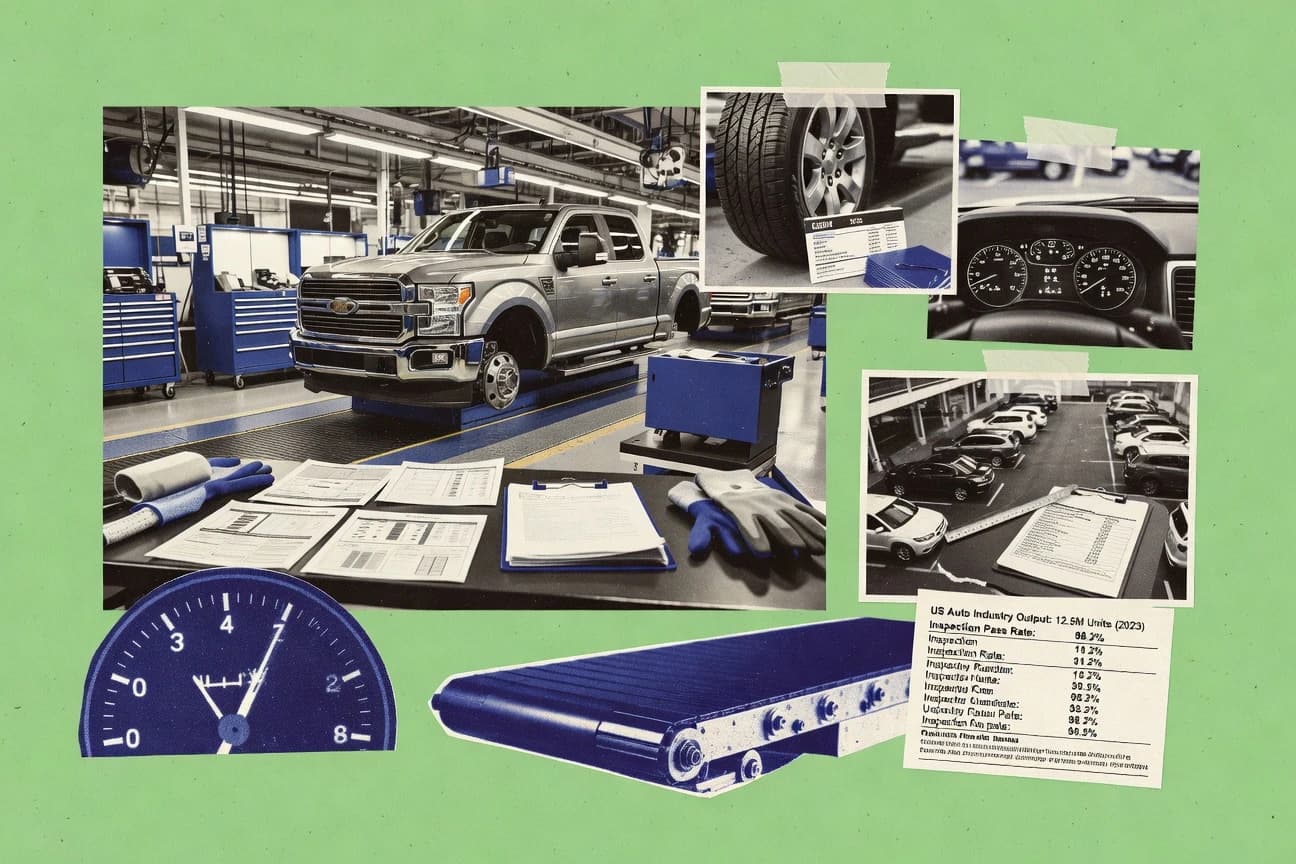
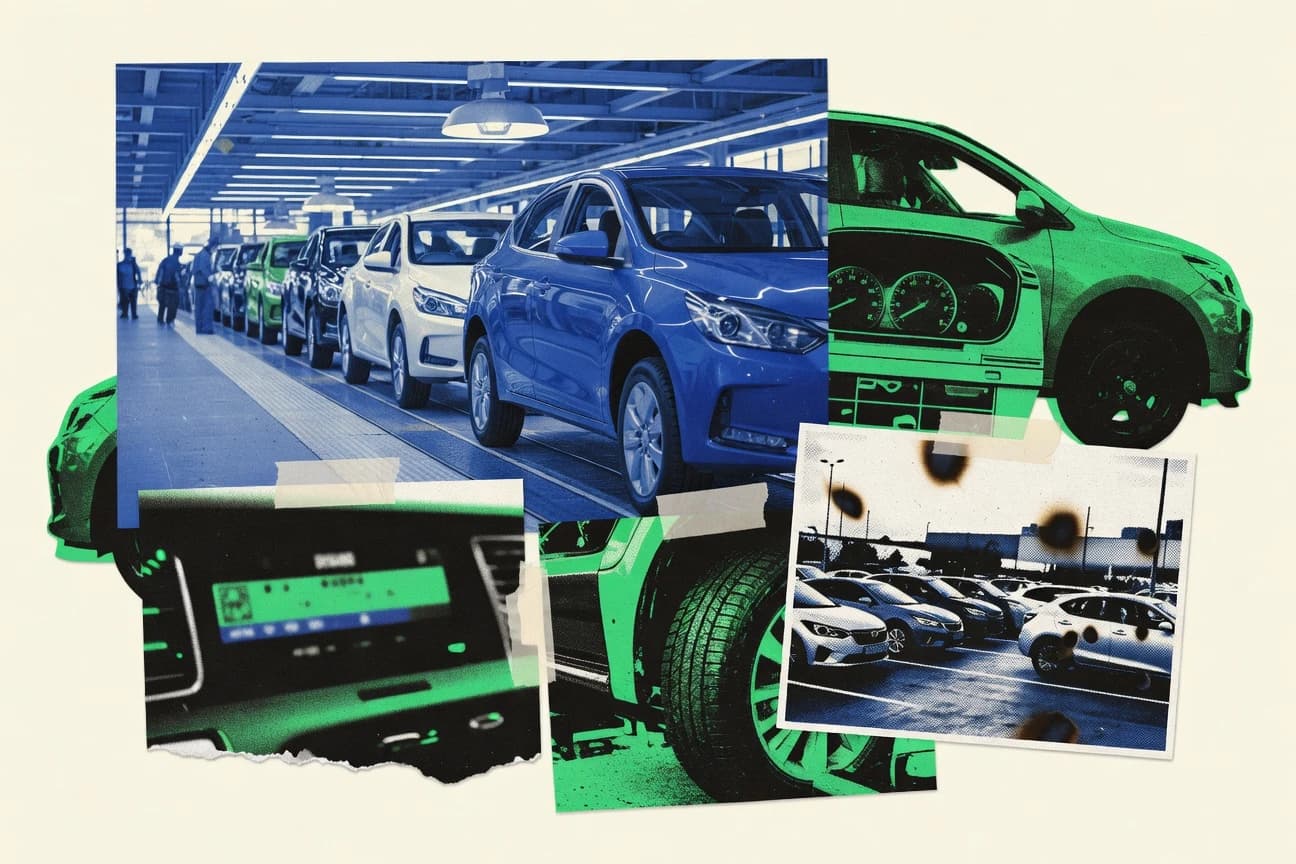
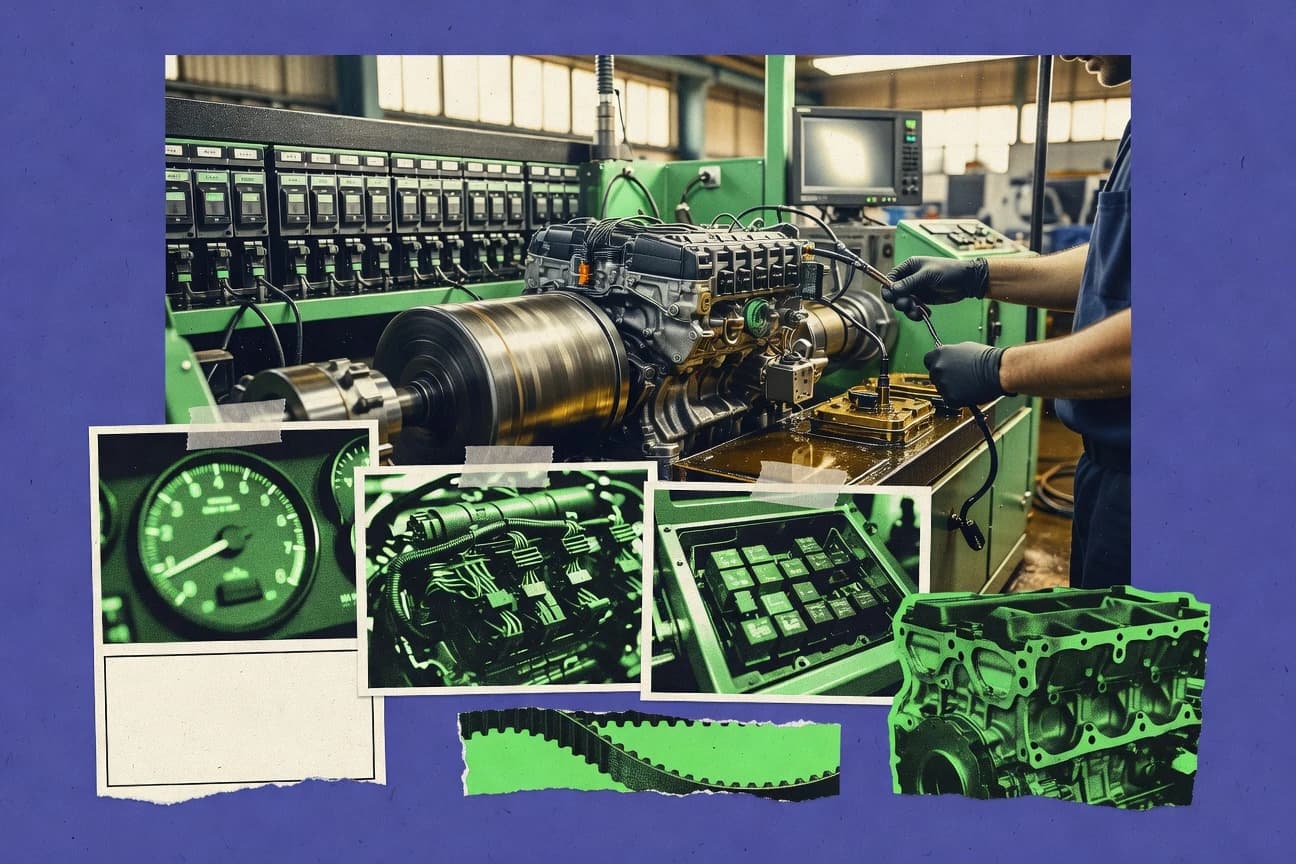
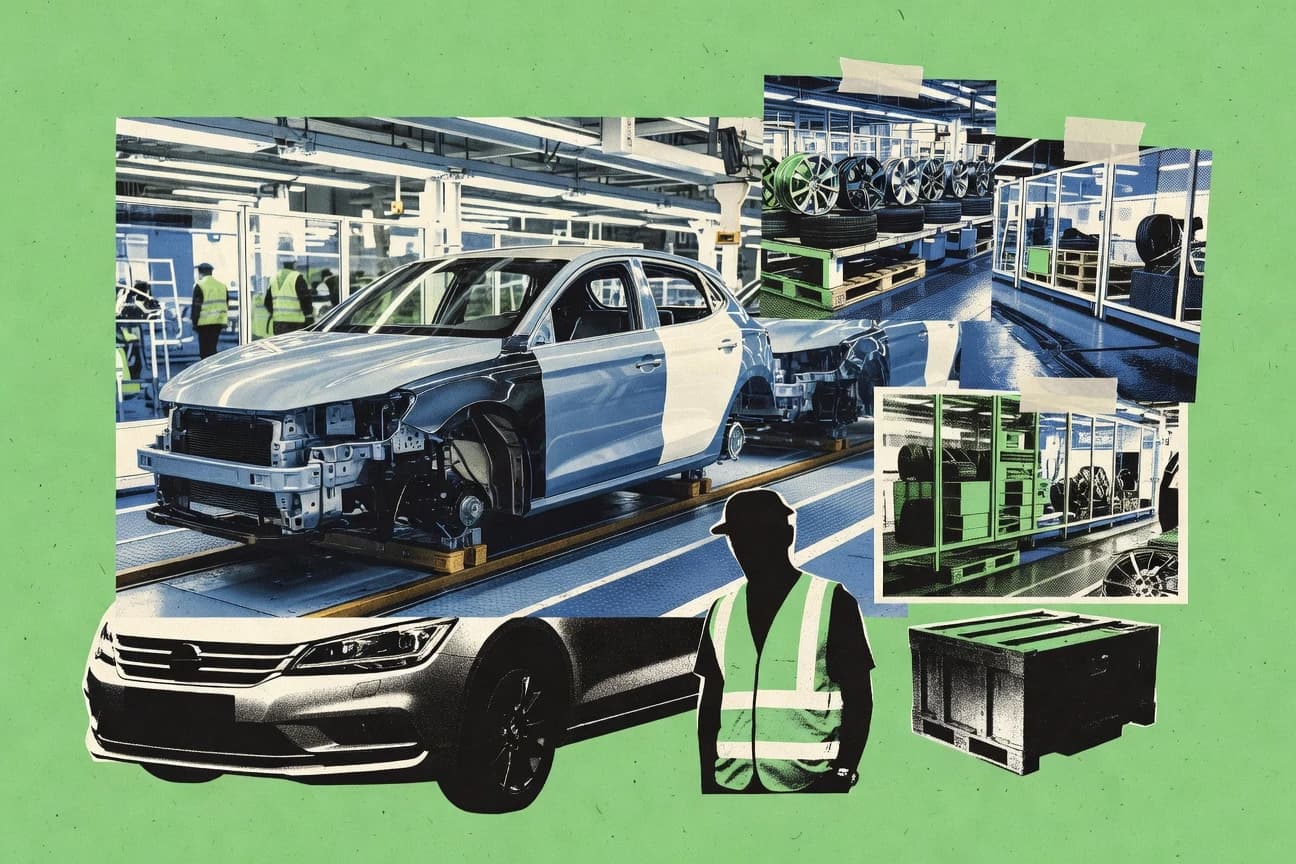
Us Auto Industry Statistics
With connected car services hitting $4.6 billion in revenue and the U.S. topping 1.2 million BEV plus PHEV sales, the EV shift is accelerating while public charging lags at 362,000 points. See how that squeeze plays out across pricing, employment, recalls, and even cybersecurity, with the automotive sector’s incidents up 25% in 2023.

Fishing Boat Industry Statistics
Track how Fishing Boat Industry performance is shifting with 2026 figures that reveal changing fleet costs, output, and safety pressures at the same time. The contrast between what operators are spending and what the market is delivering makes the case for decisions that cannot wait.
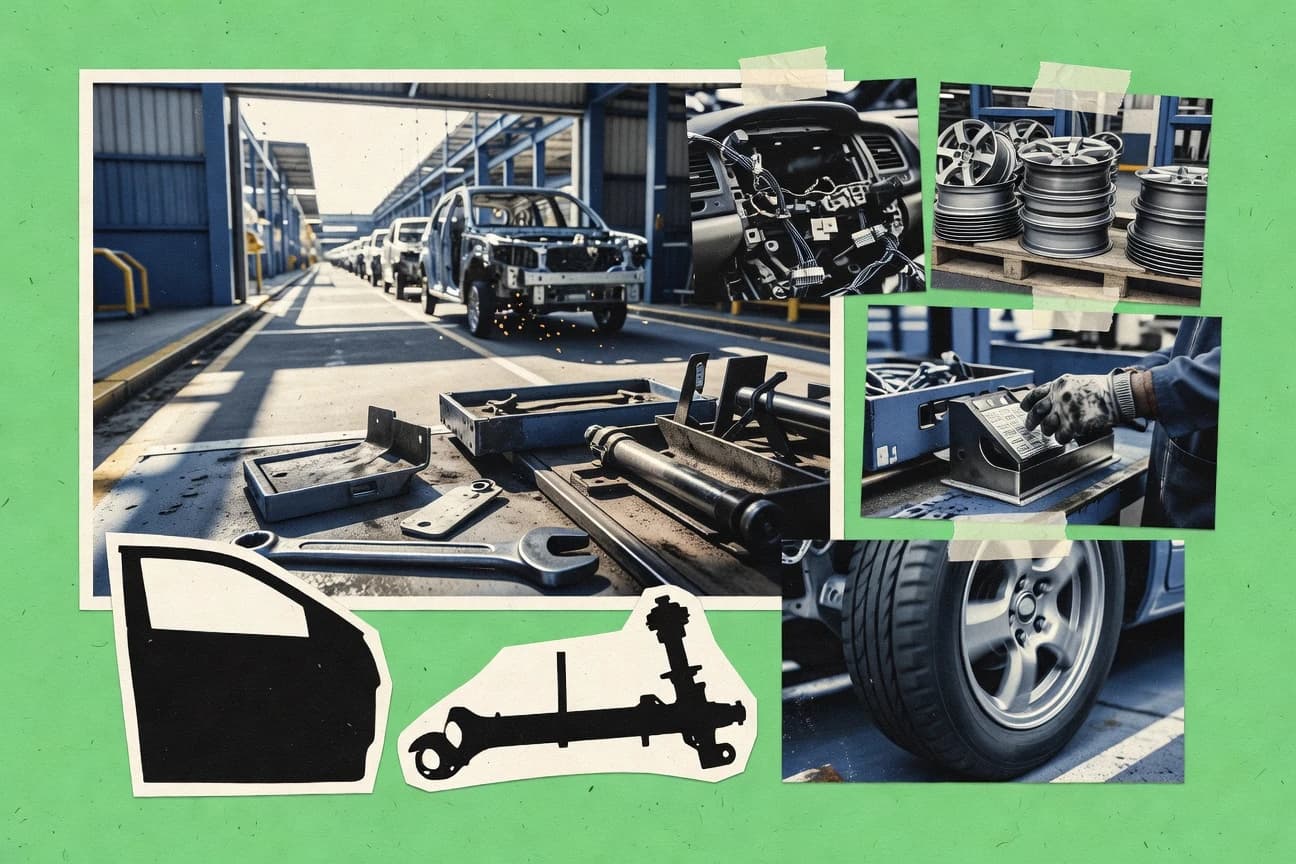
Spain Auto Industry Statistics
Spain’s auto industry is showing a sharp change in momentum, with new 2025 figures that separate what consumers want from what factories are actually building. See where production, sales, and key market signals are pulling in different directions and what that means for the rest of 2026.
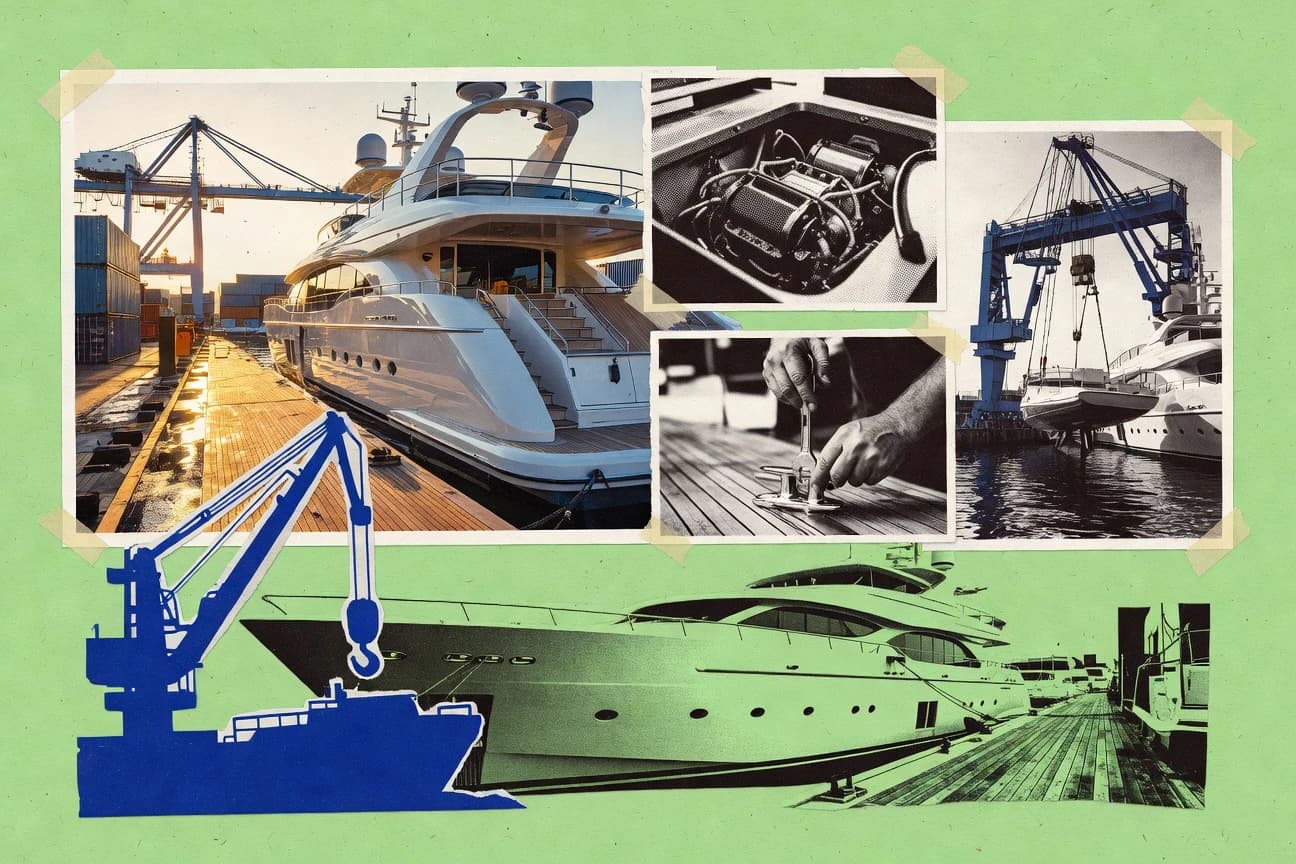
Superyacht Industry Statistics
See how Superyacht Industry’s 2026 cost and demand signals are reshaping priorities, with new construction and charter activity moving out of familiar balance. The page contrasts where the money is heading with what owners and operators are actually feeling, so you can spot the next shift before it becomes obvious.
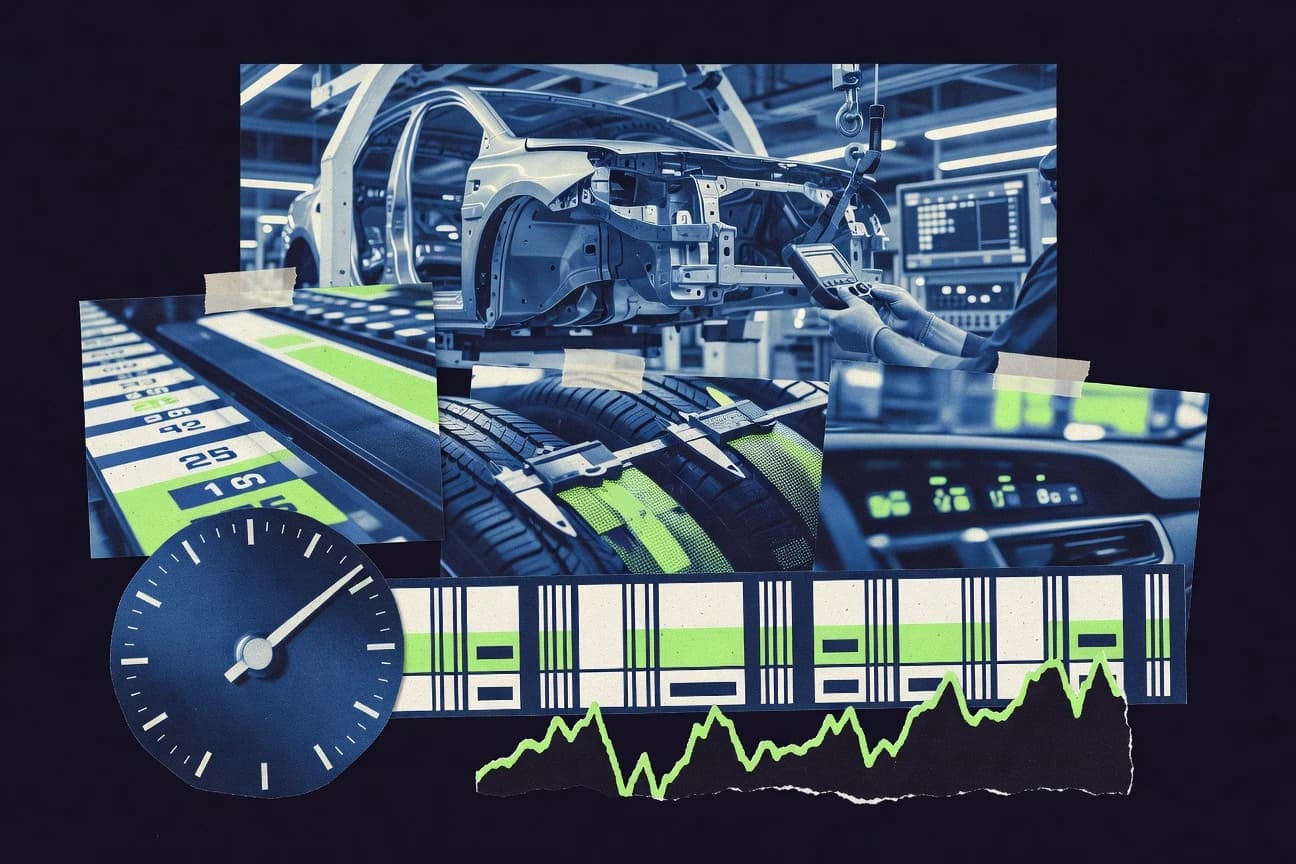
Vehicle Industry Statistics
See how vehicle industry performance is shifting fast, with 2026 figures that highlight where demand is tightening and where production momentum is holding up. You will spot the tension between sales and supply chain realities in a way most monthly reports miss.

Sailboat Industry Statistics
With 2026 figures that reveal a sharp shift in how fast the sailboat market is moving, this page puts the latest production, demand, and ownership signals side by side so you can spot what changed and what it means. It’s the kind of snapshot Sailboat Industry readers use to judge where buyers, builders, and charter operators are headed next, not just what happened before.

Philippines Automotive Industry Statistics
With 1.72 million motor vehicles registered in the Philippines in 2023 and only 3 percent of household spending going to fuel, the page shows how buying and operating costs are pulling in different directions even as imports stay at US$ 8.6 billion for motor vehicles and parts and electric interest remains modest. It also ties that demand pressure to manufacturing and policy signals like a 4.7 percent inflation rate and a 0.7 percent electrified new car share, plus the business reality of a 3.3 percent dealer net profit margin.

South Africa Car Industry Statistics
See how South Africa’s car industry is reshaping demand and production, with the latest 2026 and 2025 figures already pointing to a tighter squeeze for some segments while others hold steady. This page puts the most important year to year moves side by side so you can spot what changed, what didn’t, and where the market pressure is landing next.
South Africa Automotive Industry Statistics
With 2026 fuel price pressure easing and 2025 investment in production and components gaining traction, South Africa’s automotive industry data reveals a shift from survival mode to competitiveness. Read the figures behind passenger vehicle and commercial vehicle trends, export demand, and hiring signals to understand whether growth is finally spreading beyond the showrooms.