GITNUX MARKETDATA
Browse Our Category
Sustainability In Industry
Latest update:


Paper Recycling Statistics
A 2023 snapshot shows only 19% of US paper and paperboard was recovered for recycling, even as paper still dominates municipal waste at 38.5% in 2018 and energy recovery burned 24.4 million tons in 2018. The page also connects Europe’s push for 65% packaging waste recycling by 2025 with how sorting and deinking can cut inks, emissions, and eutrophication impacts, while residue and contaminants quietly cap what the mill can actually reclaim.
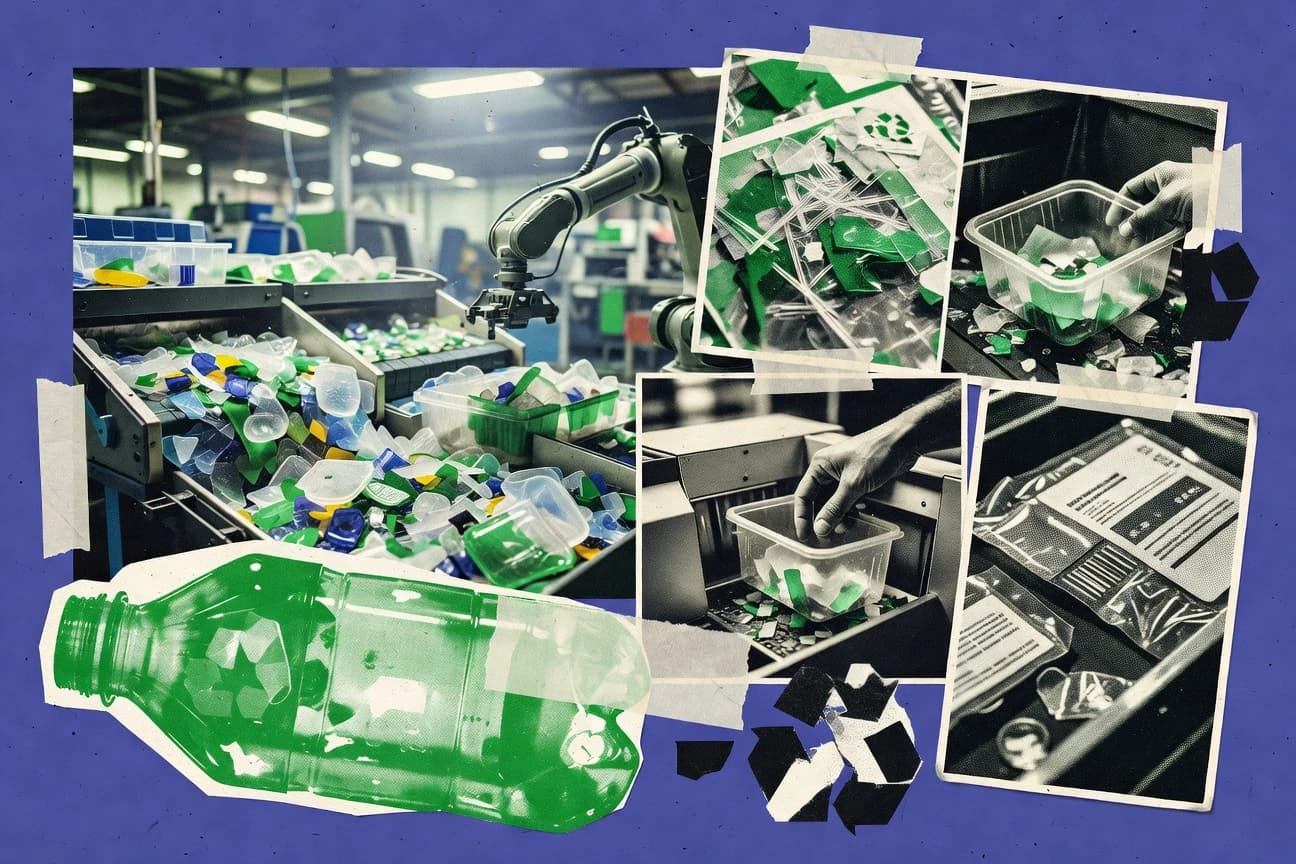
Sustainability In The Plastic Industry Statistics
Despite policy momentum, only 55.6% of EU packaging was recycled in 2022 while global recycling still sits at just 9% in 2015, underscoring why targets and capacity investments must keep accelerating as plastic grows as a share of municipal waste toward 2050. Follow the money and the methods, from chemical recycling projected to reach about $11.4 billion by 2030 to the $10.0 billion recycled plastics market in 2023 heading toward about $30.0+ billion by 2030, and see where climate benefits really hinge on collection losses, contamination, and recycling yields.
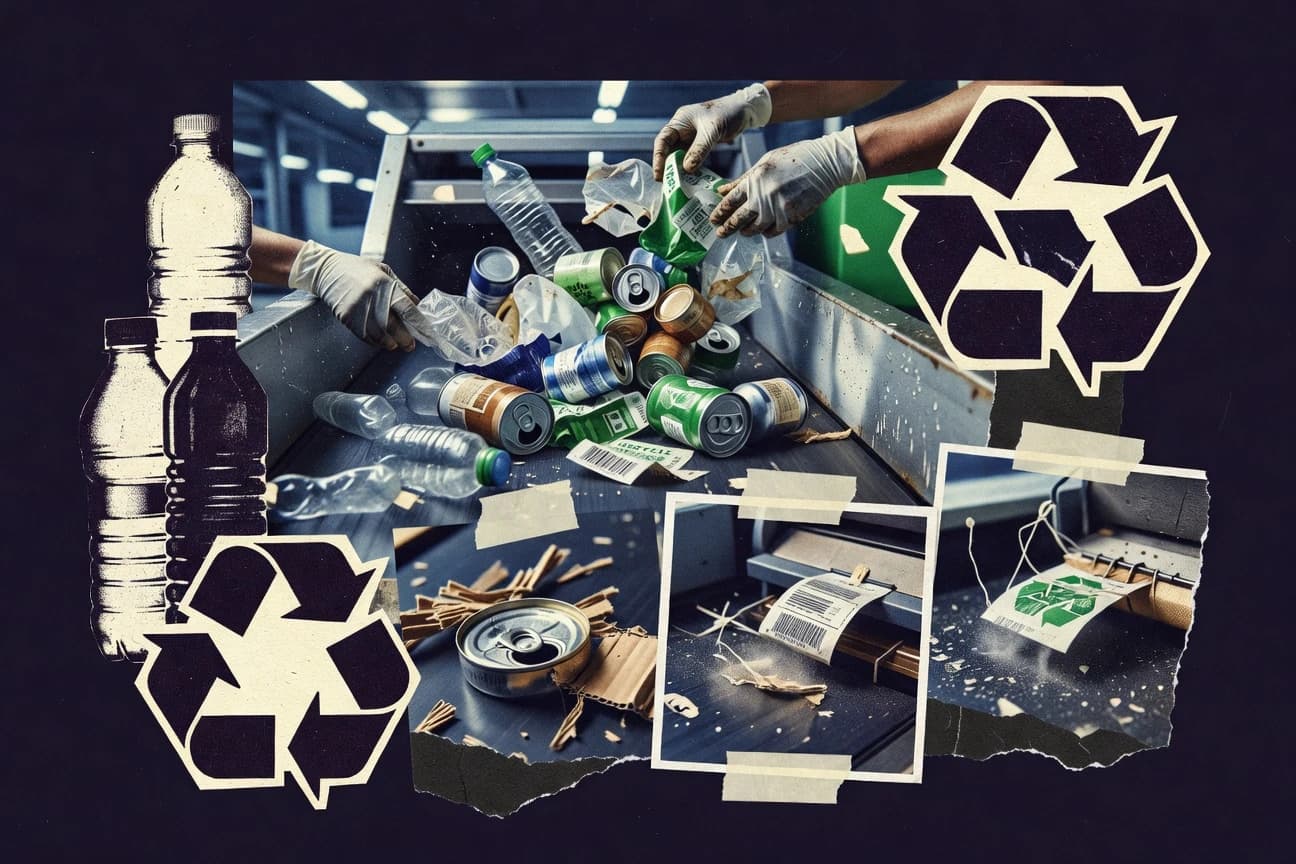
Sustainability In The Recycling Industry Statistics
Recycling is scaling up fast, with EU27 municipal waste reaching 615 kg per person in 2021 and the recycling rate holding above 50%, yet contamination and sorting costs still cap what is economically recoverable, especially for plastics. From OECD and peer reviewed life cycle findings that link better sorting and higher yields to lower greenhouse gas emissions, to market forecasts for plastic and metal recycling growth into 2030 and policy targets like the EU producer responsibility rules, this page connects performance, policy, and practical feasibility in one place.
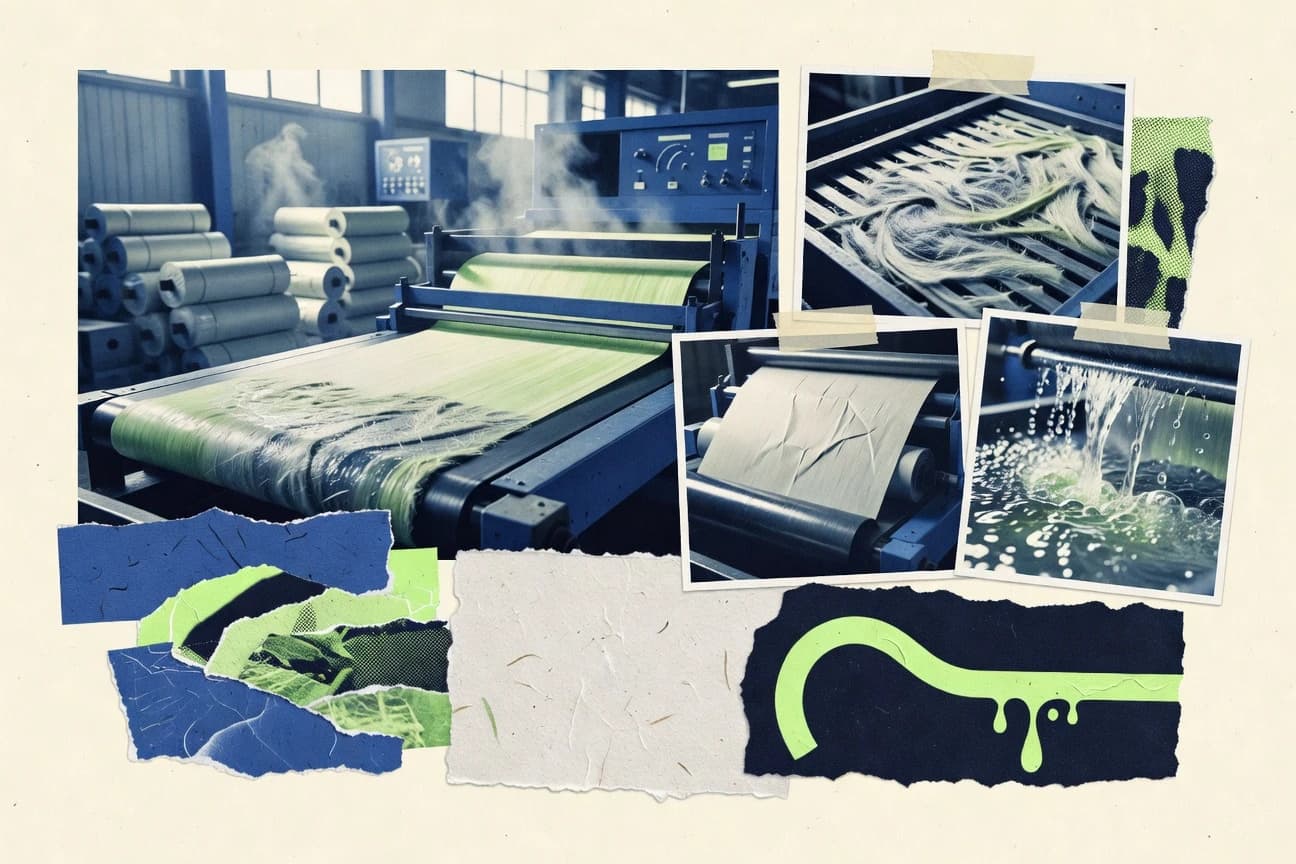
Sustainability In The Paper Industry Statistics
Paper and cardboard drive EU packaging waste at about 26% by weight in 2020, yet recycled fiber already supplied 44% of global paper and paperboard demand in 2023, and EU rules aim to recycle 75% of paper packaging waste by 2030. The page ties those shifts to practical levers like biomass energy, closed loop water, and life cycle climate gains from recycling so you can see where sustainability progress is real and where it still depends on policy and investment.
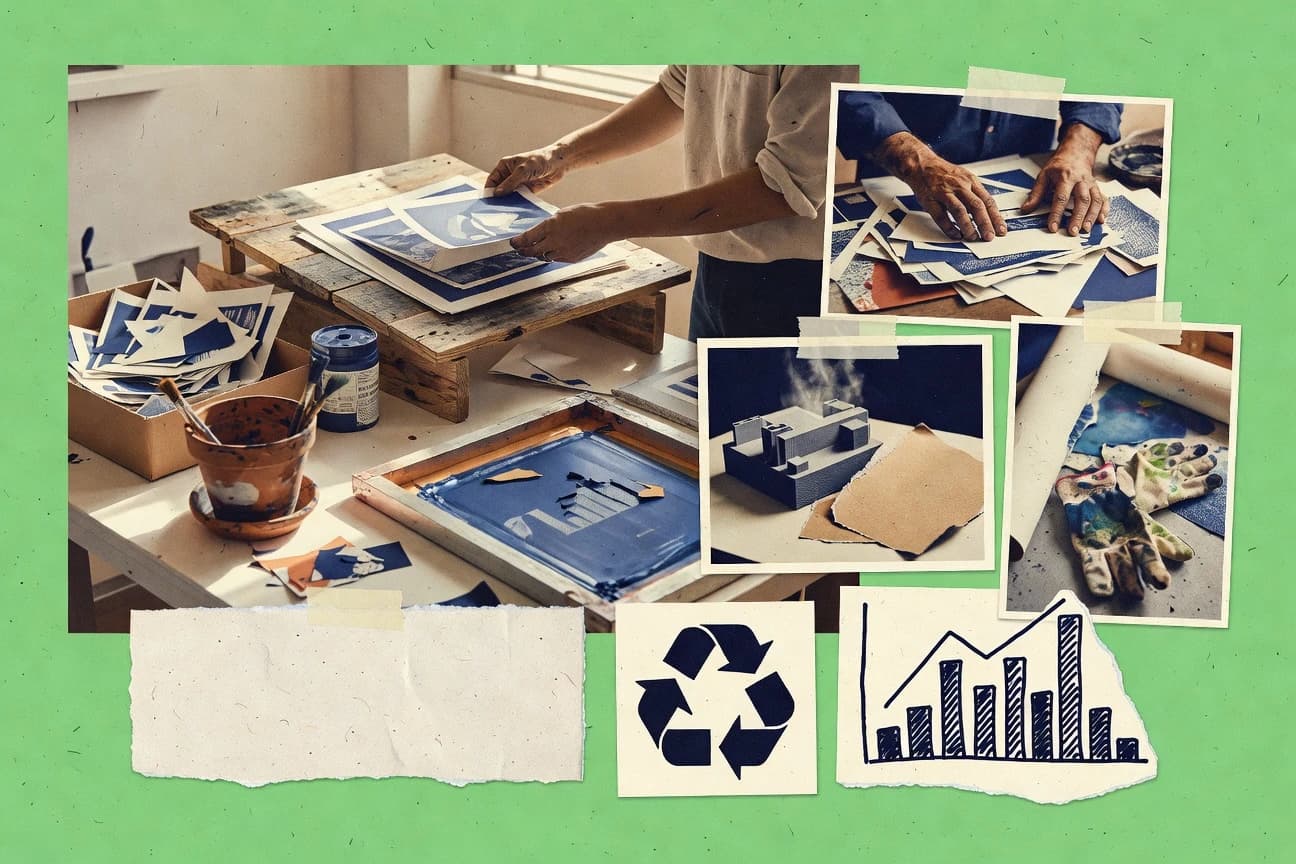
Sustainability In The Creative Industry Statistics
Creative teams are already reshaping production under sustainability pressure, with 48% of Music Declares Emergency respondents saying expectations forced changes in how work is made. At the same time, the bill is growing across the creative supply chain, from $13.2 billion in 2024 green packaging to a projected $1.6°C warming and a $1.9 trillion 2026 creative economy, so every decision from sets to cloud rendering has measurable consequences.

Sustainability In The Biotech Industry Statistics
Sustainability in biotech is moving from aspiration to measurable operating reality, with the global green chemistry market projected to grow 7.0% annually from 2021 to 2027 alongside major capital markets for low impact inputs such as $47.6 billion in 2023 bio based chemicals. The page connects that momentum to the hard constraints that still trip up biotech scaling, from Scope 3 measurement and sustainability reporting take up to a worrying baseline where 55% of global plastic waste ends up in landfill, incineration, or leakage.

Sustainability In The Electrical Industry Statistics
From 34% of new global power capacity added by renewables to more than 5.8 million public EV charging points worldwide, this page tracks how clean generation, grid efficiency, and reliability are scaling together, not in isolation. It also puts sharp focus on the still expensive and messy parts of decarbonization, from $2.2 trillion per year for transmission and distribution through 2050 to EU SF6 emissions of about 90,000 metric tons CO2e in the electricity and industrial categories and the urgent switch to lower impact high voltage equipment.

Sustainability In The Media Industry Statistics
Data centers are expected to drive a 20% jump in electricity demand by 2026 while the ICT sector still accounts for 9% of global greenhouse gas emissions, making climate arithmetic impossible to ignore for streaming and digital media. This page connects the policy and practice shifts shaping the industry, from CSRD and green claims rules to carbon aware scheduling and renewable procurement, so sustainability stops being a headline and becomes measurable operational choices.

Sustainability In The Beer Industry Statistics
AB InBev cut Scope 1 and 2 emissions by 38% per hl since the 2017 baseline and many brewers have made energy and packaging tradeoffs pay off, from 45% renewable power at Diageo in 2022 to 75% of US beer in recyclable aluminum. Follow how those gains stack with faster water action like Heineken cutting water use 11% to 8.2 billion liters while others push toward net zero and near zero waste.

Sustainability In The Tobacco Industry Statistics
See how sustainability claims translate into measurable change, from a 30 percent greenhouse gas intensity reduction per kilogram of tobacco leaf to 12 percent lower curing related PM2.5 emissions, alongside hard constraints like 73 percent of farmers reporting production setbacks. You will also find the scale behind it, including 7.3 million tonnes of cured leaf handled under sustainability systems and 100 percent of smoke constituents linked to health harms, making the environmental tradeoffs impossible to ignore.
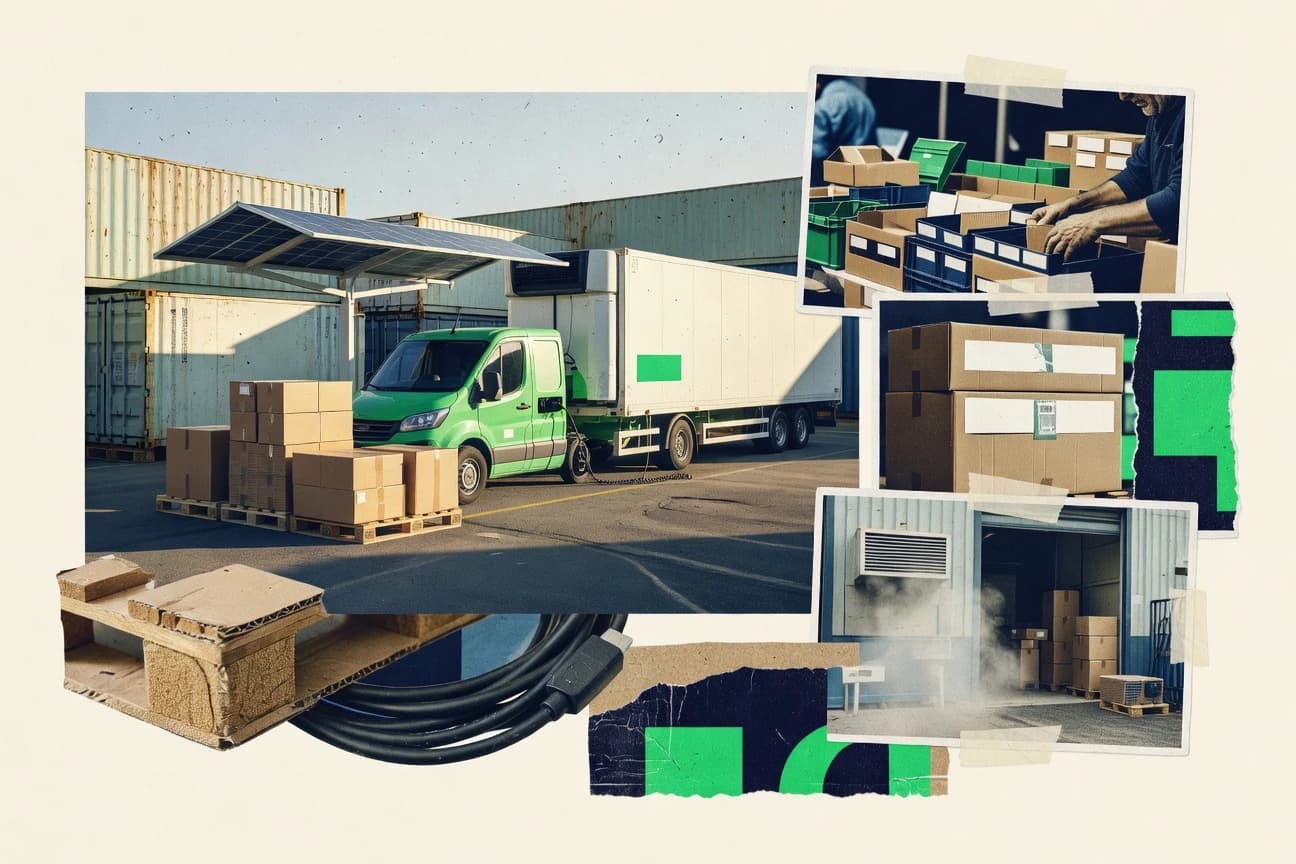
Sustainability In The 3Pl Industry Statistics
From cutting warehouse energy with smart systems and LED upgrades that slash power use by up to 50%, to fleet and logistics emissions moves like electric forklifts, renewable diesel, and route telematics improving efficiency 10 to 15%, these 2026 ready sustainability statistics show how 3PLs are converting ESG goals into measurable reductions. You will also see the compliance and reporting signals shaping accountability, including 2023 progress such as 3PL solar and green contract momentum, plus how decarbonization investments hit $10B in 2023.

Sustainability In The Heavy Industry Statistics
With cement and mining still driving some of the toughest emissions shares, the page pairs sector hot spots with decision ready proof, like 44% of EU metal producers using TCFD for climate risk reporting in 2022 and 64% of manufacturing organizations adopting energy management aligned with ISO 50001 by 2023. It also puts the transition math in your hands, from energy efficiency savings worth 4 exajoules a year by 2030 to the scale of fuel switching and low carbon steel and cement route shifts needed by 2050.
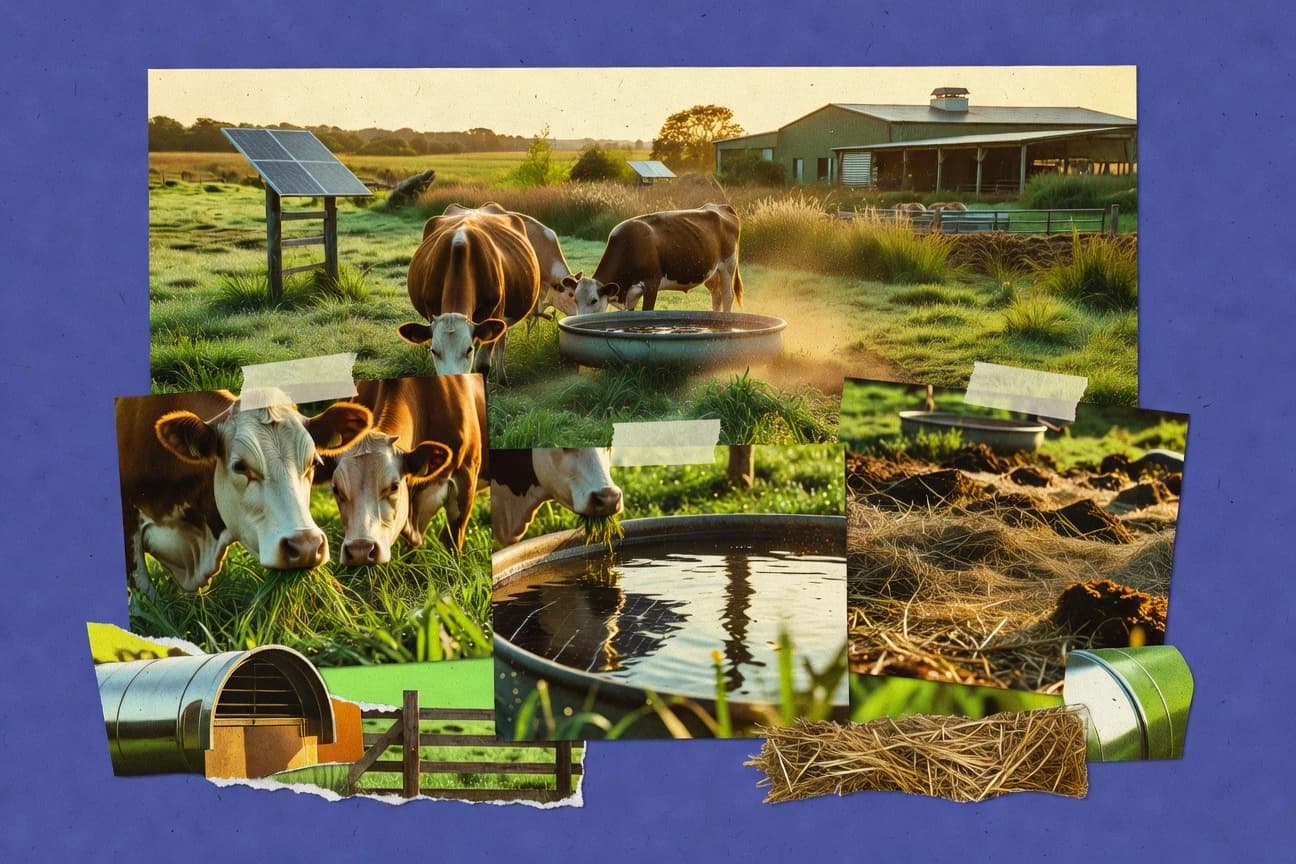
Sustainability In The Cattle Industry Statistics
U.S. feedlots now run at a 6:1 feed to beef ratio and global beef feed intake per kg gain is down 20% since 1990 showing efficiency gains are still pushing the needle in 2025 and 2026 era practices. At the same time, the page pairs those gains with hard climate and water tradeoffs like 193 million metric tons of CO2e from U.S. cattle production and tighter water use targets so you can see where sustainability improvements really come from and where they get challenged.

Sustainability In The Customer Service Industry Statistics
Seventy three percent of consumers would change habits to cut their environmental impact, yet 40% say they will walk away after a single bad service experience and 62% expect sustainable options like paperless communications that still feel fast and human. This page connects that pressure to the nuts and bolts, from cutting travel emissions with video to what CSRD and climate disclosure rules mean for customer service IT, plus the surprising budget reality that only 1.8% of IT funds are going toward sustainability initiatives.
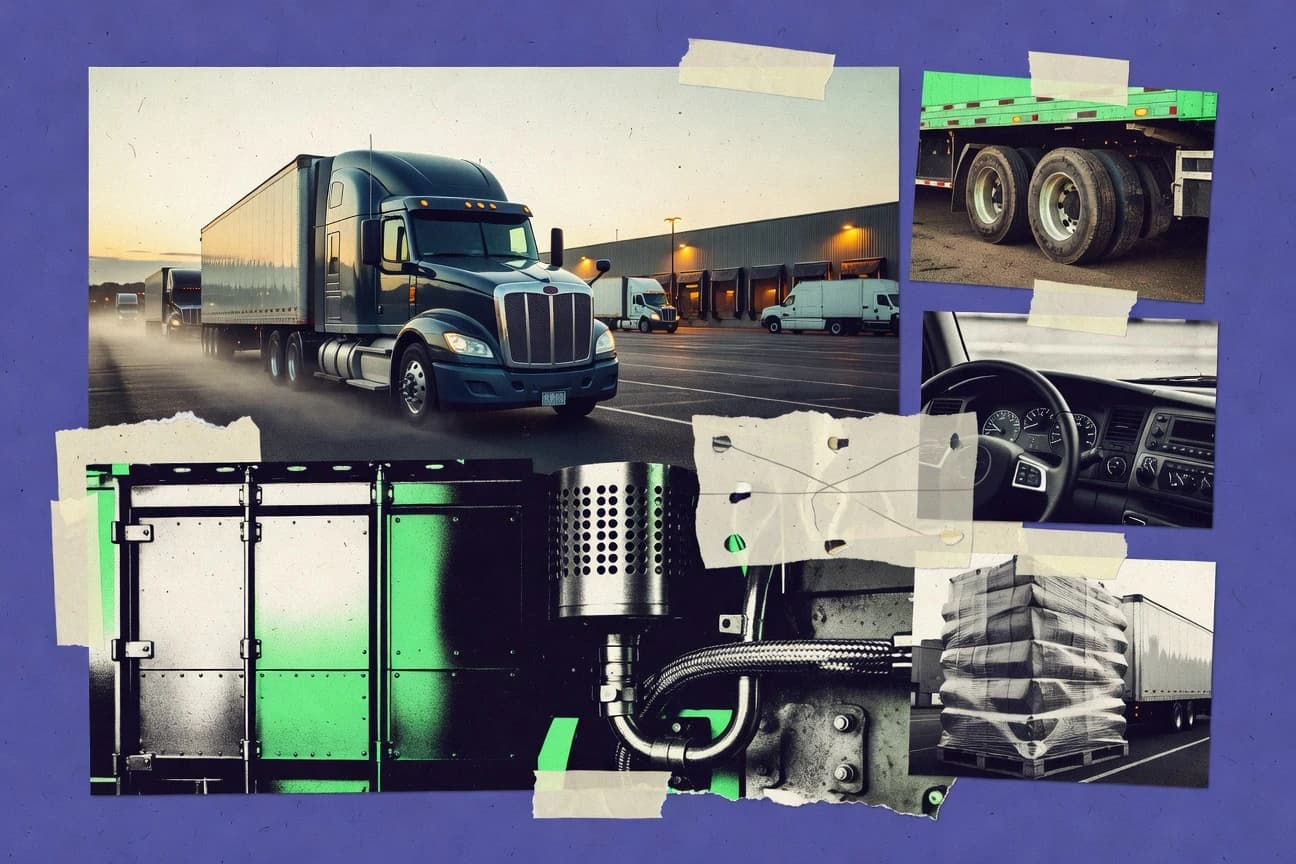
Sustainability In The Trucking Industry Statistics
Even with emissions still rising in key segments, U.S. fleet leaders already moved from 20% to 12% using alternative fuels and EV adoption is accelerating fast, with electric truck sales hitting 4,800 units in 2023 and battery costs falling 20% to $120 per kWh in 2023. This page ties together the surprise tradeoffs across cleaner powertrains, fuel production, and operational efficiency, from LNG and RNG to HVO and hydrogen, so you can see which levers cut CO2 and pollutants the most and where adoption is stalling.

Sustainability In The Bpo Industry Statistics
BPO emissions are being attacked from every angle, from energy cuts and renewable power that reduced global energy use by 15% since 2019 to cloud work shifting Scope 3 IT emissions down 38%, with 65% of firms now using carbon accounting software to cut reporting errors by 25%. But the gap is where the urgency lives, since even with 70% of BPOs participating in CDP climate disclosure, emissions are still shaped by purchased electricity and travel, making this page essential reading for anyone tracking how sustainability moves from pledges to measurable reductions in 2025 and beyond.

Sustainability In The Film Industry Statistics
From 2.1 billion tonnes of CO2 linked to cement in 2022 to the momentum of ISO 14001 adoption over one million certificates, the page connects industrial emissions, reporting quality, and supplier standards to what actually gets built on screen and what it takes to make set work lower carbon. It also tracks how electrifying production and tightening rules from EU packaging EPR to SBTi and CSRD are reshaping procurement, costs, and accountability across the film materials supply chain.

Sustainability In The Wholesale Industry Statistics
Wholesale can’t claim it is “downstream” when buildings, transport and industry already account for 44% of global emissions and EU packaging rules target 65% recycling by 2025, forcing buyers to rethink procurement, logistics and measurement. See how fast regulation and reporting are converging with practical tools and costs, from road freight driving about 70% of freight CO2 emissions to ESG data systems that are reshaping procurement decisions for 54% of supply chain leaders.
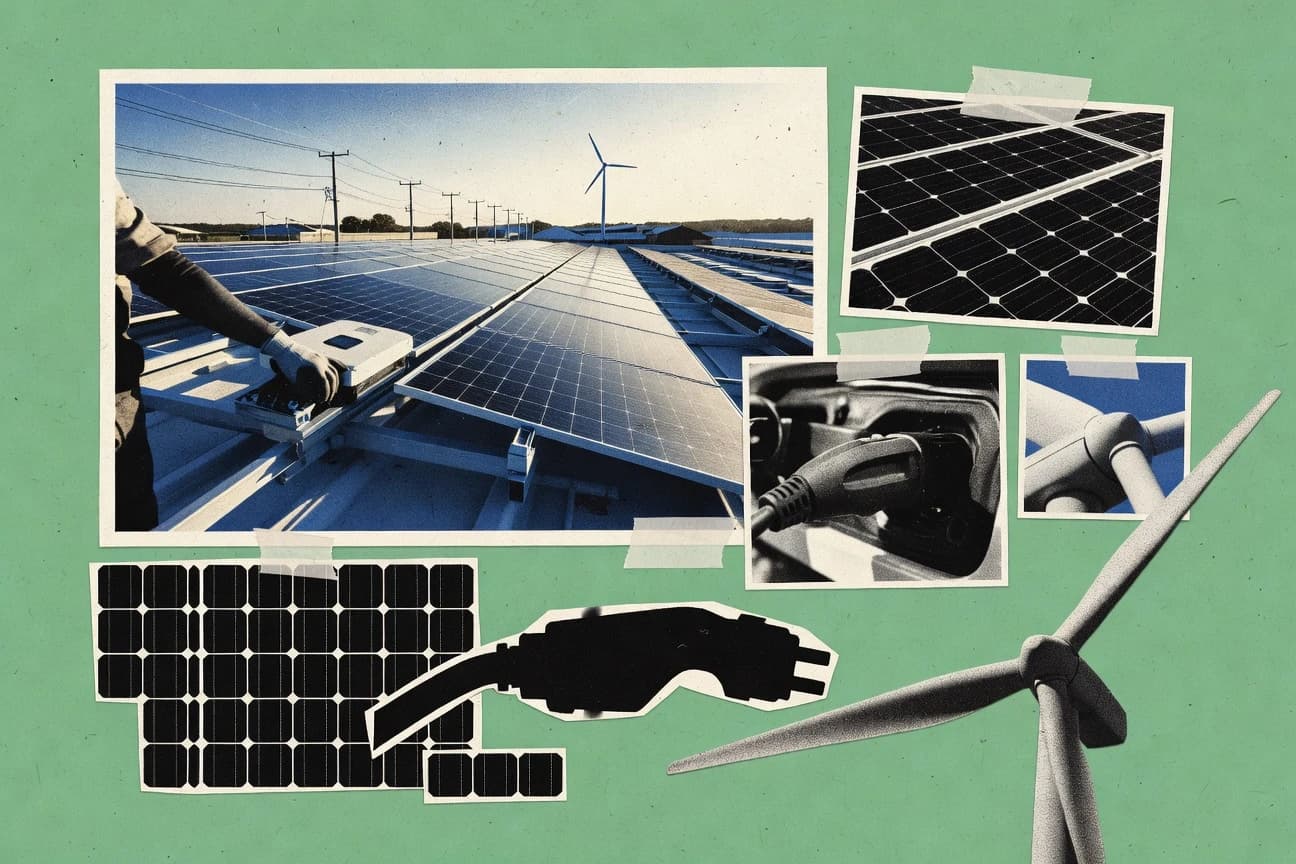
Green Technology Statistics
Solar is already powering 6.0% of global electricity and battery storage hit 21.9 GW in 2023, yet electricity generation still accounts for 37% of global energy related CO2, making power-system greening the make-or-break lever. Follow the thread from wind capacity climbing to about 1,400 GW and EV charging expanding by 2.1 million public points to the investment scale, with clean energy putting $1.8 trillion to work in 2023.

Sustainability In The Services Industry Statistics
See how services companies are cutting emissions while redesigning everyday operations, from hospitality using smart HVAC to lower energy use and retail driving major efficiency gains through LED retrofits. With 2023 Scope 1 emissions down 15 percent through electrification and a raft of sector wins like IT cloud energy down 25 percent and logistics cutting fleet emissions 28 percent, this page tracks the practical moves behind measurable progress.