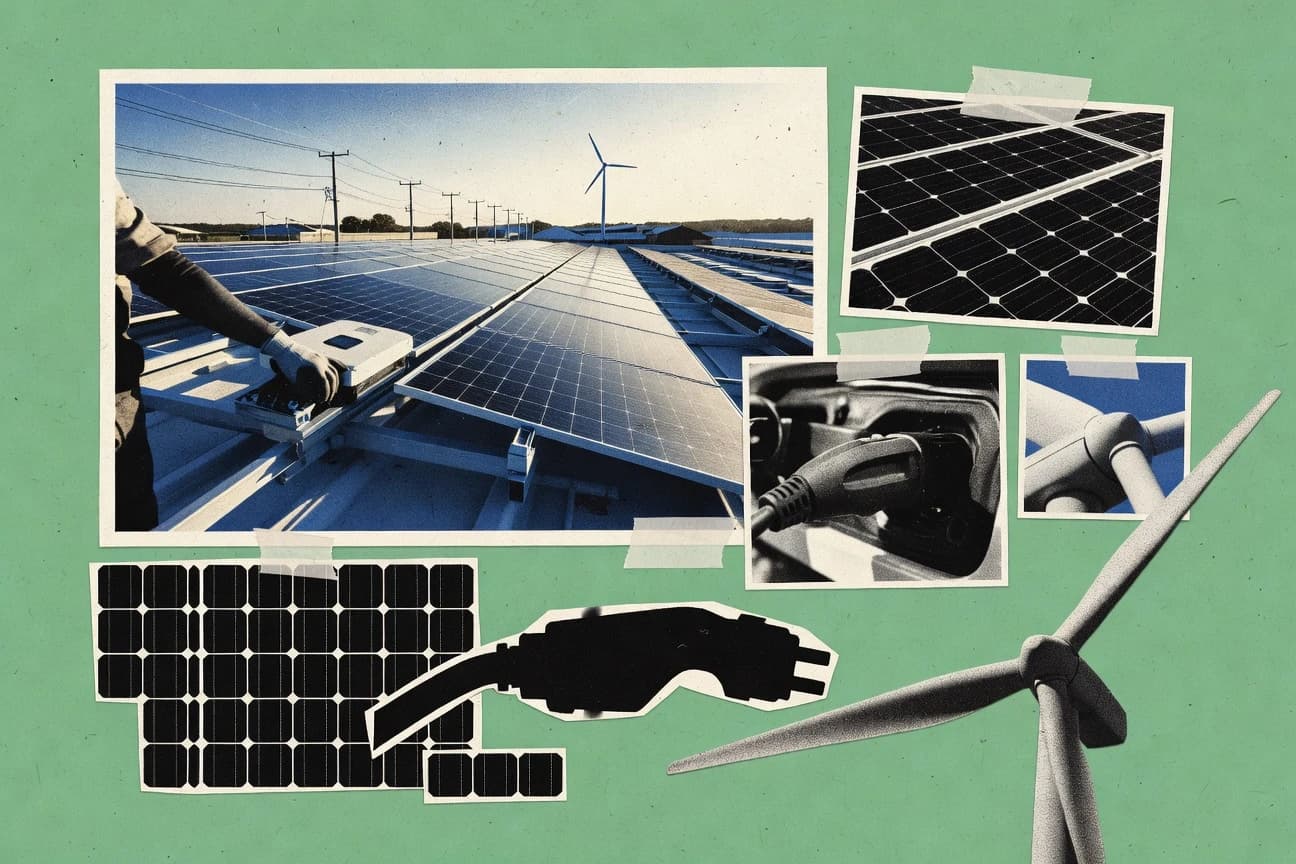

Electricity generation still produced 37% of global energy related CO2 emissions, even as renewables supplied almost 90% of new power capacity additions and clean energy investment reached $1.8 trillion. Solar generated 6.0% of global electricity and battery storage installations hit 21.9 GW, showing how fast low carbon infrastructure is expanding. These statistics track the scale of that shift across power, transport, heating, storage, and funding.
Key Takeaways
- 37% of global energy-related CO2 emissions in 2022 came from electricity generation (the largest single sector), highlighting the scale of decarbonization needed for power-system greening
- 6.0% of global electricity generation came from solar in 2023, showing solar’s major contribution to new clean capacity
- Global wind power capacity reached about 1,400 GW at end-2023, quantifying cumulative wind infrastructure
- 1.5 gigawatts (GW) of offshore wind capacity was added worldwide in 2023, demonstrating continued expansion of ocean-based wind deployment
- Global battery energy storage system (BESS) installations reached 21.9 GW in 2023, demonstrating accelerating grid storage adoption
- China installed 18.6 million heat pumps in 2023 (as reported in recent IEA heat pump tracking), indicating China’s dominant deployment
- The IEA estimates global investment in clean energy reached $1.8 trillion in 2023 (including energy efficiency, renewables, grid, and enabling technologies), indicating scale of green-tech capital flows
- $130 billion of clean energy investment was in offshore wind specifically in 2023 (as categorized within IEA clean energy subsectors), reflecting targeted subsector scale
- The global green hydrogen electrolyzer market was valued at $1.1 billion in 2023 and is projected to grow rapidly (market forecast), indicating commercialization momentum for hydrogen tech
- 2.1 million public charging points were added worldwide in 2023, expanding charging access for EV adoption
- Demand response (DR) programs reduced peak grid load by 8.7% during reported events in 2023 in the U.S. (as measured in state/program evaluations), showing grid flexibility benefits
- Onshore wind LCOE fell to around $0.04 per kWh in many markets by 2023 (regional ranges apply), demonstrating wind cost competitiveness
- Worldwide, the levelized cost of energy for utility-scale batteries is commonly benchmarked against $/kWh and cycle assumptions; in IRENA’s analysis utility-scale storage costs declined versus earlier years, supporting faster payback expectations
- The IRA includes $47.0 billion for the Greenhouse Gas Reduction Fund over 10 years (CBO IRA score).
- The share of renewable energy in global final energy consumption reached 23.1% in 2022 (IRENA Renewable Energy Statistics 2024).
Renewables and grid and storage investment are accelerating fast, but power decarbonization remains critical.
Related reading
01 · Category
Emissions & Energy9 stats
01
37% of global energy-related CO2 emissions in 2022 came from electricity generation (the largest single sector), highlighting the scale of decarbonization needed for power-system greening
02
6.0% of global electricity generation came from solar in 2023, showing solar’s major contribution to new clean capacity
03
Global wind power capacity reached about 1,400 GW at end-2023, quantifying cumulative wind infrastructure
04
152.7 terawatt-hours (TWh) of solar generation were produced in the United States in 2023, indicating solar’s significant electricity contribution
05
The U.S. transportation sector emitted 1,811 million metric tons of CO2 in 2023 (excluding some categories depending on accounting), quantifying the decarbonization target for clean mobility
06
The share of renewables in final energy consumption was 23.0% in 2022 (renewables excluding traditional biomass effects depend on methodology), supporting the transition away from fossil fuels
07
Energy efficiency improvements contributed to 40% of the reduction in global energy intensity between 2000 and 2019 (IEA analysis), showing the role of green technologies beyond renewables
08
In 2023, the U.S. captured about 3,000 kilotons (kt) of CO2 via CCS/CCUS projects (EIA CCUS dataset), quantifying measured capture
09
In the EU, electricity from renewable sources was 30.7% of gross electricity consumption in 2022 (Eurostat), showing substantial clean power penetration
Interpretation
Emissions & Energy Interpretation
In the Emissions and Energy arena, electricity generation drove 37% of global CO2 emissions in 2022, yet clean power is scaling fast with solar providing 6.0% of global electricity in 2023 and 23.0% of renewables in final energy consumption by 2022, showing renewables are starting to shift the emissions equation at a meaningful pace.
02 · Category
Market Size8 stats
01
The IEA estimates global investment in clean energy reached $1.8 trillion in 2023 (including energy efficiency, renewables, grid, and enabling technologies), indicating scale of green-tech capital flows
02
$130 billion of clean energy investment was in offshore wind specifically in 2023 (as categorized within IEA clean energy subsectors), reflecting targeted subsector scale
03
The global green hydrogen electrolyzer market was valued at $1.1 billion in 2023 and is projected to grow rapidly (market forecast), indicating commercialization momentum for hydrogen tech
04
Global grid investment needs are estimated in the IEA to be in the order of hundreds of billions of dollars annually to support clean energy growth (annual estimate in report), indicating the magnitude of enabling infrastructure
05
The IEA estimates global spending on electricity grids will need to reach about $500 billion per year by 2030 (order-of-magnitude figure used in IEA analysis), reflecting grid scale-up requirements
06
In 2023, global public funding for clean energy (including grants and loans) totaled $357 billion (as reported by OECD/CPI-type tracking in relevant report), indicating ongoing policy-backed acceleration
07
$369 billion was raised by the EU via the Innovation Fund for low-carbon technologies in its first major call(s) (including 2021–2023 pipeline), reflecting public support for green innovation
08
US Inflation Reduction Act (IRA) includes approximately $369 billion of climate and energy investments over 10 years (total program estimate in official Congressional Budget Office/Joint Committee on Taxation summaries), driving demand for green technologies
Interpretation
Market Size Interpretation
For the market size of Green Technology, investment is already scaling to massive levels, with global clean energy investment hitting about $1.8 trillion in 2023 and projected electricity grid spending needing to reach roughly $500 billion per year by 2030.
03 · Category
Performance & Cost5 stats
01
Demand response (DR) programs reduced peak grid load by 8.7% during reported events in 2023 in the U.S. (as measured in state/program evaluations), showing grid flexibility benefits
02
Onshore wind LCOE fell to around $0.04per kWh in many markets by 2023 (regional ranges apply), demonstrating wind cost competitiveness
03
Worldwide, the levelized cost of energy for utility-scale batteries is commonly benchmarked against $/kWh and cycle assumptions; in IRENA’s analysis utility-scale storage costs declined versus earlier years, supporting faster payback expectations
04
Methane abatement technologies can reduce methane emissions costs to as low as $0.06per ton of CO2e in some mitigation portfolios (IEA and other analyses), indicating strong economic potential
05
Industrial heat pumps can reach efficiencies of 200%–500% (COP of 2–5), reducing energy use versus conventional heating in suitable processes (IEA technology tracking)
Interpretation
Performance & Cost Interpretation
Performance and cost gains are becoming clear across green technologies, from 2023 demand response cutting U.S. peak load by 8.7% to onshore wind LCOE dropping to about $0.04 per kWh and industrial heat pumps delivering 200% to 500% efficiency, showing multiple pathways to lower system costs.
More related reading
04 · Category
Industry Trends4 stats
01
1.5 gigawatts (GW) of offshore wind capacity was added worldwide in 2023, demonstrating continued expansion of ocean-based wind deployment
02
Global battery energy storage system (BESS) installations reached 21.9 GW in 2023, demonstrating accelerating grid storage adoption
03
China installed 18.6 million heat pumps in 2023 (as reported in recent IEA heat pump tracking), indicating China’s dominant deployment
04
The International Energy Agency reports that renewables made up almost 90% of new power generation capacity additions in 2023 (including solar PV, wind, hydro, etc.), highlighting market dominance of green generation
Interpretation
Industry Trends Interpretation
Across industry trends in green technology, rapid scale-up is clear as 21.9 GW of battery storage was installed worldwide in 2023 while offshore wind additions hit 1.5 GW, showing the power sector is quickly pairing new generation with grid flexibility.
05 · Category
User Adoption1 stats
01
2.1 million public charging points were added worldwide in 2023, expanding charging access for EV adoption
Interpretation
User Adoption Interpretation
In 2023, the addition of 2.1 million public charging points worldwide shows how rapidly expanding charging access is accelerating user adoption of electric vehicles.
06 · Category
Industry Overview2 stats
01
The IRA includes $47.0 billion for the Greenhouse Gas Reduction Fund over 10 years (CBO IRA score).
02
The share of renewable energy in global final energy consumption reached 23.1% in 2022 (IRENA Renewable Energy Statistics 2024).
Interpretation
Industry Overview Interpretation
From an industry overview standpoint, the IRA’s $47.0 billion Greenhouse Gas Reduction Fund over 10 years and global renewable energy reaching 23.1% of final energy consumption in 2022 show strong and growing momentum in the clean energy transition.
report visual · Key figures
Green technology momentum across power and grid
Renewables are increasing their share of power generation while grid flexibility and efficiency improvements help decarbonize electricity systems.
6%
6.0% of global electricity generation came from solar in 2023, showing solar’s major contribution to new clean capacity
30.7%
In the EU, electricity from renewable sources was 30.7% of gross electricity consumption in 2022 (Eurostat), showing sub
8.7%
Demand response (DR) programs reduced peak grid load by 8.7% during reported events in 2023 in the U.S. (as measured in
40%
Energy efficiency improvements contributed to 40% of the reduction in global energy intensity between 2000 and 2019 (IEA
source-verifiedember-climate.org · ec.europa.eu · ferc.gov · iea.org2023
Reference
Cite This Report
This report is designed to be cited. We maintain stable URLs and versioned verification dates. Copy the format appropriate for your publication below.
APA
Stefan Wendt. (2026, February 13). Green Technology Statistics. Gitnux. https://gitnux.org/green-technology-statistics
MLA
Stefan Wendt. "Green Technology Statistics." Gitnux, 13 Feb 2026, https://gitnux.org/green-technology-statistics.
Chicago
Stefan Wendt. 2026. "Green Technology Statistics." Gitnux. https://gitnux.org/green-technology-statistics.
Sources & references
29 datasets cited across this report · attribution is report-level
+18 additional datasets cited (not shown individually)