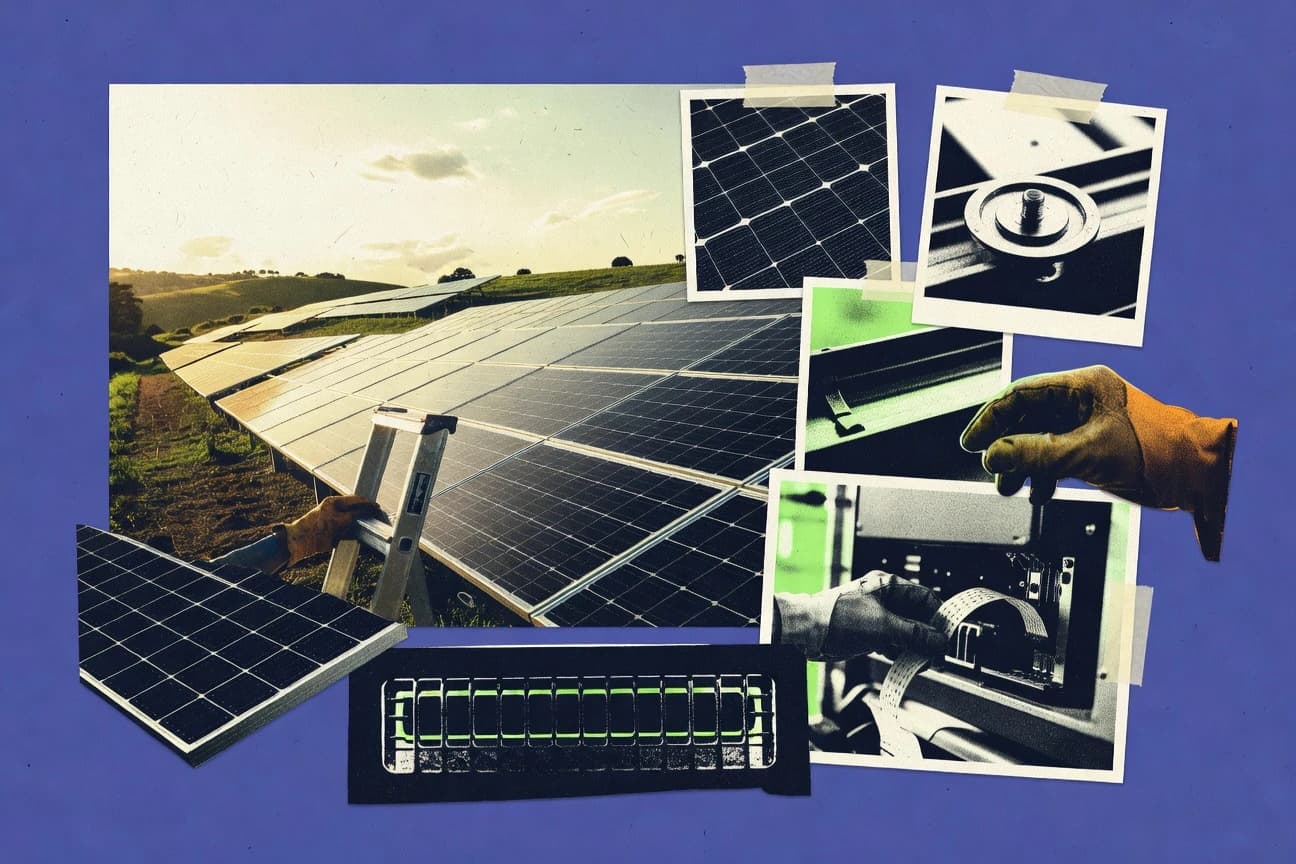

Global solar PV capacity has reached 1,624 gigawatts. Utility-scale levelized costs have fallen to 0.049 dollars per kilowatt-hour in many markets. The statistics below detail capacity additions, cost reductions, and emission impacts by region.
Key Takeaways
- Global weighted average LCOE for utility-scale solar PV fell to $0.049/kWh in 2023, down 12% from 2022
- Solar energy avoided 2.6 billion tonnes of CO2 emissions globally in 2023, equivalent to 5.5% of power sector emissions
- Global solar PV installed capacity reached 1,624 GW by the end of 2023, representing a 22% increase from 2022
- Global solar PV additions grew 87% to 447 GW in 2023 from 239 GW in 2022
- Commercial silicon solar cells achieved 25.7% efficiency record in 2023
Solar energy is growing fast, and these latest statistics show accelerating adoption worldwide.
Related reading
01 · Category
Cost And Economics26 stats
01
Global weighted average LCOE for utility-scale solar PV fell to $0.049/kWh in 2023, down 12% from 2022
02
Solar module prices dropped to $0.11/Wp in Q4 2023, a 42% decline from Q1 2023
03
The US solar industry's investment reached $25.6 billion in 2023, creating 280,000 jobs
04
Levelized cost of solar PV in India averaged INR 2.60/kWh ($0.031/kWh) for projects bidding in 2023
05
Germany's feed-in tariff for rooftop solar under 10 kW was €0.0824/kWh in 2024
06
Australia's large-scale solar LCOE ranged from AUD 40-60/MWh in 2023 auctions
07
Solar PV became the cheapest source of new electricity in 82% of the world by LCOE in 2023
08
Investment in solar PV globally hit $500 billion in 2023, up 17% from 2022
09
Utility-scale solar PPA prices in the US averaged $24/MWh in Q3 2023, down from $30/MWh in 2022
10
China's solar manufacturing capacity utilization rate was 35% in 2023 due to overcapacity
11
Utility-scale solar LCOE in China fell to CNY 0.24/kWh ($0.034/kWh) in 2023 bids
12
Corporate PPAs for solar in Europe averaged €35/MWh in 2023
13
Solar BOS costs in US dropped 5% to $0.90/Wdc in 2023
14
Global solar EPC costs averaged $0.85/W in 2023 for utility-scale
15
Residential solar system costs in Australia fell to AUD 1.4/W in 2023
16
Incentives like US ITC boosted solar ROI to 10-15% IRR for commercial projects
17
Solar PV O&M costs averaged $13/kW-yr globally in 2023
18
Balance of system costs represent 40% of total solar project costs in 2023
19
Global average solar module price was $0.15/Wp end-2023
20
US commercial solar LCOE $0.062/kWh pre-incentives 2023
21
Polysilicon prices fell 85% to $8/kg in 2023
22
Solar financing costs in developing countries averaged 8-12% interest rates 2023
23
Battery-solar hybrid LCOE $0.055/kWh in Australia 2023
24
India solar auction prices hit INR 2.15/kWh record low 2023
25
EU solar self-consumption tariffs averaged €0.08-0.12/kWh 2023
26
Solar avoided $12 billion in fuel costs for US utilities in 2023
Interpretation
Cost And Economics Interpretation
Cost and economics data show solar is getting materially cheaper, with the global weighted average utility scale LCOE dropping to $0.049 per kWh in 2023, down 12% from 2022.
02 · Category
Environmental Impact18 stats
01
Solar energy avoided 2.6 billion tonnes of CO2 emissions globally in 2023, equivalent to 5.5% of power sector emissions
02
Utility-scale solar farms in the US displaced 135 million metric tons of CO2 in 2023
03
Lifetime emissions of solar PV are 41 gCO2eq/kWh, compared to 490 for natural gas and 820 for coal
04
Solar power in India saved 55 million tons of CO2 in FY2023-24
05
European solar installations avoided 55 million tonnes of CO2 in 2023
06
Australian rooftop solar reduced emissions by 19 million tonnes in 2023
07
Global solar water heating saved 1.5 EJ of energy and 110 Mt CO2 in 2022
08
Solar PV land use efficiency is 10-20 times higher than biofuels per unit energy
09
Bifacial solar panels increase energy yield by 10-30% without extra land use
10
Concentrated solar power (CSP) with storage avoids 90% of fossil fuel emissions over lifecycle
11
Floating solar avoided 1.2 Mt CO2 in Asia in 2023 deployments
12
Agrivoltaics systems maintain 80% agricultural productivity while generating solar power
13
Solar thermal avoided 25 Mt CO2 in industrial heat applications in 2022
14
Perovskite tandems have 90% lower material use than silicon alone, reducing mining impact
15
Desert solar cools panels by 5-10°C via natural convection, reducing water use
16
Global solar recycling recovered 95% of materials from end-of-life panels in 2023 pilots
17
Solar PV water use is 0.1 m3/MWh vs 2.5 for coal
18
Building-integrated PV reduces urban heat island effect by 2-5°C
Interpretation
Environmental Impact Interpretation
In 2023 and the most recent reporting periods, solar energy is delivering major environmental impact by avoiding tens of millions of tonnes of CO2 worldwide, such as 2.6 billion tonnes globally in 2023 and 135 million metric tons in the US, underscoring its role in cutting power sector emissions.
03 · Category
Installed Capacity23 stats
01
Global solar PV installed capacity reached 1,624 GW by the end of 2023, representing a 22% increase from 2022
02
The United States added 32.4 GW of new solar capacity in 2023, accounting for 54% of all new electricity generation capacity installed that year
03
China led the world with 216.9 GW of new solar PV installations in 2023, more than the rest of the world combined
04
India's cumulative solar capacity surpassed 81 GW by March 2024, with rooftop solar contributing 11.5 GW
05
Germany had 81.8 GW of solar PV capacity at the end of 2023, with 14.3 GW added that year
06
Australia's solar capacity exceeded 40 GW by mid-2024, driven by over 3.7 million rooftop installations
07
Japan reached 98 GW of solar capacity in 2023, with utility-scale projects adding 6.5 GW
08
Brazil installed 13.5 GW of solar in 2023, reaching a total of 32 GW distributed generation solar
09
The EU added 56 GW of solar in 2023, with Spain leading at 12.6 GW
10
South Africa's solar capacity hit 6.7 GW by end-2023, with 1.1 GW rooftop solar growth
11
Global solar PV capacity reached 1,050 GW by end-2022, growing to 1,624 GW in 2023 at 55% CAGR since 2018
12
California installed 7.1 GW of new solar in 2023, 76% of state capacity additions
13
Texas solar capacity surpassed 20 GW in 2023 with 6.5 GW new builds
14
The Netherlands reached 23 GW solar capacity end-2023, adding 5.2 GW
15
Thailand's solar capacity hit 5.2 GW in 2023, with ground-mount leading
16
Mexico added 2.1 GW solar in 2023, total over 8 GW
17
UAE's Mohammed bin Rashid Al Maktoum Solar Park reached 2.4 GW operational in 2023
18
Morocco's Noor Ouarzazate CSP plant at 580 MW full capacity since 2023
19
Global solar capacity is projected to triple to 4.7 TW by 2030
20
New York state solar capacity reached 5 GW end-2023, adding 1.2 GW
21
Poland installed 12 GW solar in 2023, total 17 GW
22
Egypt's Benban Solar Park at 1.8 GW fully operational 2023
23
Chile added 2.3 GW solar in 2023, total 8 GW
Interpretation
Installed Capacity Interpretation
By the end of 2023, global installed solar PV capacity hit 1,624 GW, and the momentum is increasingly driven by a few countries adding huge shares such as China’s 216.9 GW of new installations in 2023 and the United States’ 32.4 GW, underscoring how installed capacity continues to concentrate even as the overall total grows.
More related reading
04 · Category
Market Growth And Adoption24 stats
01
Global solar PV additions grew 87% to 447 GW in 2023 from 239 GW in 2022
02
Solar accounted for 75% of new renewable capacity added globally in 2023
03
US residential solar installations reached 360,000 in 2023, up 16% YoY
04
China's solar capacity share in total power capacity hit 15% by end-2023
05
India's solar additions were 17.6 GW in FY2023-24, up 19% YoY
06
Europe's solar market grew 43% to 56 GW in 2023
07
Australia installed 4.1 GW of new rooftop solar in 2023
08
Japan's solar market rebounded with 6.5 GW additions in FY2023
09
Brazil's distributed solar grew 15 GW in 2023, total DG solar at 25 GW
10
Vietnam added 11.6 GW of solar in 2023, reaching 20 GW total
11
Global solar module production capacity exceeded 1 TW in 2023
12
US solar imports from SE Asia hit 80% of modules in 2023
13
Rooftop solar share in India grew to 14% of total solar capacity by 2024
14
Spain's solar boom added 4.4 GW rooftop in 2023
15
South Korea installed 3.2 GW solar in 2023, up 25%
16
Philippines solar capacity tripled to 1.5 GW in 2023
17
Saudi Arabia's solar tender awarded 2.8 GW at record low $0.0237/kWh in 2023
18
Global CSP capacity stood at 7.8 GW end-2023, with 0.5 GW added
19
Florida became #2 US solar state with 4.2 GW new installs 2023
20
Global solar jobs reached 4.3 million in 2022, growing to 5 million estimated 2023
21
Distributed solar generation in Brazil reached 25 GWdc end-2023
22
Japan's FY2023 solar approvals totaled 80 GW pipeline
23
Global off-grid solar market served 840 million people by 2023
24
US community solar grew 70% to 1.2 GW operational 2023
Interpretation
Market Growth And Adoption Interpretation
Solar adoption is accelerating fast, with global solar PV additions jumping 87% to 447 GW in 2023 and capturing 75% of all new renewable capacity added worldwide, underscoring rapid market growth across major regions.
05 · Category
Technological Efficiency23 stats
01
Commercial silicon solar cells achieved 25.7% efficiency record in 2023
02
Perovskite-silicon tandem cells hit 33.9% efficiency in lab conditions in 2024
03
TOPCon technology modules reached 22.8% efficiency in mass production in 2023
04
HJT modules achieved 23.6% efficiency commercially in 2023
05
Bifacial PERC modules average 21.5% efficiency with 70% bifaciality
06
Solar trackers increased yield by 25% on utility-scale projects in sunny regions
07
Energy storage paired with solar reached 4-hour duration at 85% round-trip efficiency
08
Thin-film CIGS modules hit 23.4% efficiency on lab cells in 2023
09
Global solar PV module shipment efficiency averaged 21.3% in 2023
10
Record monocrystalline silicon cell efficiency of 26.1% by LONGi in 2023
11
IBC solar cells achieved 27.0% efficiency in production modules 2023
12
Passivated back contact (PBC) tech boosts bifaciality to 85%
13
Quantum dot solar cells lab efficiency 19.1% in 2023
14
Organic PV modules certified at 12.8% efficiency commercially
15
Solar inverters reached 99.2% European efficiency standard in 2023 models
16
Half-cut cell modules reduce shading losses by 75%
17
Multi-busbar (MBB) tech increases power output by 5-10 W per panel
18
Concentrating PV (CPV) systems achieved 38.9% efficiency record 2023
19
SWCNT solar cells lab efficiency 19.3% thin-film 2023
20
Dye-sensitized solar cells stable at 14.3% efficiency 2023
21
Large-area perovskite modules 18.1% efficiency certified 2023
22
Shingled solar cells reduce resistive losses by 80%
23
DC optimizers improve yield by 5-25% in shaded residential systems
Interpretation
Technological Efficiency Interpretation
Technological Efficiency is steadily climbing as evidenced by record and commercial module gains, including 25.7% commercial silicon in 2023, 33.9% perovskite silicon tandem cells in 2024, and mass production TOPCon reaching 22.8% in 2023.
report visual · Comparison
Solar costs keep falling (LCOE, module prices, and financing)
Solar economics improved in 2023 as key costs—LCOE and module prices—fell sharply.
Solar module prices dropped to $0.11/Wp in Q4 2023, a 42% decline from Q1 202342%
Utility-scale solar PPA prices in the US averaged $24/MWh in Q3 2023, down from $30/MWh in 2022
$24
Global weighted average LCOE for utility-scale solar PV fell to $0.049/kWh in 2023, down 12% from 2022
12%
Utility-scale solar LCOE in China fell to CNY 0.24/kWh ($0.034/kWh) in 2023 bids
$0.034
Reference
Cite This Report
This report is designed to be cited. We maintain stable URLs and versioned verification dates. Copy the format appropriate for your publication below.
APA
Marcus Afolabi. (2026, February 13). Solar Energy Statistics. Gitnux. https://gitnux.org/solar-energy-statistics
MLA
Marcus Afolabi. "Solar Energy Statistics." Gitnux, 13 Feb 2026, https://gitnux.org/solar-energy-statistics.
Chicago
Marcus Afolabi. 2026. "Solar Energy Statistics." Gitnux. https://gitnux.org/solar-energy-statistics.
Sources & references
41 datasets cited across this report · attribution is report-level