GITNUX MARKETDATA
Browse Our Category
Sustainability In Industry
Latest update:


Scrap Metal Recycling Industry Statistics
See how the scrap metal recycling industry keeps the U.S. economy moving with 140,000 direct jobs in 2023 and 1.1 million roles across the wider supply chain alongside USD 117 billion in annual economic contribution, plus Europe’s EUR 45 billion and global CO2 savings from steel and aluminum recycling. Then compare what scrap yards pay out, how informal work formalizes in places like India, and why recycling steel can cut energy use by 74 percent, revealing a scale of impact that looks far bigger than landfill diversion.

Sustainability In The Supplement Industry Statistics
The page connects today’s policy pressure, emissions reality, and ingredient sourcing constraints to explain why sustainability is no longer a “nice to have” in supplements, from CBAM and the EU ETS to agriculture driving about 9.3% of global greenhouse gas emissions. With the global dietary supplements market projected to reach $459.2 billion by 2030 and respondents pushing companies to act on environmental issues, you get the hard edges behind what it will take to source, manufacture, and package responsibly.

Sustainability In The Information Industry Statistics
E-waste is surging while recycling trails far behind, with only 22.3 percent of global e-waste formally recycled in the most recent year and 48 million tons unmanaged. Then the page shifts to power, water, and emissions, showing why data centers can still be both cleaner and cleaner resources, as renewables reach 23 percent of global data center energy in 2022 while electricity demand keeps climbing.

Sustainability In The Water Industry Statistics
IPCC AR6 projects sea level rise could salinize 1.8 billion people’s freshwater sources by 2050, while water industries worldwide still face a 2025 reality of damage that averages $170 billion each year from climate disasters 2010 to 2019. This page turns those risks into workable signals, pairing storage and runoff declines with the fastest efficiency and treatment wins like 20 to 30% water loss savings from AI leak detection and next generation reuse that is cutting energy and chemicals.

Sustainability In The Airline Industry Statistics
See how, despite a 34% improvement in CO2 emissions per revenue tonne kilometre from 2005 to 2019, aviation’s climate impact is still shaped by non CO2 effects and hard to measure tradeoffs like contrails and induced cirrus. Follow the shift to enforceable accountability mechanisms, where ReFuelEU Aviation scoring links SAF performance to compliance value per kg CO2e reduced and life cycle rules demand at least 50% cuts, alongside CORSIA and EU ETS MRV that turn climate claims into audited reductions.

Sustainability In The Toy Industry Statistics
Toy sustainability isn’t stuck in nice promises, recycling and leakage are still driving the hard numbers, with only 32.3% of plastic packaging recycled in the EU and 14% of global plastic waste leakage tied to “household and packaging” categories that include toy packaging. From 36% of US toy recalls and 22.1% of global municipal solid waste being plastics to consumer pressure where 67% consider environmental impact and 91% of toy professionals say sustainability is built into strategy, these 2025 level signals explain exactly where toy materials, chemicals, and end of life outcomes are most at risk.

Sustainability In The Ecommerce Industry Statistics
E-commerce is already pushing 1.8 billion metric tons of CO2e into the atmosphere and its emissions keep compounding through last mile delivery, returns, and even the energy draw of data centers, with logistics emissions projected to reach 15 to 20% of global logistics by 2030 if nothing changes. Scroll for the sharp contrasts and practical pressure points behind the figures, from reverse logistics adding up to 2.5 kg CO2e per returned item to packaging and infrastructure waste that is still largely single use and under recycled.
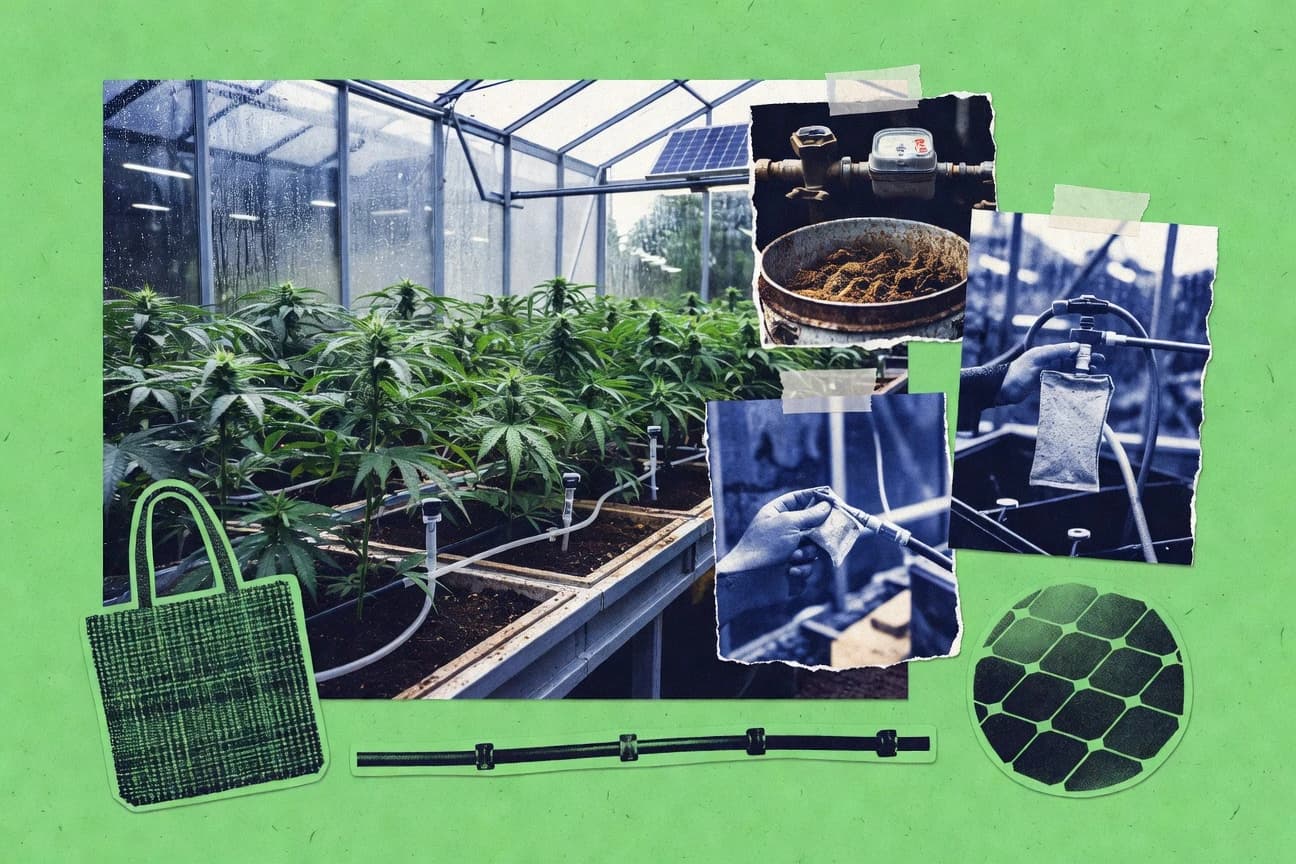
Sustainability In The Cannabis Industry Statistics
With indoor cultivation reported at 9.6 kg CO2e per kg dried cannabis and outdoor at just 2.0 kg CO2e, this page makes one question impossible to ignore: what are you actually saving when growing choices shift across the grid and the supply chain. It also ties market momentum and policy leverage to measurable action, from electricity demand and waste impacts to sustainability KPI adoption, so operators can spot where investment can cut footprint fastest.

Sustainability In The Logging Industry Statistics
From 95% natural regeneration in FSC certified forests to 20% of old growth set aside in US national forests, these 2025 and newer snapshots show how well managed logging can protect wildlife rather than erase it. You will also see the climate payoff alongside biodiversity results, including global sustainable forestry avoiding 4 Gt CO2e emissions since 2000 and a 30% lower harvesting emissions rate for certified tropical operations.
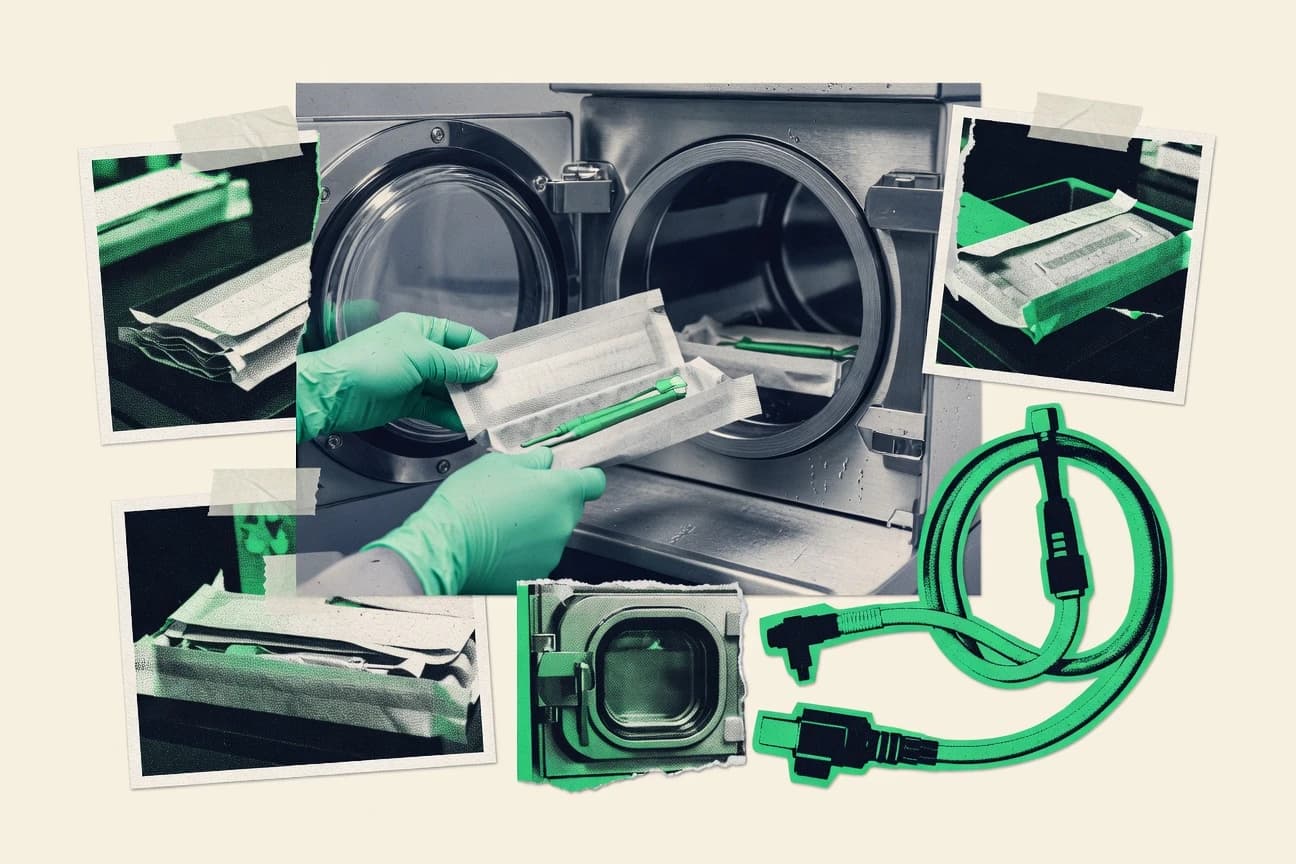
Sustainability In The Dental Industry Statistics
What surprised dentists and patients most is that 44% say they are concerned about the environmental impact of healthcare services, while the sector still generates major emissions and regulated waste. This page pulls together the latest bench marks on dental care from 2019 CO2e estimates to 2023 renewable energy adoption and the practical levers that can cut regulated waste, packaging, and utilities without compromising infection control.
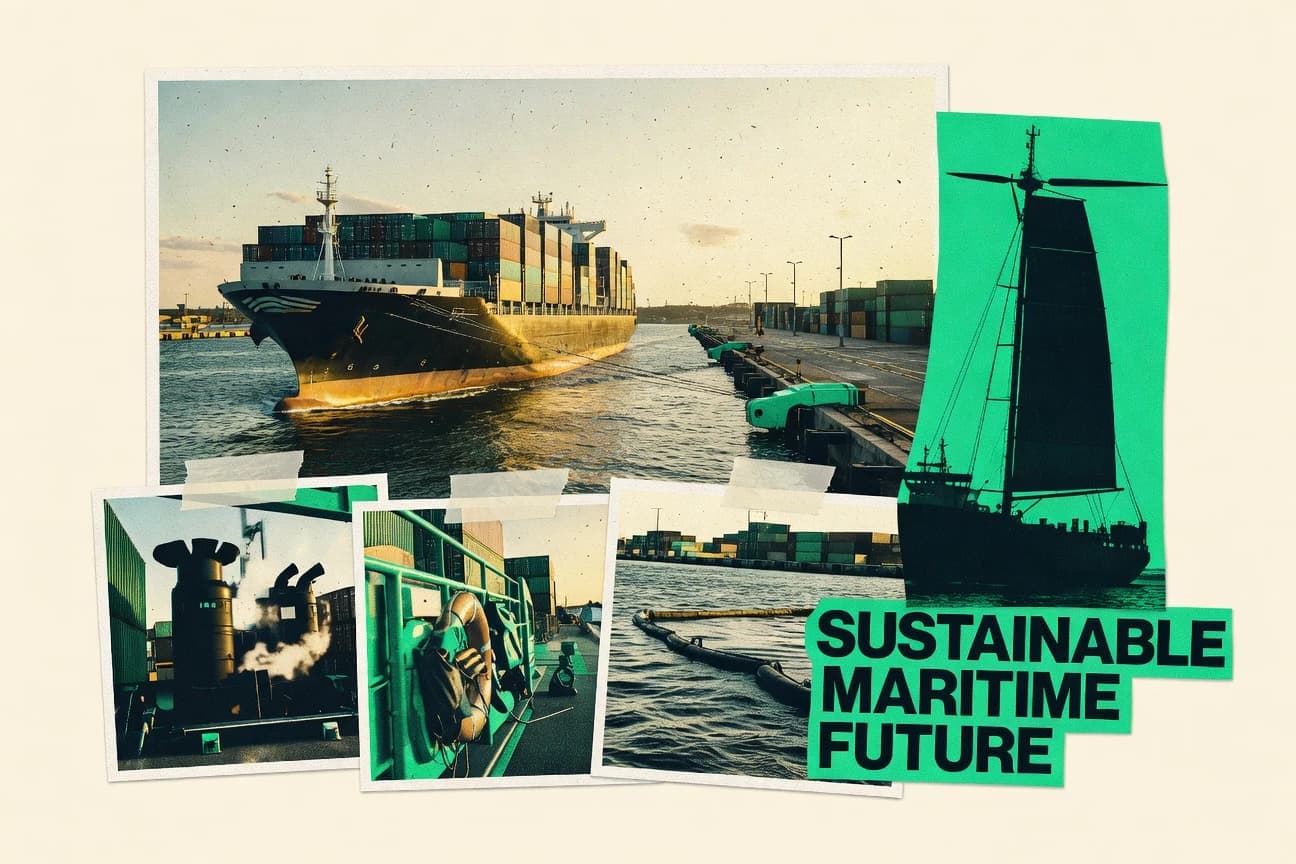
Sustainability In The Maritime Industry Statistics
Ship traffic is reshaping marine life at scale, from 10% of reef damage near shipping lanes to light pollution that disorients 50% of hatchling sea turtles and ghost gear that traps 640,000 tonnes of fish every year. Yet progress is tangible with 95% EEXI compliance for monitored vessels by mid 2023 and fuel saving gains from measures like slow steaming, giving you a clear look at what is harming ecosystems and what can still be changed fast enough.

Sustainability In The Cloud Computing Industry Statistics
Even with 99.9% of Microsoft’s datacenter electricity matched with renewables by 2023, energy use is still being pulled by cooling and power, with about 50% of a typical data center’s energy tied to those systems, so the real question is where the emissions actually shift. This page connects that tension to 2025 level relevance through energy aware scheduling, carbon aware orchestration, and supplier driven scrutiny to show how cloud can cut carbon while handling growing power demand and tightening efficiency rules like EU reporting.
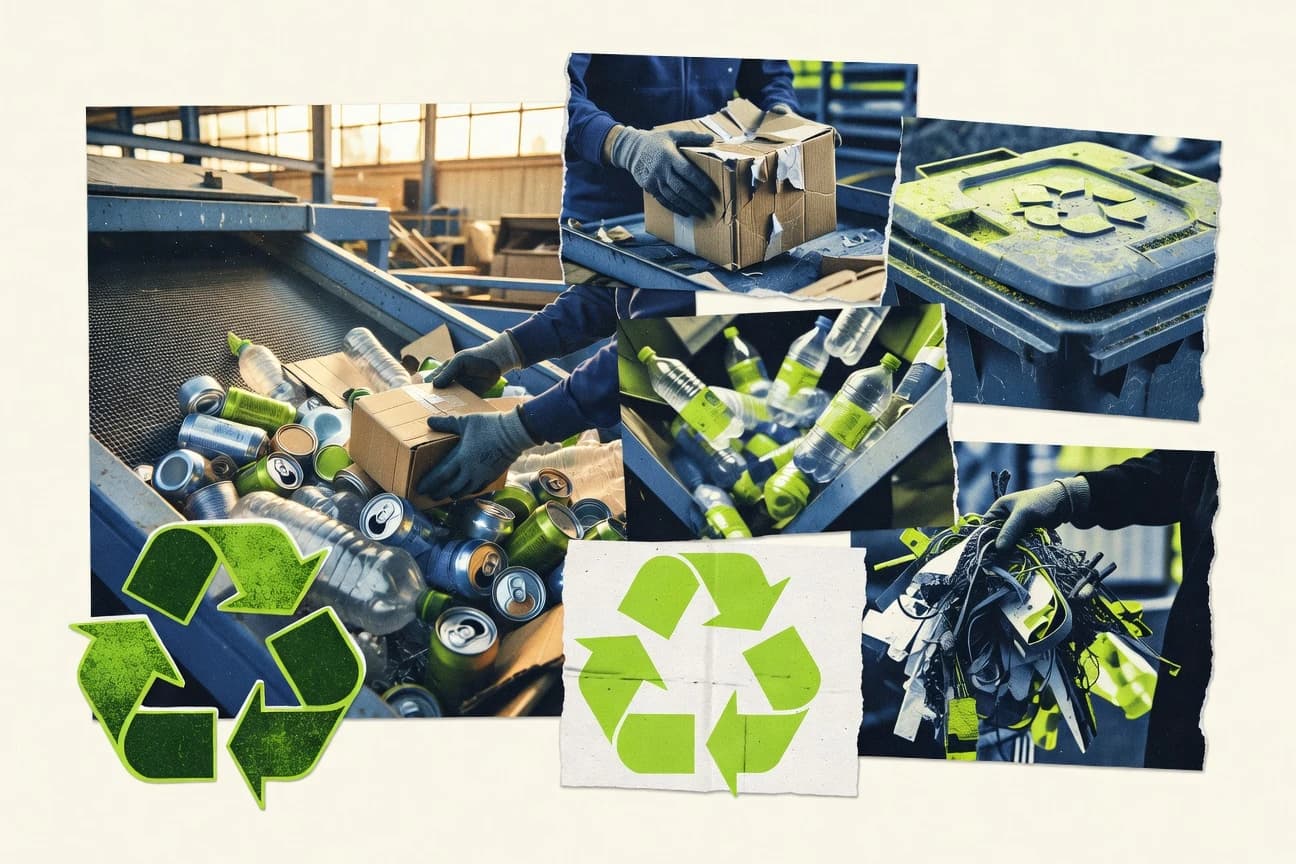
Waste And Recycling Industry Statistics
From US recycling access reaching 90% of households to a global recycling rate of just 11.7% for municipal waste in 2019, these waste and recycling industry statistics put the biggest bottlenecks side by side with what they cost and how they change emissions. You will also see how landfilling and plastics drive climate impacts, alongside safety figures that flag higher injury and respiratory risks for waste workers.

Sustainability In The Wedding Industry Statistics
At the US level, the median 2023 wedding cost of $30,000 sits beside an estimated $35.4 billion industry spend, making it easier to see where “sustainable add-ons” like rentals and eco stationery can actually fit. Meanwhile, the data tension is hard to ignore 1.8 billion pounds of US textile waste each year and food systems driving 1.6 billion metric tons of CO2e globally through all stages, so the page connects styling choices, packaging, and meal planning to measurable climate and landfill outcomes.

Sustainability In The Game Industry Statistics
Why do game emissions often trace back to data centers and cloud, where IPCC-aligned accounting points to a huge CO2 footprint and methane matters for Scope 3 calculations, even as studios push greener rendering techniques that can cut GPU rendering energy by 20 to 50% and dynamic scaling by 30 to 60%. The page also ties those practical fixes to what will be reported next, from EU CSRD requirements starting with financial years from 2024 to California’s SB 253 Scope 1 to 3 disclosures beginning for emissions occurring in 2025 and filed in 2026.
Sustainability In The Food Processing Industry Statistics
Food processing is responsible for 26% of global food related greenhouse gas emissions, even before you add the spillover from agriculture and land use, so this page connects where climate impact is made with what levers actually cut it. You will also see why process heating dominates energy demand with 48% of energy use and how 2023 to 2026 EU rules like CBAM reporting reshape investment choices, alongside packaging and food waste targets that aim to turn losses into lower emissions.

Sustainability In The Digital Marketing Industry Statistics
With 2023 already placing digital advertising at roughly 5.5% of global emissions, this page contrasts where the carbon piles up, from video and RTB bidding to always on data storage, and why energy use can double just from how ads load. You will see the 2025 facing reality in the scale and structure of the footprint, including how programmatic advertising drives 82% of digital ad emissions and how greener formats and tracking shifts can cut tens of terawatt hours.
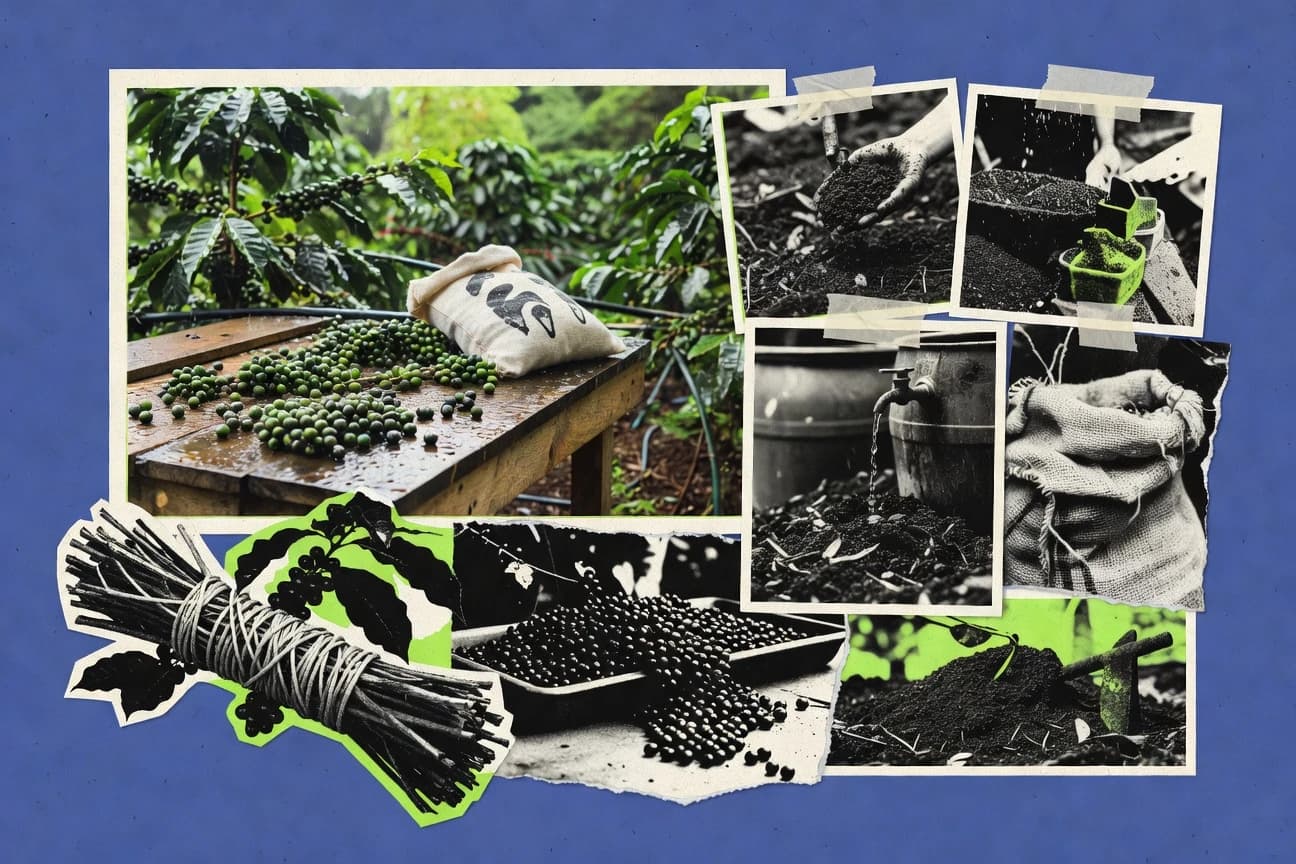
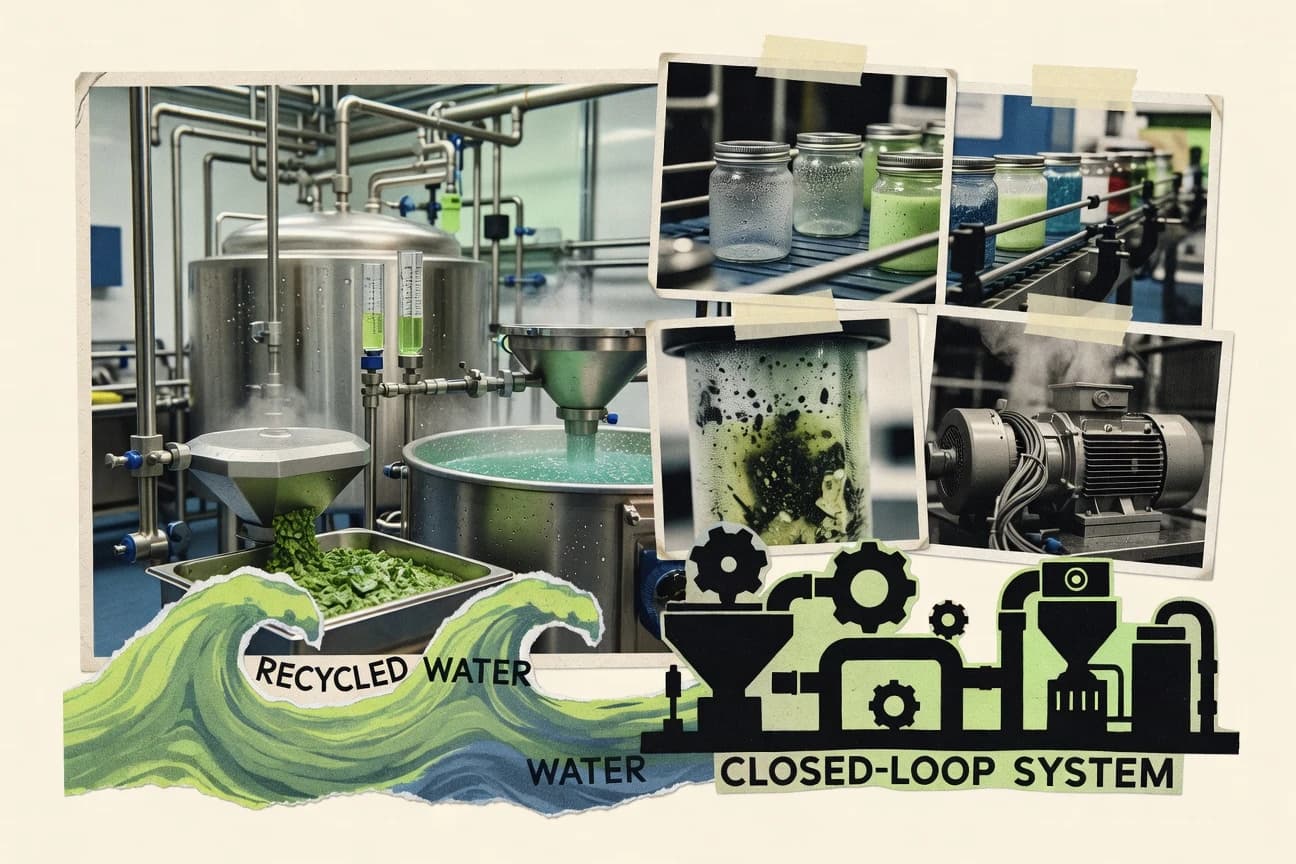
Sustainability In The Coffee Industry Statistics
A current spread of sustainability signals shows why coffee must decarbonize and adapt fast, from projected 1.6°C warming under today’s NDC path to models that cut suitable Arabica area by 50% as heat stress climbs. Follow how the biggest levers are often non-farm, such as processing and upstream logistics driving 35% of coffee life cycle GHG emissions and wastewater and traceability changes reshaping water, air, and compliance outcomes for supply chains.

Sustainability In The Food Service Industry Statistics
Restaurants are feeling the heat from customers and from physics at the same time, with 56% of diners factoring sustainability into where they eat and global food loss and waste driving roughly 8% to 10% of greenhouse gas emissions. This page connects that pressure to what is actually changing fast in foodservice, from electrification and energy controls that can cut restaurant energy use by about 10% to 20% to packaging and composting markets now scaling toward the next wave of recyclable and diversion-ready operations.

Sustainability In The Entertainment Industry Statistics
See how entertainment’s sustainability pressure is rising fast, from 74% of consumers willing to switch for better environmental reputations to producers ranking energy use on set at 31%. The page also connects the power and packaging realities behind streaming and venues, including renewables powering growth toward 30.8% of global electricity, and the operational carbon cuts Netflix and Warner Bros. Discovery have already demonstrated.