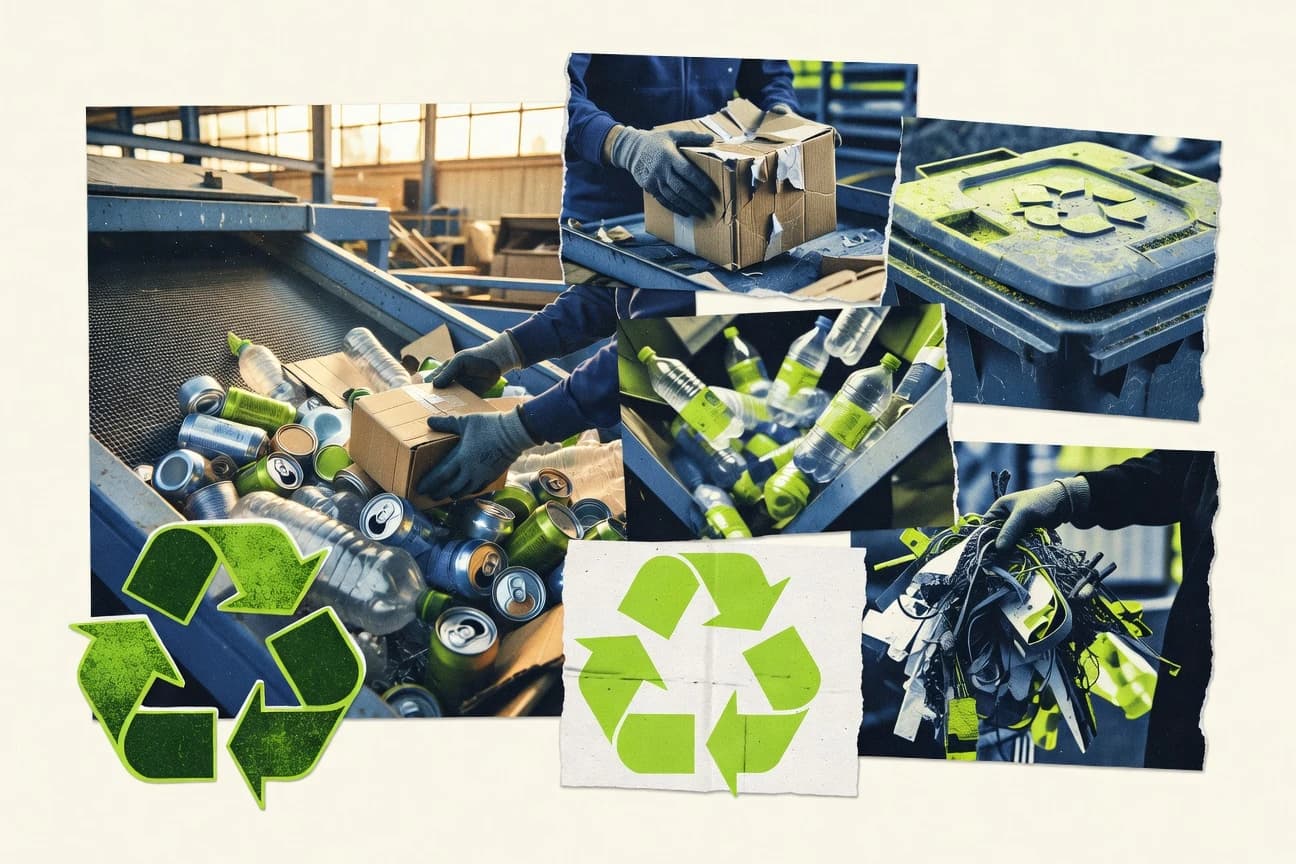

By 2050, current policies are projected to leave 1.1 billion tonnes of municipal waste destined for landfill, even as parts of the system keep improving. Recycling coverage in the US reaches about 90% of households, yet only 11.7% of municipal waste is recycled globally, and that gap shows up in emissions, costs, and worker health. This post pulls together the latest cross sector statistics across landfilling, recycling, packaging rules, market sizing, and occupational impacts so you can see where progress is real and where it still stalls.
Key Takeaways
- 1.1 billion tonnes of municipal waste projected globally to be landfilled by 2050 under current policies
- 17% of solid waste is not safely managed globally (World Bank)
- The global recycling rate for municipal waste was 11.7% in 2019 (global recycling share).
- 12.3 million tonnes of food waste generated in the US in 2018 (EPA)
- 1.8% of all deaths in the US in 2020 were attributed to waste-related air pollution exposure (estimate).
- $12.9 billion estimated annual economic cost of marine plastic leakage globally (2019)
- 90% of US households have access to municipal recycling programs (NRRA)
- $7.5 billion capital spending by US waste and recycling services in 2023 (SEC/US sector disclosures cited by S&P Global)
- The US generated 292.4 million tons of municipal solid waste in 2018 (US total).
- The EU generated about 253 million tonnes of municipal waste in 2022 (latest estimate).
- The EU Waste Framework Directive sets a 2020 target of 50% municipal waste for preparation for reuse and recycling
- The EU Packaging and Packaging Waste Directive requires that 65% of packaging waste be recycled by weight by 2020
- A 2020 meta-analysis found that recycling programs can reduce municipal waste-related greenhouse gas emissions by 10–30% versus landfilling (published synthesis range)
- Landfilling can emit methane with global warming potential that is ~28–34 times higher than CO2 over 100 years (IPCC AR5 factor used in climate accounting)
- Incineration with energy recovery has net life-cycle greenhouse gas benefits of roughly 0–0.8 tCO2e per ton compared with landfilling in several European LCA studies (published study range)
Better recycling and waste management can cut emissions, costs, and injuries while reducing landfill dependence worldwide.
Related reading
01 · Category
Industry Trends3 stats
01
1.1 billion tonnes of municipal waste projected globally to be landfilled by 2050 under current policies
02
17% of solid waste is not safely managed globally (World Bank)
03
The global recycling rate for municipal waste was 11.7% in 2019 (global recycling share).
Interpretation
Industry Trends Interpretation
With only 11.7% of municipal waste recycled in 2019 and 17% of solid waste not safely managed worldwide, industry trends point to a widening reliability gap as current policies could still send 1.1 billion tonnes of municipal waste to landfills by 2050.
02 · Category
Performance Metrics2 stats
01
12.3 million tonnes of food waste generated in the US in 2018 (EPA)
02
1.8% of all deaths in the US in 2020 were attributed to waste-related air pollution exposure (estimate).
Interpretation
Performance Metrics Interpretation
In performance metrics terms, the Waste and Recycling industry faces a major scale challenge with 12.3 million tonnes of US food waste generated in 2018 while waste-related air pollution was estimated to contribute to 1.8% of US deaths in 2020.
03 · Category
Cost Analysis1 stats
01
$12.9 billion estimated annual economic cost of marine plastic leakage globally (2019)
Interpretation
Cost Analysis Interpretation
The estimated $12.9 billion annual economic cost of marine plastic leakage globally in 2019 underlines how waste and recycling issues carry massive financial consequences, making cost analysis a critical lens for prioritizing interventions.
04 · Category
User Adoption1 stats
01
90% of US households have access to municipal recycling programs (NRRA)
Interpretation
User Adoption Interpretation
With 90% of US households having access to municipal recycling programs, user adoption appears strongly supported by broad availability rather than limited access.
05 · Category
Market Size6 stats
01
$7.5 billion capital spending by US waste and recycling services in 2023 (SEC/US sector disclosures cited by S&P Global)
02
The US generated 292.4 million tons of municipal solid waste in 2018 (US total).
03
The EU generated about 253 million tonnes of municipal waste in 2022 (latest estimate).
04
The global waste-to-energy (WTE) capacity was about 48 GW in 2023 (installed WTE capacity estimate).
05
The global waste management services market was valued at US$365.0 billion in 2023 (market value estimate).
06
The global hazardous waste management market was valued at US$95.0 billion in 2023 (market value estimate).
Interpretation
Market Size Interpretation
In terms of market size, the sector is scaling strongly with the global waste management services market reaching US$365.0 billion in 2023 and global hazardous waste management at US$95.0 billion, alongside growing system demand reflected by 292.4 million tons of US municipal solid waste in 2018 and about 253 million tonnes of EU municipal waste in 2022.
More related reading
06 · Category
Policy & Regulation2 stats
01
The EU Waste Framework Directive sets a 2020 target of 50% municipal waste for preparation for reuse and recycling
02
The EU Packaging and Packaging Waste Directive requires that 65% of packaging waste be recycled by weight by 2020
Interpretation
Policy & Regulation Interpretation
Under Policy and Regulation, the EU is pushing ambitious recycling targets with 50% of municipal waste slated for preparation for reuse and recycling by 2020 and 65% of packaging waste by weight required to be recycled by the same year.
07 · Category
Environmental Impact4 stats
01
A 2020 meta-analysis found that recycling programs can reduce municipal waste-related greenhouse gas emissions by 10–30% versus landfilling (published synthesis range)
02
Landfilling can emit methane with global warming potential that is ~28–34 times higher than CO2 over 100 years (IPCC AR5 factor used in climate accounting)
03
Incineration with energy recovery has net life-cycle greenhouse gas benefits of roughly 0–0.8 tCO2e per ton compared with landfilling in several European LCA studies (published study range)
04
In a global modeling study, achieving higher recycling rates for plastics could avoid 2.4–4.0 GtCO2e annually by 2040 (scenario modeling result)
Interpretation
Environmental Impact Interpretation
From an Environmental Impact perspective, better recycling can cut municipal waste greenhouse gas emissions by 10–30% versus landfilling, and scaling plastics recycling could prevent 2.4–4.0 GtCO2e each year by 2040.
09 · Category
Economic Metrics5 stats
01
$84.7 billion global waste management market size in 2024 (market value estimate)
02
$58.3 billion global waste recycling market size in 2024 (market value estimate)
03
$23.1 billion global recycling equipment market in 2023 (market value estimate)
04
€1.8 billion EU investment in recycling infrastructure under Recovery and Resilience Facility (allocated funding amount cited by EC)
05
A 2023 study estimated that improved waste sorting could yield economic benefits of $7–14 per ton of waste processed in Europe (cost-benefit estimate)
Interpretation
Economic Metrics Interpretation
In 2024 the global waste management market is valued at $84.7 billion and recycling at $58.3 billion, indicating that the economic pull is moving strongly into recycling and related infrastructure, especially with the EU allocating €1.8 billion to build it through Recovery and Resilience funding.
Reference
Cite This Report
This report is designed to be cited. We maintain stable URLs and versioned verification dates. Copy the format appropriate for your publication below.
APA
Nathan Caldwell. (2026, February 13). Waste And Recycling Industry Statistics. Gitnux. https://gitnux.org/waste-and-recycling-industry-statistics
MLA
Nathan Caldwell. "Waste And Recycling Industry Statistics." Gitnux, 13 Feb 2026, https://gitnux.org/waste-and-recycling-industry-statistics.
Chicago
Nathan Caldwell. 2026. "Waste And Recycling Industry Statistics." Gitnux. https://gitnux.org/waste-and-recycling-industry-statistics.
Sources & references
31 datasets cited across this report · attribution is report-level
+13 additional datasets cited (not shown individually)