GITNUX MARKETDATA
Browse Our Category
Supply Chain In Industry
Latest update:

Supply Chain In The Defense Industry Statistics
See how defense logistics and compliance are getting squeezed and rebuilt at the same time, from DoD cloud data sharing speeding up 4x to 67% of suppliers needing CMMC 2.0 compliance by 2025. The page also tracks major contract wins and market totals, including $450 billion in US defense supply chain spending in FY2023 and a global defense supply chain market valued at $1.2 trillion in 2022.

Supply Chain In The Staffing Industry Statistics
Supply Chain In The Staffing Industry tracks how fast freight and fulfillment realities are reshaping staffing demand, with 2025 figures showing the tightest balancing act yet between lead times and order flow. If you hire, source, or plan capacity, these statistics will help you spot where disruptions move from logistics to workforce gaps before they hit your schedules.

Supply Chain In The Electrical Industry Statistics
With global container port throughput still climbing 3.4% in 2023 while electrical machinery imports hit $118.08 billion in 2023, the page shows how inbound ocean freight, software, and warehouse systems are being pressured to keep up. It also connects geopolitics driven disruption hitting 96% of buyers and cybersecurity spending rising 62% in 2023 to the downstream electrification demand that is widening by about $55 billion a year, including the sustainability shift from battery regulation.
Supply Chain In The Power Industry Statistics
Transformer lead times have stretched from sub 40 weeks to over 60 weeks, even as grid builders face mounting material and software spend that now spans $38.6 billion in automation and $5.1 billion in supply chain analytics demand. See how utilities are clawing back performance with VMI and risk based sourcing, from 48% hitting better OTIF to 26% less expedited freight, while the installed base of 230 plus million distribution transformers keeps replenishment stakes painfully high.
Supply Chain In The Tech Industry Statistics
Forecasts point to 3% average real growth in world merchandise trade volume from 2025 to 2027, while IT spending hits US$ 5.1 trillion in 2024 and visibility software grows to a US$ 7.1 billion global market, setting the stage for tech supply chains to scale even as disruptions keep costing an estimated US$ 3.6 trillion a year. You will also see how 38% of companies use or plan digital twins and why 21% say geopolitics is reshaping their planning, alongside hard hits from customs and logistics emissions.

Supply Chain In The Video Game Industry Statistics
PC download and update spending climbs past $5.0 billion annually in 2023, yet the real strain comes from the logistics and security layers that power it, from 20–30% freight and supply chain cost pressure to $4.88 million average data breach costs. This page connects cloud and asset workflows to patch sizes, inventory turns, and even ransomware impact, so you can see where shipping, risk, and waste suddenly turn into balance sheet decisions.
Supply Chain In The Wellness Industry Statistics
See how wellness demand meets logistics reality, with 8.2% growth projected for the global logistics market through 2026 alongside transport driving 8.2% of greenhouse gas emissions and 67% of teams saying advanced tracking improved day to day visibility. From cold chain temperature excursions and 31% of supplement brands reporting stockouts to 61% of healthcare orgs running formal risk programs, these statistics explain exactly where wellness supply chains gain resilience and where they still break.
Supply Chain In The Hospitality Industry Statistics
With 2025 proof that supply chain friction is no longer a hidden cost, these hospitality statistics lay out exactly where delays, supplier volatility, and inventory gaps hit rooms, dining, and revenue. You will see the sharp contrast between what hotels plan for and what actually lands, with 2025 figures that make the operational risk hard to ignore.
Supply Chain In The Building Industry Statistics
Buildings drive 34% of final energy use and 38% of US greenhouse gas emissions, so the real decarbonization work is upstream in energy and materials supply chains. From logistics costs worth 1.5% of global GDP and volatile steel and cement procurement to delays reported by 38% of construction respondents and AI adoption growing to 55% of supply chain leaders planning or using it for demand forecasting, this page shows why schedule certainty and emissions reductions rise and fall together.

Supply Chain In The Hotel Industry Statistics
What does hunger on a global scale, ocean plastic, and hotel food waste have to do with the same supply chains? This page weighs 2025 and latest available figures, including that 87% of supply chain leaders prioritize resilience and food waste costs about 2.5% of hotel revenue, to show where hospitality can cut disruption, packaging waste, and wasteful ordering without sacrificing guest experience.
Supply Chain In The Telecom Industry Statistics
See how telecom supply chain performance is being stress tested by 2025 procurement and logistics realities, and what it means when lead times, inventory choices, and supplier reliability move in opposite directions. The page puts hard 2025 metrics side by side so you can spot where cost pressure is easing while service risk quietly rises.

Supply Chain In The Banking Industry Statistics
When 85% of banks faced supply chain disruption, the real pressure was felt by operations and technology, with 25% reporting severe impacts and 30% saying disruptions hit their tech and operations directly. This page connects that disruption to third party risk, cloud and visibility spending, and compliance requirements, including $14.2 billion expected for banking third party risk management software in 2024 and guidance like NIS2 and Basel that make resilience a regulated necessity.

Supply Chain In The Clothing Industry Statistics
See how production lead times, inventory risk, and shipment volatility reshaped the clothing supply chain, with 2025 figures showing tighter margins than many expect. The statistics lay out the uncomfortable trade between faster fulfillment and higher logistics pressure so you can spot where sourcing strategy is getting ahead or falling behind.
Supply Chain In The 3Pl Industry Statistics
With global logistics services projected to grow at a 16% CAGR through 2032, 3PLs are under pressure to deliver measurable outcomes fast, from a 2.6x faster order cycle with automated picking to up to 30% fewer order cycle delays through predictive inventory placement. The page connects the technology bets and sustainability expectations behind those gains, so you can see why shippers increasingly choose providers for tech and data quality, not just capacity.
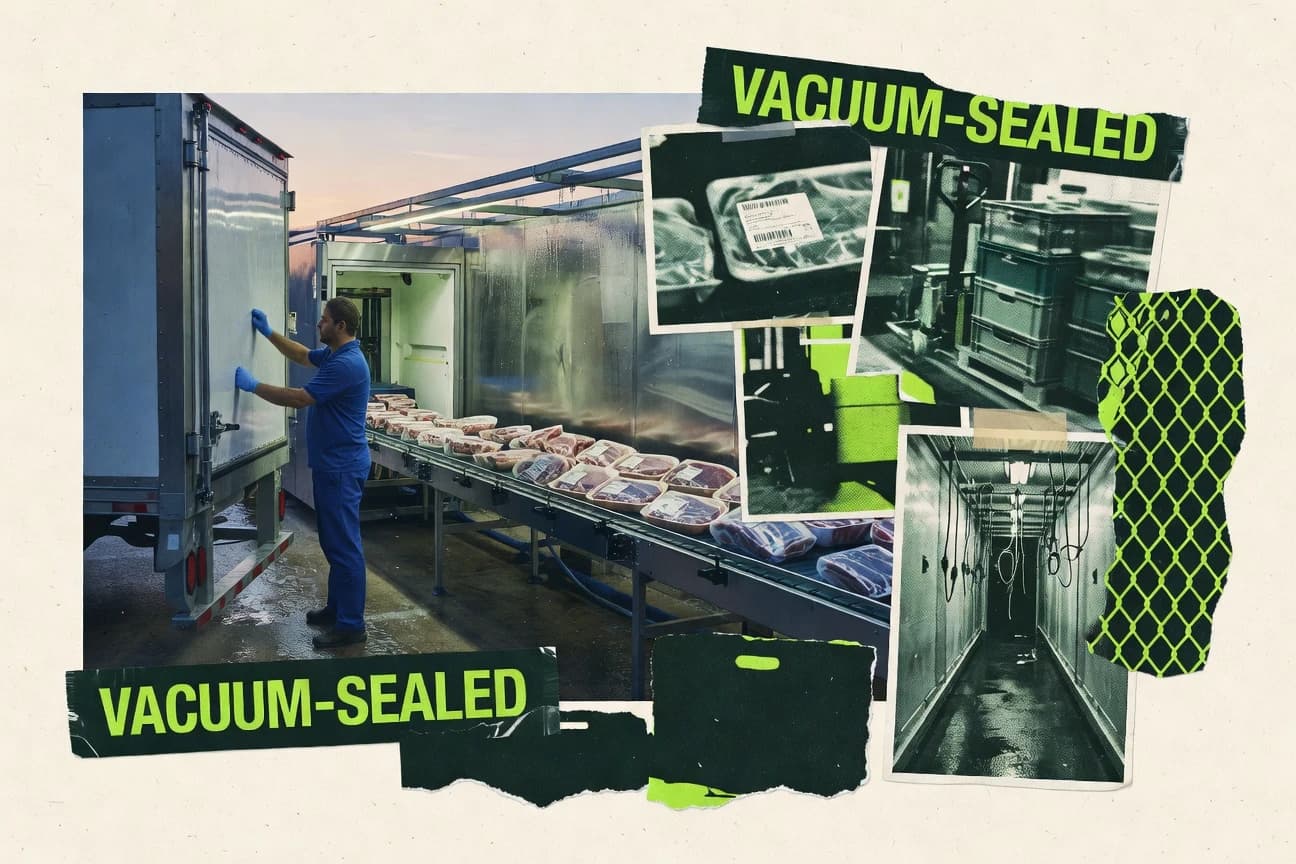
Supply Chain In The Meat Industry Statistics
Cold chain momentum in meat supply chains is growing steadily with a 2.6% projected CAGR through 2034 while compliance hinges on holding temperature, yet losses still start long before retail with 8.6% of global food value slipping away in upstream stages. From 98% cold chain dependence on last mile temperature to how real time visibility and RFID adoption can cut costs, this page puts meat cold chain risk and technology in sharp, actionable contrast.
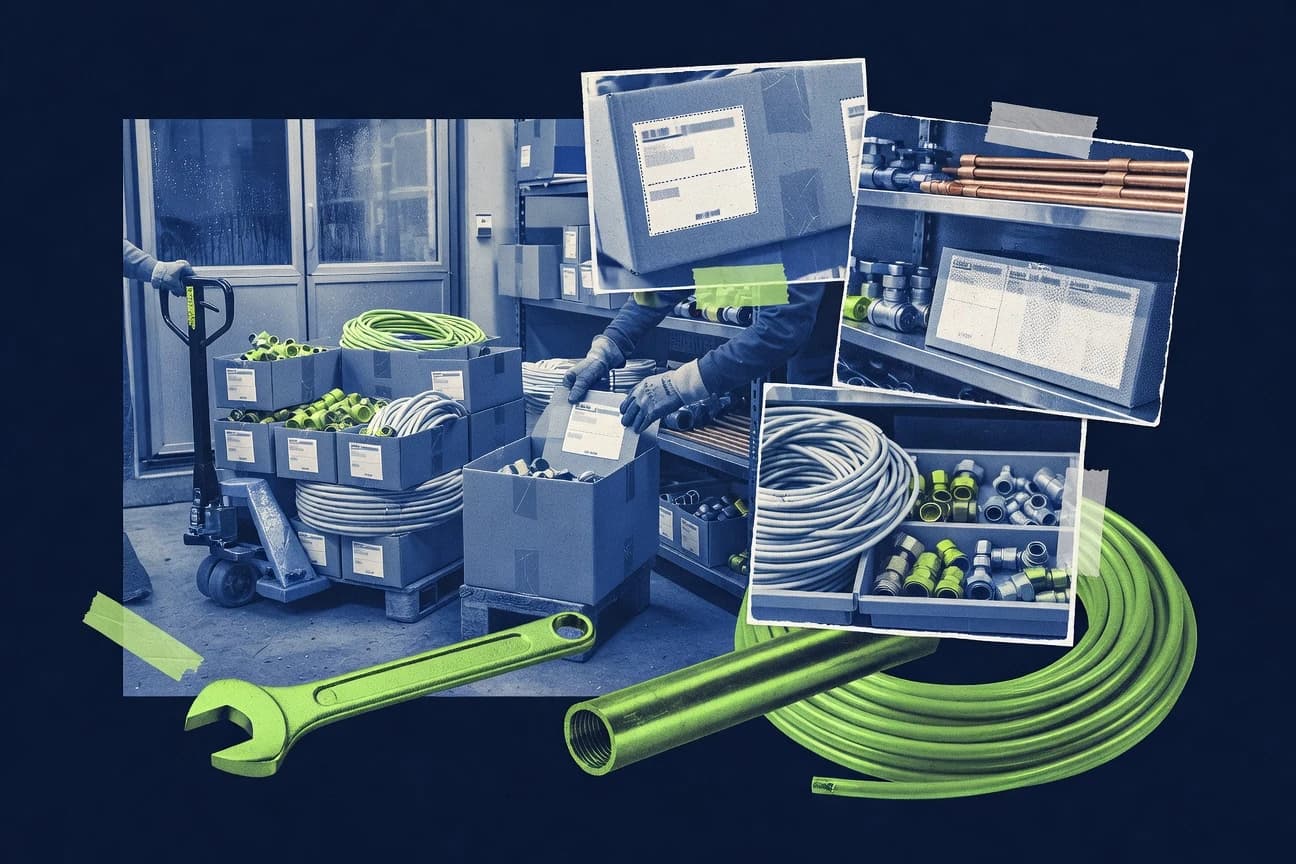
Supply Chain In The Plumbing Industry Statistics
As labor and materials pressures keep squeezing plumbing contractors, the 2025 statistics in this page track how lead times, inventory swings, and supplier reliability actually changed and what that means for getting jobs done on schedule. See the sharp contrast between what suppliers promise and what the flow of parts reveals, plus the specific metrics teams use to reduce costly downtime.
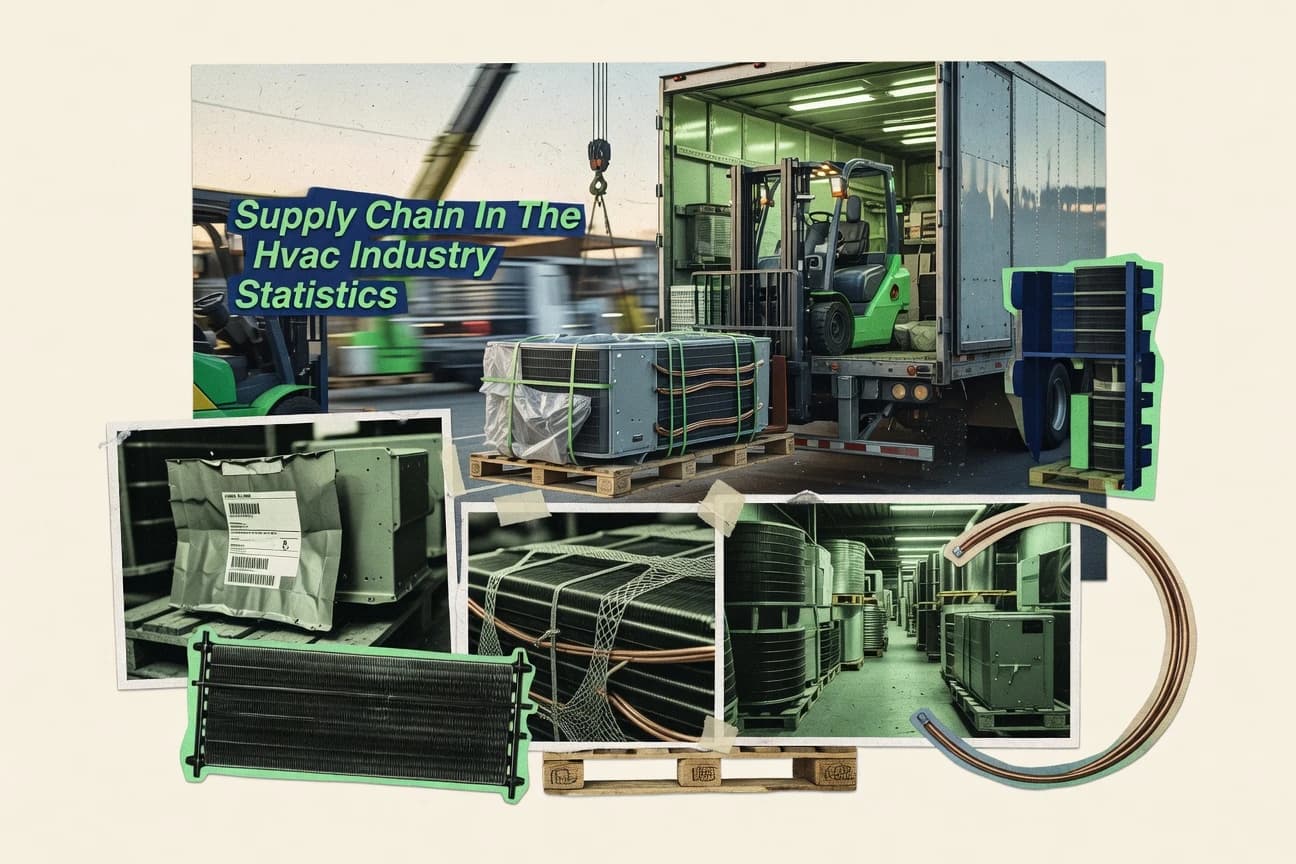
Supply Chain In The Hvac Industry Statistics
HVAC supply chains are being squeezed from every direction at once, from 27% of surveyed HVAC/R organizations saying disruptions hit on time deliveries to 11% of US warehouse space being newly delivered in 2023, which should help yet also raises the pressure on regional inventory timing. You will also see how the shift in refrigerants and costs, including 2025 and ahead compliance timelines and rising freight and copper pressures, is changing procurement decisions long before projects ever break ground.
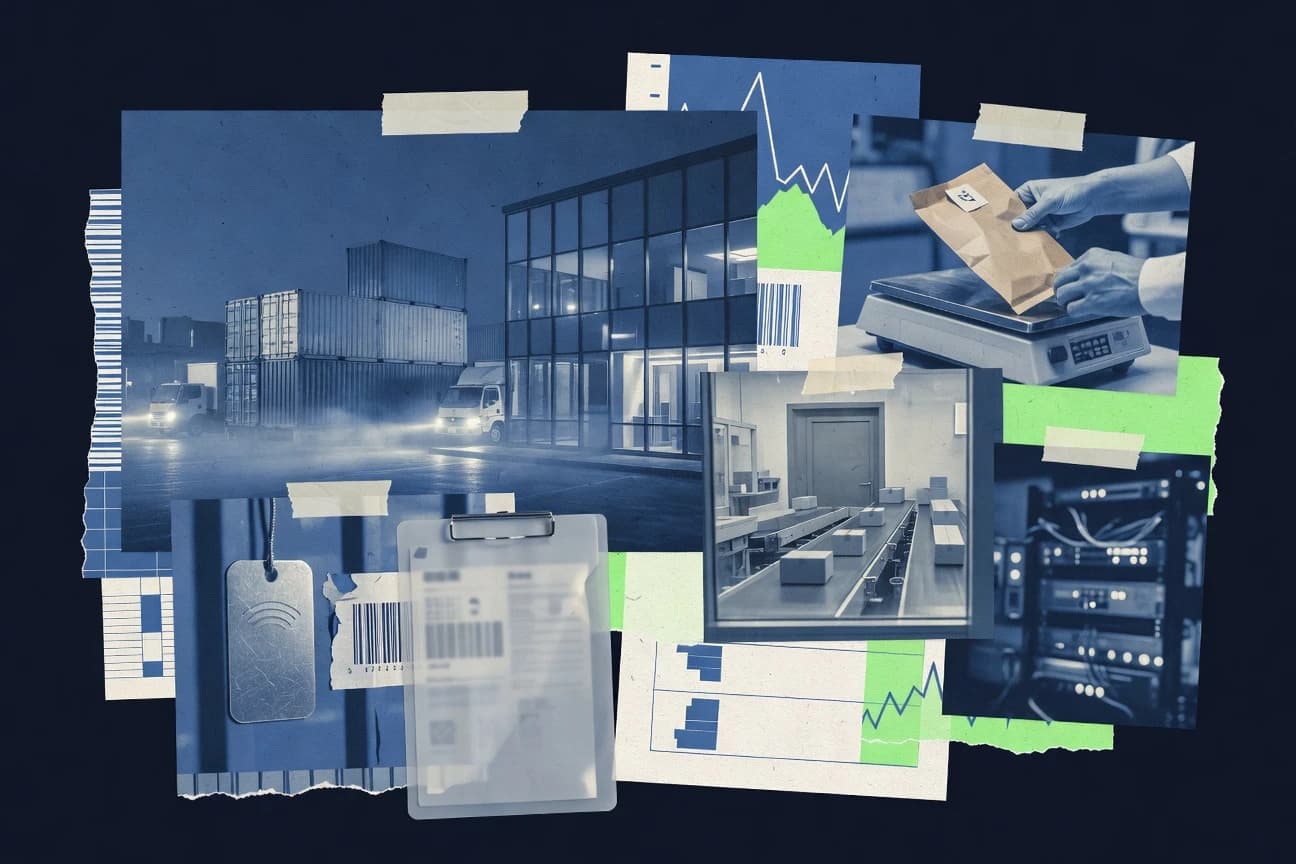
Supply Chain In The Finance Industry Statistics
Supply chain leaders and finance teams are being asked to manage supplier risk with less visibility than they need, even as markets are funding the tools. See how a 2024 view of readiness and automation stacks up against the hard scale of trade and supply chain finance, from analytics and TPRM to verification, APIs, and blockchain.

Supply Chain In The Liquor Industry Statistics
Cold chain, port dwell time, and labor constraints are reshaping liquor distribution, with smart logistics reaching $4.9 billion in 2023 and freight visibility cutting transportation costs by 10% while improving ETA accuracy through route tracking. See how 36% forecast accuracy lifts from demand sensing and rising warehousing costs are changing replenishment and service, with global trade disruption worth $2.3 trillion tied to container shortages and congestion.

Supply Chain In The Multifamily Industry Statistics
See how multifamily supply chain decisions are reshaping cost, timing, and reliability with a sharper 2025 snapshot than most benchmarking still uses. You will find the tension between faster delivery expectations and the operational realities that can stall projects, plus the metrics leaders track to keep occupancies on schedule.