GITNUX MARKETDATA
Browse Our Category
Supply Chain In Industry
Latest update:


Supply Chain In The Diamond Industry Statistics
Follow how polishing dominance and technology reshape the value chain, from Surat finishing 90% of the world’s diamonds by volume to polished throughput driven by 70% laser adoption and yields averaging 57% from rough. The page also tracks the supply pressure behind demand and price swings with rough prices up to a 30% shift in 2022 to 2023, revealing why mined volumes, trade hubs, and ethical and traceability rules now determine who profits from every carat.

Supply Chain In The Fintech Industry Statistics
Cyber risk and trade friction are hitting fintech supply chains where the money moves, with average data breach costs for financial services at US$6.7 million in 2023 and customs delays driving a 14% cost increase for supply chain managers. At the same time, automation and digital identity are cutting onboarding and KYC compliance costs by 30% and payment disputes by $2.3 billion, showing the sharp tradeoff between preventable human entry points like phishing and the operational leverage fintech can still apply.

Supply Chain In The Secondary Industry Statistics
U.S. organizations are still feeling the hit as 74% report supply chain disruptions have had a financial impact, turning uncertainty into costs that global estimates place at $2.4 trillion annually. For secondary industries, the pinch shows up in practical places like transportation and network design complexity, port congestion delays, and a persistent visibility gap in tier 2 and beyond that is raising delay risk while firms race to modernize inventory planning and logistics systems.

Supply Chain In The Agricultural Industry Statistics
Cold chain and logistics pressures are rising fast, with the global cold chain market projected to reach $372.3 billion by 2030 and lack of visibility still flagged by 53% of professionals as the top operational challenge. This page connects software and traceability adoption, where digital controls can cut compliance costs by 5 to 10%, to the real-world price of food loss and time temperature abuse that can quietly reshape agricultural supply chain performance.

Supply Chain In The Cleaning Industry Statistics
With 8.1% of U.S. small businesses still naming supply chain disruptions as a significant problem and 45% of organizations reporting material shortages, the cleaning industry’s frontline workforce and procurement reality is anything but steady. Follow how billions in cross-border chemicals, detergents, and packaging imports and rising logistics signals translate into real pressure on janitorial service output, costs, and hazardous materials compliance.
Supply Chain In The Transportation Industry Statistics
With cyber attacks bleeding $10 billion into logistics costs each year and rising insurance premiums adding another 20% after COVID, this page maps the 2025 to 2026 pressures that can quickly derail freight, not just slow it. From weather-driven disruption at 80% and fuel price swings of 25% in 2022 to the digital gap that leaves 50% of transportation roles underprepared, you will see exactly where resilience is being won or lost across road, air, and maritime.
Supply Chain In The Logistics Industry Statistics
Global port throughput reached 885.8 million TEUs in 2023 while warehouse automation spend is poised to keep rising, with 40% of surveyed respondents planning higher automation investment in 2024 and 62% already relying on a TMS. Turn the page on what looks like resilience from trade volumes and what breaks in practice through capacity shortages, cyber costs, and operational delays, so you can connect strategy choices to the risks that move fastest.

Supply Chain In The Life Science Industry Statistics
Supply chain stress has become a measurable cost center for life sciences executives, with cyberattacks on pharma supply chains up 300% in 2022 to 2023 and visibility gaps cited by 55% as the top risk. Read how cold chain failures, API shortages, customs delays, and regulatory change can ripple into stockouts and rising expenses across pharma and biologics, alongside the growth of digital tools and compliance demands pushing the market toward faster, more resilient operations.
Supply Chain In The Payments Industry Statistics
With payments fraud projected at $1.2 trillion globally for 2023 and 49% of breaches tied to malware that targets systems feeding payment workflows, this page shows how supply chain risk turns compliance gaps into real settlement delays. It also maps the tools and regulations that are rising to meet the threat, from automated threat intelligence and vendor risk questionnaires to NIST SSDF practices and DORA and NIS2 incident expectations.

Supply Chain In The Shipbuilding Industry Statistics
Supply Chain In The Shipbuilding Industry statistics connect regulatory pressure and cost shocks to yard-ready procurement, from 58% of maritime companies already deploying decarbonization measures to 88% reporting supply chain disruptions. With 26.3 months median contract to delivery for container ship newbuilds, the page shows how volatile steel and coatings markets plus weekly supplier dashboards can make or break schedule, margins, and compliance.

Supply Chain In The Customer Service Industry Statistics
Customer service pressure is showing up where it hurts most, with 28% of global trade documents filed with errors and churn jumping about 5% for each week an order is late, while U.S. inventory carrying costs top $1.2 trillion annually. You will also see why proactive tracking is becoming non negotiable, since 54% of consumers expect delivery updates, alongside evidence that 38% of customer service leaders use AI and 65% prioritize knowledge base fixes to cut repeat contacts.

Supply Chain In The It Industry Statistics
With global containerized trade projected to grow 4.4% per year from 2021 to 2026, IT supply chains are still being tested by how container shipping disruptions and semiconductor shortages reshape lead times, purchasing costs, and component availability. This page connects the stakes to actionable signals, from 60% of leaders planning supply chain visibility investments and 17% using AI for planning, to the market size surge behind logistics and supply chain software that keeps IT hardware moving.
Supply Chain In The Wine Industry Statistics
From 2.3x higher spoilage risk tied to longer port dwell time to 25% of perishable losses happening between production and retail, this page pinpoints where wine logistics quietly turn into avoidable cost and waste. With 96% of European respondents planning to use digital tracking or traceability in the next 12 months and 3.2% of global emissions linked to cold chain and refrigerated transport, it shows how procurement, refrigeration choices, and data reliability now shape both margins and compliance as demand keeps rising.

Supply Chain In The Education Industry Statistics
Supply chain strain is hitting school budgets now, with 27% of supply chain leaders reporting shortages and disruptions were already affecting revenue in 2022. From $75.4 billion in education support services spending in 2020 to 29.5 million students served daily through school meals in SY 2022 to 23, these statistics reveal how freight delays, food inflation, and smarter inventory practices can reshape purchasing and delivery for every district.
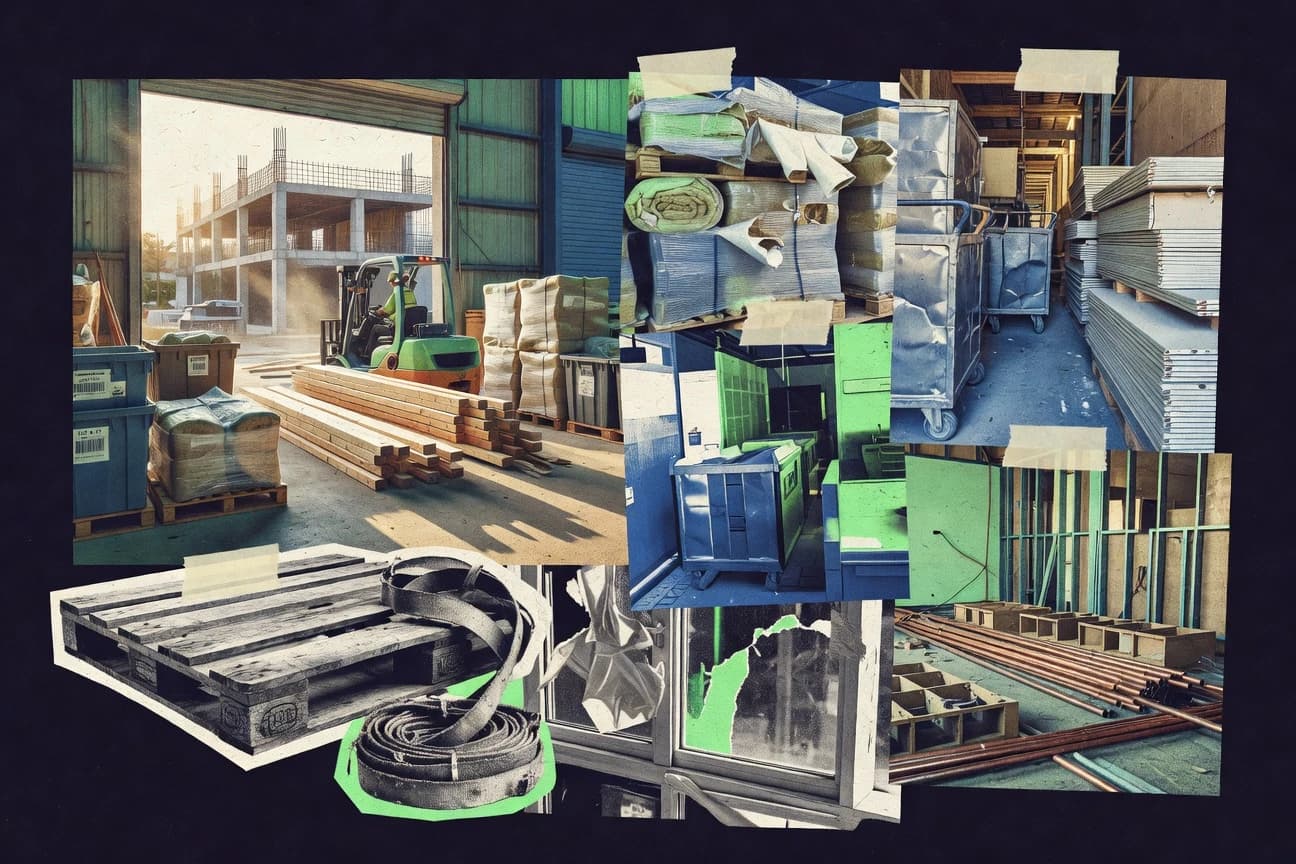
Supply Chain In The Housing Industry Statistics
With construction inputs prices still rising and real-time visibility proving its value, this page connects 2024 and 2025 style disruption pressures to what housing teams actually feel at the jobsite, from schedule slips tied to procurement issues to billions in logistics inefficiency. It also quantifies how smarter ordering, BIM and centralized staging can shrink lead time, rework, and waste, so you can weigh where to invest in the supply chain next.
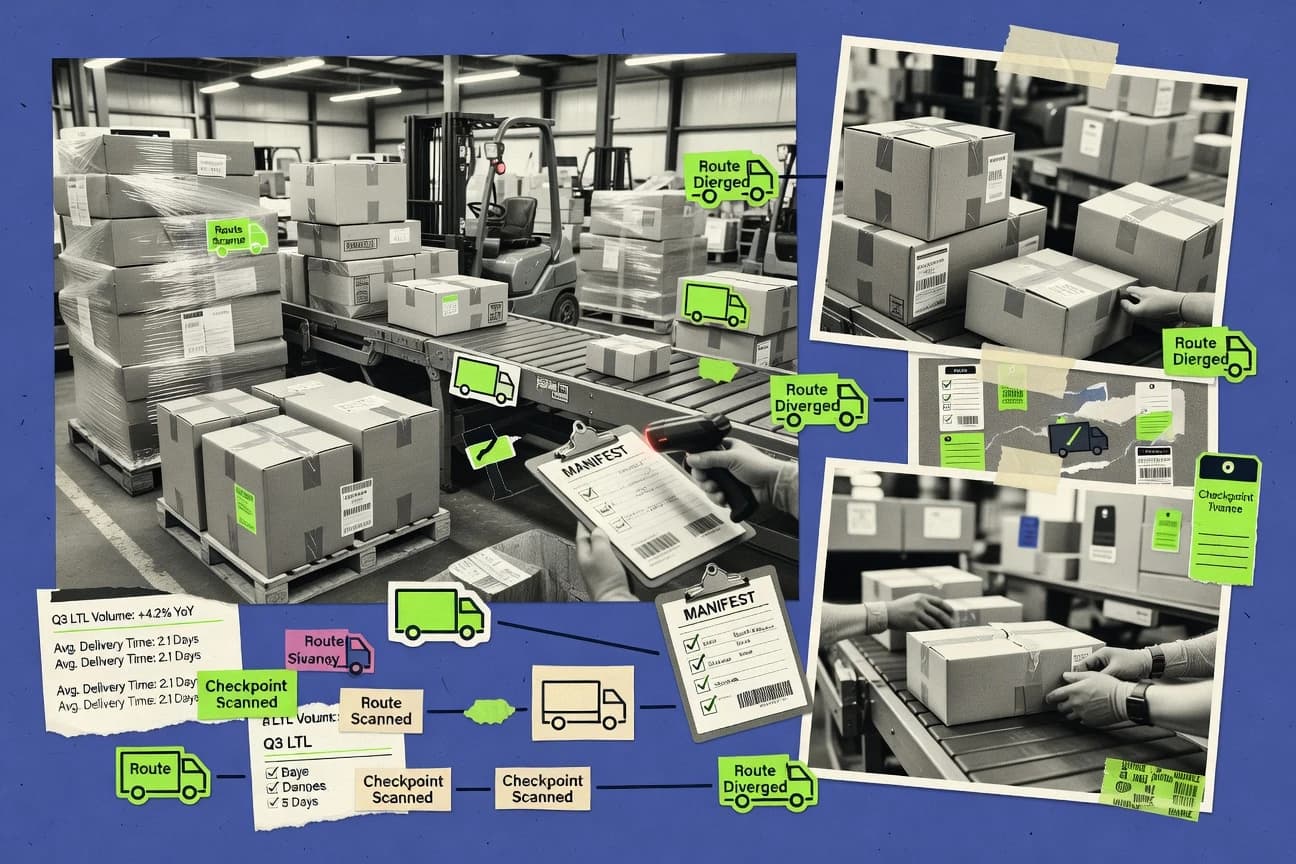
Supply Chain In The Ltl Industry Statistics
LTL performance is hitting 97% average on time delivery for standard service in 2023, but the operational pressure is rising fast with 62% of logistics leaders calling workforce availability a major constraint and truck driver-related violations reaching 1.6 million in 2023. Get the latest 2025 forecast that 75% of organizations plan to use supply chain planning solutions at scale, plus visibility, automation, and emissions facts that help you benchmark cost, speed, and compliance in real-world freight moving.

Supply Chain In The Consumer Goods Industry Statistics
With 6.5% of U.S. consumer goods sitting as retail inventory at the end of 2023 and out of stocks still costing about 4% of grocery and convenience sales in many markets, this page connects working capital pressure to real shelf failure. You also get why 39% of retailers planned likely safety stock increases in 2023 and how port and warehouse bottlenecks, from container disruptions to RFID powered inventory accuracy, are reshaping replenishment for consumer goods through to 2025.
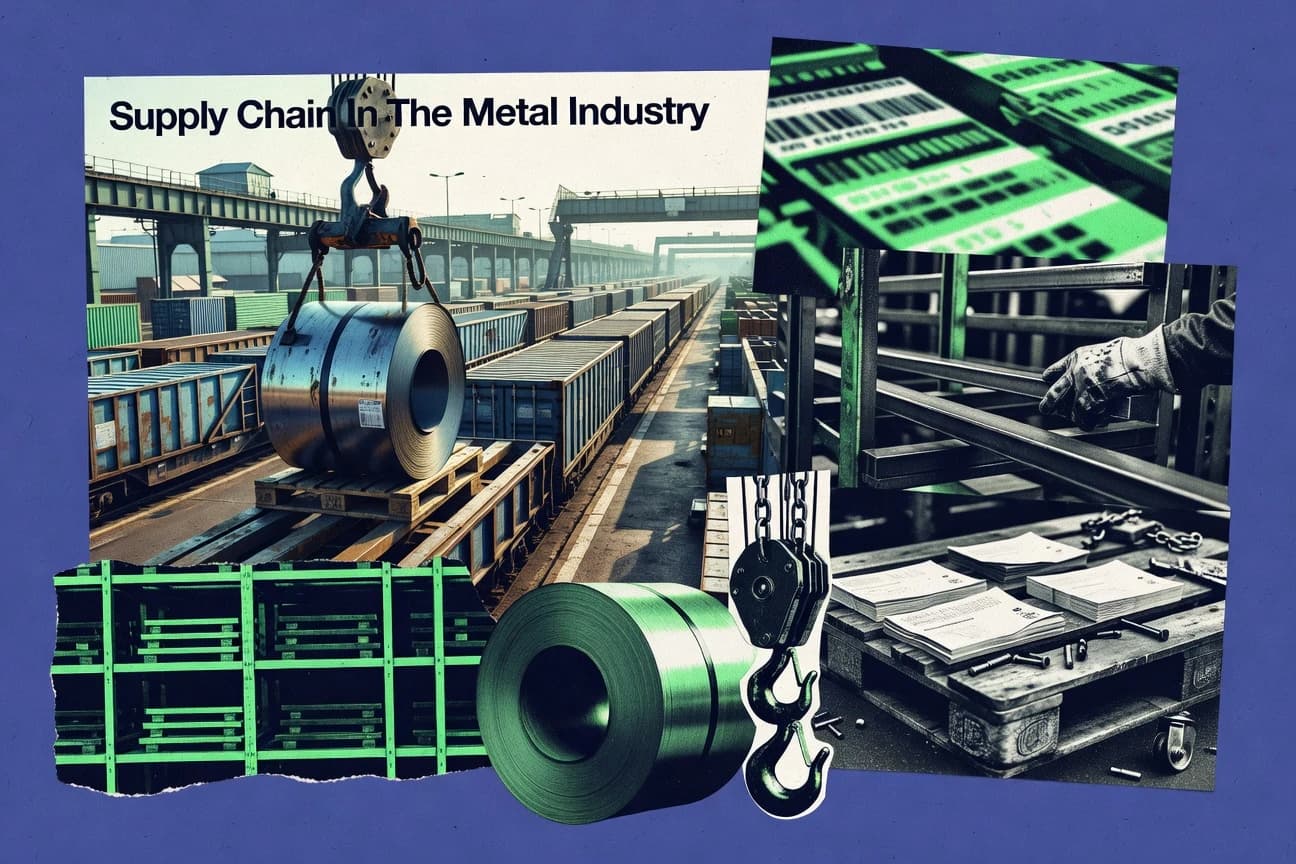
Supply Chain In The Metal Industry Statistics
Spotlighting the metal industry’s most current logistics pressure points, this statistics page contrasts the latest 2025 and 2026 supply chain signals against what it means for lead times, costs, and reliability. You will see where disruptions are easing and where they are quietly tightening, so decisions on procurement and inventory can be made with sharper timing.

Supply Chain In The Payment Card Industry Statistics
Find out how payment card supply chain pressures are reshaping what actually gets delivered, not just how fast it moves, with the latest 2025 figures putting real constraints in sharp focus. The page connects origin to fulfillment so you can spot the surprising break between logistics visibility and on the ground card production performance.

Supply Chain In The Health Care Industry Statistics
From RFID-enabled hospitals cutting time-to-stock by 3.5 to 4.5 days to electronic procurement and tendering driving procurement cycle time down 28 percent, these 2025 to 2026 style operational gains show what automation can actually change at the shelf level. Yet the same supply chain strain still follows care, with 74 percent of providers reporting drug shortage impacts, 1.6 percent of hospitalized patients experiencing preventable medication errors tied to handling workflows, and 4.4 percent of spending linked to medicine and medical supply waste.