GITNUX MARKETDATA
Browse Our Category
Supply Chain In Industry
Latest update:

Supply Chain In The Plumbing Industry Statistics
As labor and materials pressures keep squeezing plumbing contractors, the 2025 statistics in this page track how lead times, inventory swings, and supplier reliability actually changed and what that means for getting jobs done on schedule. See the sharp contrast between what suppliers promise and what the flow of parts reveals, plus the specific metrics teams use to reduce costly downtime.
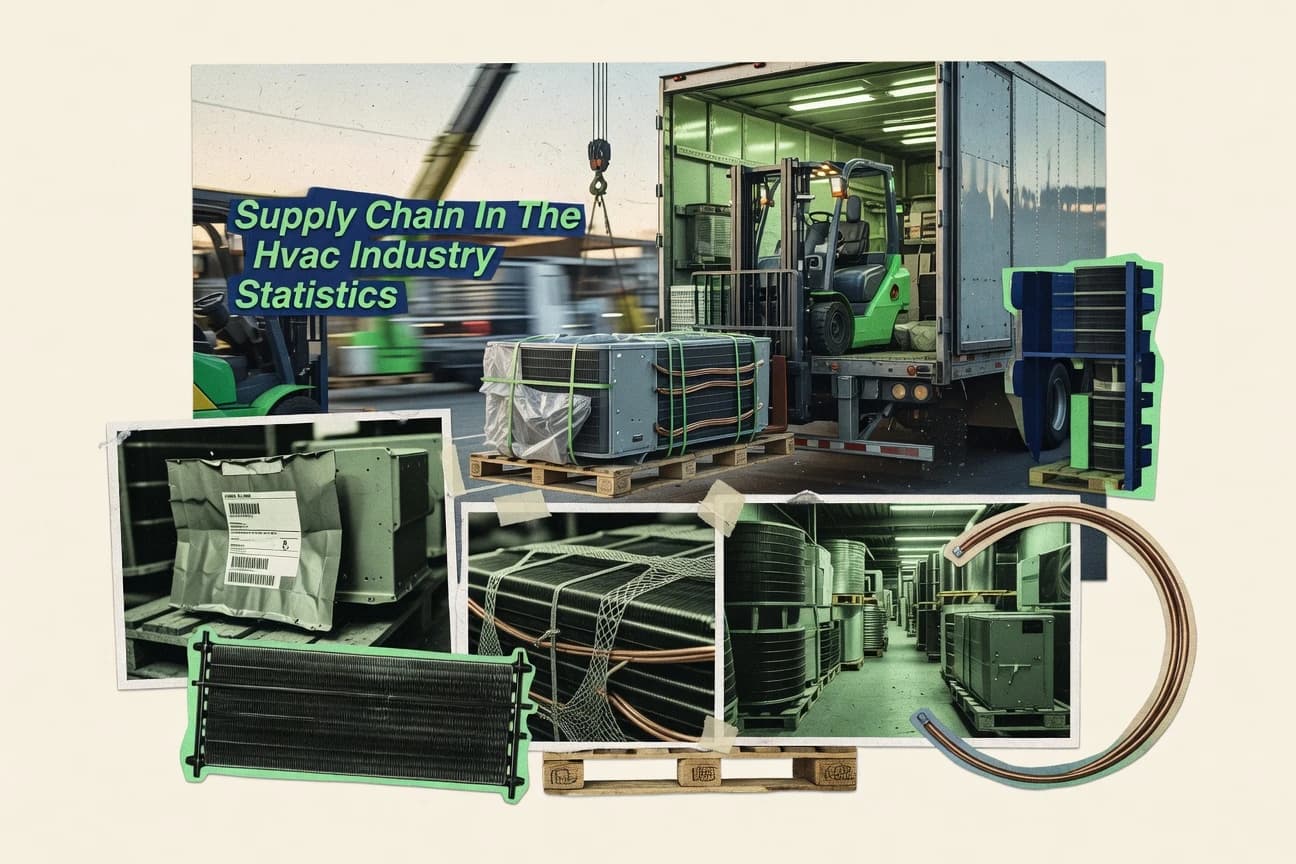
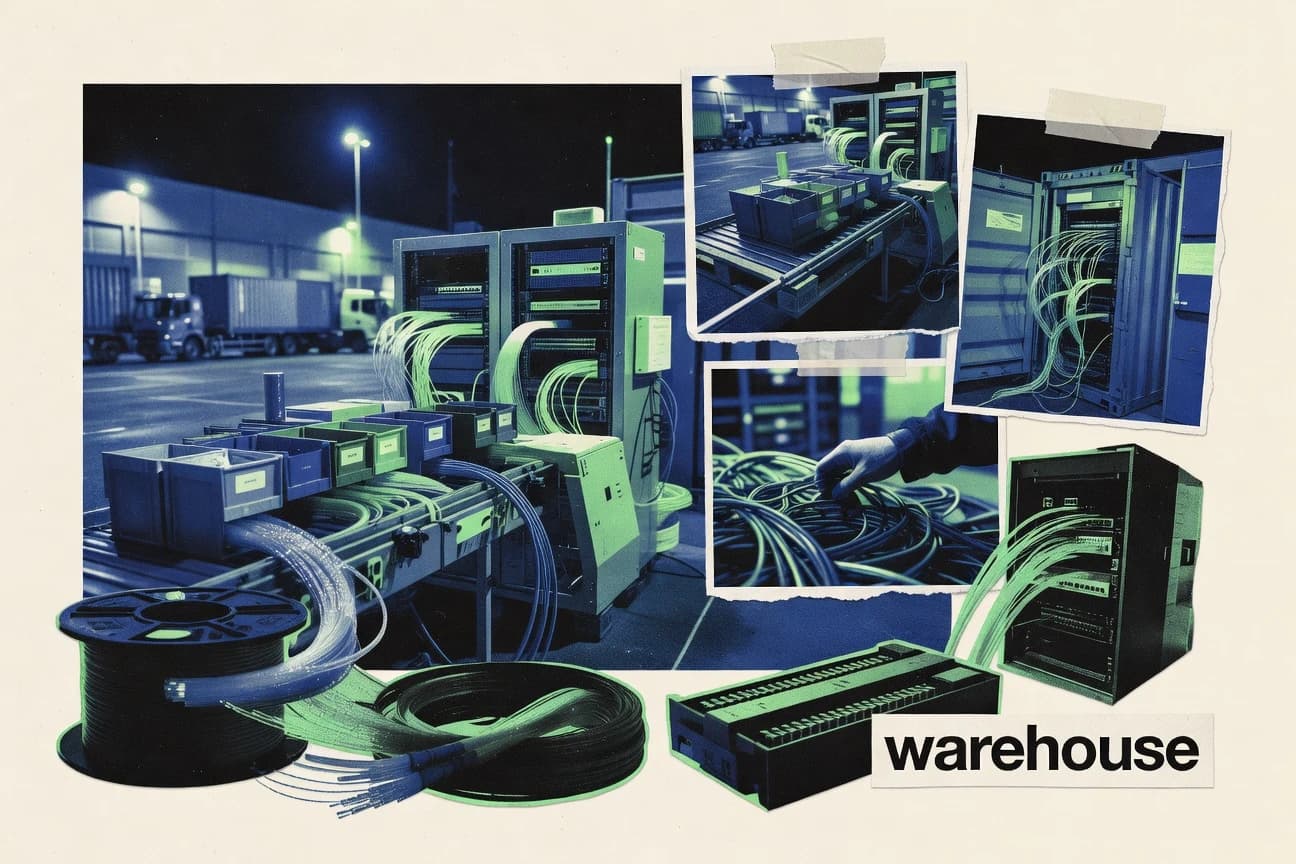
Supply Chain In The Hvac Industry Statistics
HVAC supply chains are being squeezed from every direction at once, from 27% of surveyed HVAC/R organizations saying disruptions hit on time deliveries to 11% of US warehouse space being newly delivered in 2023, which should help yet also raises the pressure on regional inventory timing. You will also see how the shift in refrigerants and costs, including 2025 and ahead compliance timelines and rising freight and copper pressures, is changing procurement decisions long before projects ever break ground.
Supply Chain In The Finance Industry Statistics
Supply chain leaders and finance teams are being asked to manage supplier risk with less visibility than they need, even as markets are funding the tools. See how a 2024 view of readiness and automation stacks up against the hard scale of trade and supply chain finance, from analytics and TPRM to verification, APIs, and blockchain.

Supply Chain In The Liquor Industry Statistics
Cold chain, port dwell time, and labor constraints are reshaping liquor distribution, with smart logistics reaching $4.9 billion in 2023 and freight visibility cutting transportation costs by 10% while improving ETA accuracy through route tracking. See how 36% forecast accuracy lifts from demand sensing and rising warehousing costs are changing replenishment and service, with global trade disruption worth $2.3 trillion tied to container shortages and congestion.

Supply Chain In The Multifamily Industry Statistics
See how multifamily supply chain decisions are reshaping cost, timing, and reliability with a sharper 2025 snapshot than most benchmarking still uses. You will find the tension between faster delivery expectations and the operational realities that can stall projects, plus the metrics leaders track to keep occupancies on schedule.

Supply Chain In The Security Industry Statistics
With 2026 forecasted logistics reliability at 98 percent, security supply chains are moving from volatility to dependable delivery. But 52 percent of organizations still report delays tied to procurement and sourcing bottlenecks, making the gap between planning and reality impossible to ignore.

Supply Chain In The Steel Industry Statistics
U.S. crude steel production reached 5.3 million tons in 2023 and global shipments slipped by 1.8%, a setup that explains why procurement analytics are rising while logistics delays keep supply chains on edge. Track how EAF’s one third share is reshaping energy and scrap networks against carbon limits, and see how real time shipment tracking meets steel price swings that move inventories, service center margins, and scheduling.
Supply Chain In The Electronics Industry Statistics
With 2026 forecast indicators showing demand and lead time pressures reshaping electronics supply chains, this statistics page pinpoints where risk is building and where it is easing. You will see the sharp tradeoffs between component shortages, logistics costs, and time to production that companies cannot ignore.
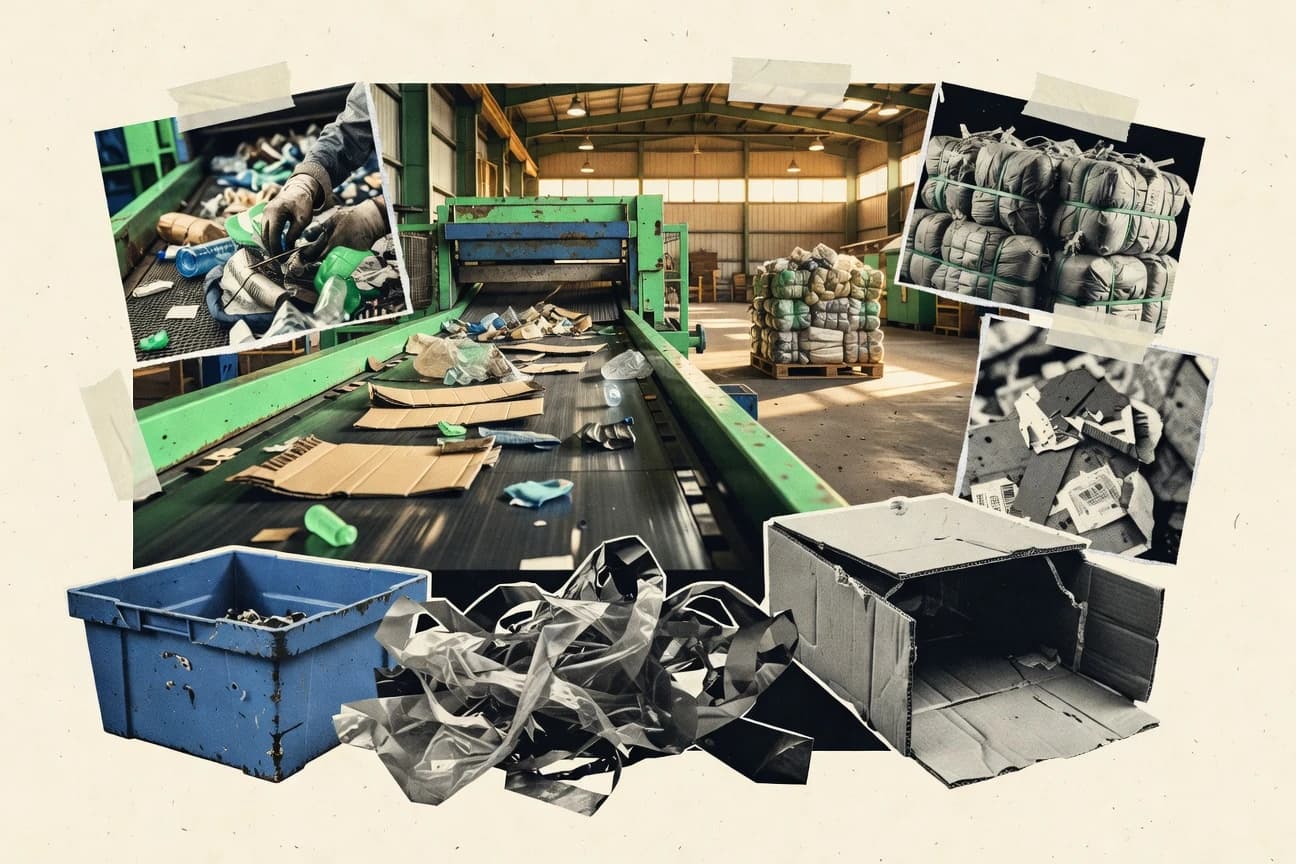
Supply Chain In The Recycling Industry Statistics
With 2021 signals already showing where the recycling supply chain is heading, this page connects EU 2030 packaging targets of at least 55% recycled and Germany’s 80% plus packaging recycling performance to the real bottlenecks of sorting, contamination, and fuel cost pressure, including how market swings can flip margins. You will also see why global secondary materials reached $55.5 billion in 2021 while recycling market value is forecast to hit $424.0 billion by 2030, and what that future scale means for collection routes, processing throughput, and compliance risk.
Supply Chain In The Technology Industry Statistics
Forecast global enterprise supply chain management software to reach USD 215.5 billion, while cybersecurity services climb to USD 120.3 billion, showing how technology supply chains are funding security and control as fast as they scale software. You will also see the hard operational payoff, including 58% reporting better on time delivery from visibility, alongside the risks that keep leaders up such as USD 2.8 billion in counterfeit electronics value at risk.

Supply Chain In The Food Processing Industry Statistics
With food systems responsible for 12% of global greenhouse gas emissions and up to 30% of food lost or wasted along the way, the supply chain is revealed as a major climate and cost leak rather than just an operations issue. This page connects those human impacts to practical pressure points like the 35% traceability capability gap, 17% supply chain cost reduction tied to end-to-end visibility, and a US$9.6 billion 2023 surge in food traceability solutions demand.

Supply Chain In The Cyber Security Industry Statistics
Supply chains are becoming the soft underbelly of cyber security, and the 2025 statistics on where breaches originate are less about isolated attacks and more about interconnected weaknesses across vendors, logistics, and third party access. See how the 2026 indicators shift the focus from reactive incident response to prevention planning that actually tracks risk through the chain.

Supply Chain In The Digital Marketing Industry Statistics
With cookie timelines pushing targets to rethink attribution, 70% of organizations say their customer data is fragmented and 57% struggle to measure ROI, even as digital ad spend heads toward $134.6 billion in 2023 and keeps climbing. See how supply chain analytics for operations, automation gains like 2.5x engagement in email, and mounting breach and compliance costs are colliding into one question marketers can no longer ignore.
Supply Chain In The Tmt Industry Statistics
From $32.67 billion in global supply chain management by 2030 to 18% lower warehouse operating costs through automation, this page maps the TMT supply chain tech shift with hard ROI and risk realities like median $4.45 million data breach costs. You get the why behind the momentum too, with 76% of leaders planning more analytics in planning and procurement, alongside the visibility and inventory gains that are already moving forecast accuracy, even as port delays and trade friction keep pressure on margins.
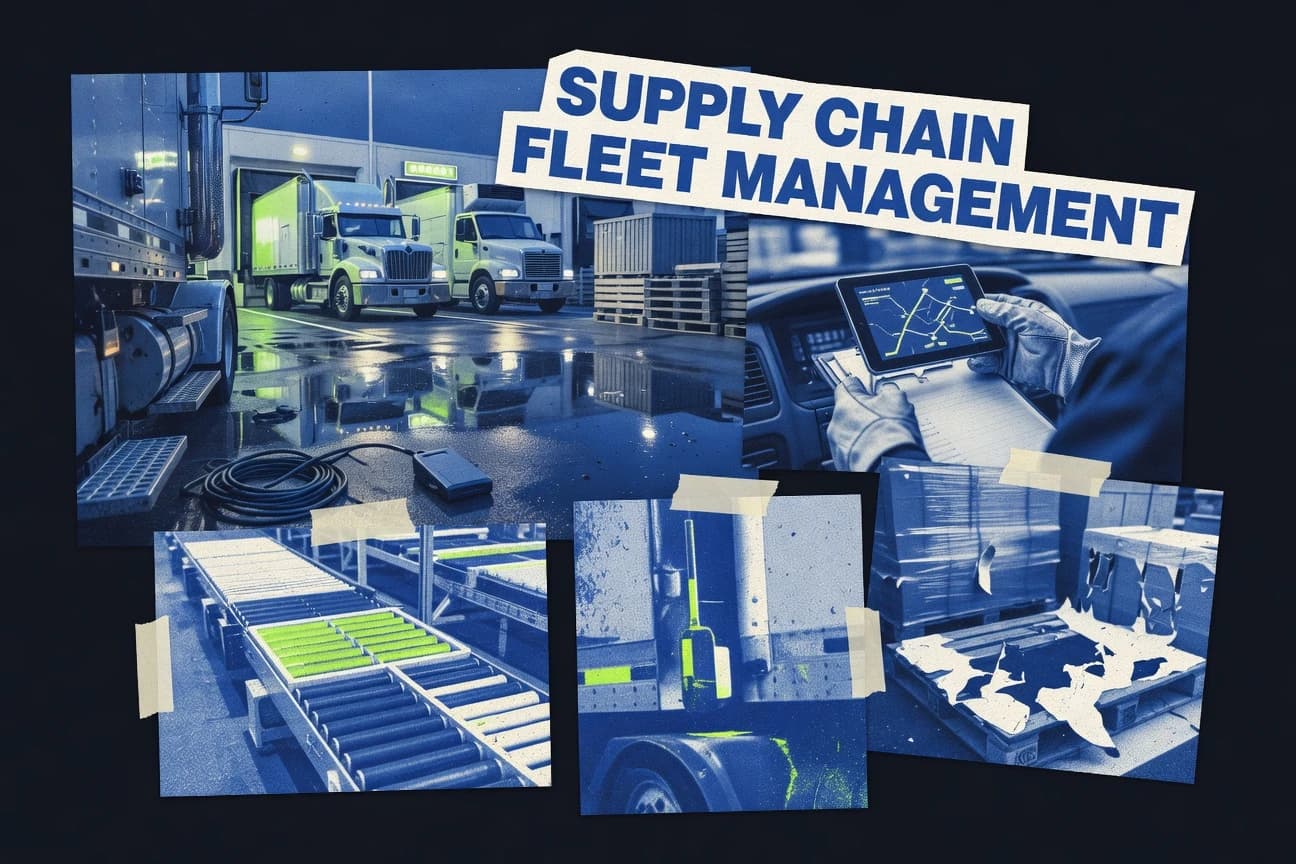
Supply Chain In The Fleet Management Industry Statistics
With telematics and transportation visibility increasingly tied to measurable gains like up to a 20% idle time reduction and 72% improved dispatch efficiency, fleet teams are turning smarter routing and real time tracking into fewer late deliveries, lower accidents, and leaner maintenance costs. This page also sets the scale for where adoption is heading with 55.1 billion in telematics market size in 2022 alongside today’s ELD and cloud integration momentum, so you can see which upgrades deliver impact and which are just noise.

Supply Chain In The Glass Industry Statistics
With glass container demand forecast at 40.0 million metric tons for 2024 and energy use still running 15 to 20 GJ per tonne, the page puts cost pressure and emissions rules in direct tension with what supply chains can actually see, plan, and deliver, from a 31 percent visibility gap to 54 percent of logistics teams backing digital freight forwarding in 2024. It also tracks how energy price swings, ETS and CBAM compliance timing, and transport reliability translate into real margin risk for glassmakers, plus why using recycled cullet can cut CO2 per tonne by up to 20 percent.

Supply Chain In The Dental Industry Statistics
Even with stronger controls, 9.6% of U.S. dental practices still report poor or fair inventory management, and that gap shows up as 15% fewer stockouts when cycle counting is used. From COVID era demand shocks like a 1.7x rise in single use disposables to 38% of healthcare organizations facing critical item availability problems, these 2025 and latest signals map where dental procurement is losing time, money, and supply reliability.

Supply Chain In The Shoe Industry Statistics
Freight and port bottlenecks are no longer just background noise. Track the 2025 signals that show how shoe supply chains are changing on the fly and what that shift means for costs, lead times, and sourcing decisions.
Supply Chain In The Manufacturing Industry Statistics
With 1.1 trillion dollars projected for supply chain technology investment from 2021 to 2025 and 74% of supply chain organizations already using S and OP, manufacturers are spending to get ahead even as 75% of supply chain leaders report data quality issues that can derail planning and execution. Meanwhile, disruptions still hit hard with 5.9 billion dollars in cyber losses tied to third parties and supply chain disruptions affecting on time delivery for 86% of manufacturers, making the case for real-time visibility, smarter forecasting, and end to end resilience impossible to ignore.
Supply Chain In The Wholesale Industry Statistics
Wholesale supply chains are being reshaped by sharply shifting delivery, inventory, and fulfillment patterns, and the latest 2026 figures make clear where speed is improving and where service is slipping. Read the statistics to see how the biggest cost and stock-pressure drivers are changing, and what that means for operators trying to balance lower inventory with reliable lead times.