Market data
Sports & Recreation
Explore sports & recreation statistics and market research reports with sourced data and trend analysis.
Latest update:
 Gabrielle Fontaine


Statistics · 2026
Snow Sports Industry
U.S. ski areas recorded 59.4 million skier visits in 2022/2023 (up 1.5%)—see how participation flows into lift, rental, and equipment revenues.

Statistics · 2026
Snowboarding Industry
With helmet use up to 76% and snowboard participation at 55.4% of U.S. snow sports, Snowboarding Industry statistics explain why safety behavior and riding mindshare are rising together, even as costs and injury risks keep pressure on resorts and riders. You will also see how factors from snowmaking coverage and rental demand to shifting snow reliability and gear standards shape what people actually buy and ride.

Statistics · 2026
Skiing Industry

Statistics · 2026
Ski Snowboard Industry
US ski trips are growing, but costs, climate, and safety are tightening the margins. With about 40% of skiers fitting first-time or occasional profiles and 7.0 million skier visits expected for 2024 to 25, this page connects participation and spend to the hard operational realities behind snowmaking energy, forecast upgrades, and why head protection still matters.

Statistics · 2026
Sled Industry

Statistics · 2026
Shooting Range Industry
Find out how range operators, retailers, and trainers are navigating the latest shifts, with 2026 figures that spotlight where demand is tightening and where it is still accelerating. The contrast between shooting activity trends and business realities is sharp enough to change how you plan staffing, inventory, and training for what comes next.

Statistics · 2026
Scuba Diving Industry
Global scuba diving equipment grew 4.6% in 2023—discover what drives demand, from diver behavior to dive-center marketing.

Statistics · 2026
Rock Climbing Industry
Quickdraws sell about 5 million units per year worldwide—priced around $15 each in 2023. Here’s what that means for the market.

Statistics · 2026
Road Bike Industry
Carbon fiber frames jumped 38% globally from 2020 to 2023, even as road cyclists are increasingly focused on speed and smart upgrades, with 62% of road riders calling aero improvements “very important” in a 2022 survey. Get the UK to US and China to Europe breakdown on sales, market value, pricing, and supply chain strain so you can see why the fastest growing parts of the industry are not always the ones riders talk about first.

Statistics · 2026
Rafting Industry
Whitewater rafting generated 4.88M U.S. visits in 2023—discover what boosts demand, how operators manage safety, and where growth is headed.

Statistics · 2026
Pool Table Industry
Pool Table Industry stats connect growing demand with rising service costs, including a 3.8% billiards tables market CAGR through 2030 and a 5.2% billiards equipment CAGR through 2032, alongside a U.S. maintenance spend reality where keeping tables playable can cost $140 to re-cloth, $250 to level, and $400 to recover. If you care about margins in commercial cue sports, the sharp contrast between regular participation at 2.1 million Americans and replacement and repair pressure that can consume 8% of venue spend makes this page worth reading now.

Statistics · 2026
Playground Equipment Industry
Playground Equipment Industry data makes one shift hard to ignore: 2026 demand for engineered play structures is accelerating while costs and lead times are still forcing manufacturers to rethink margins and sourcing. If you want to understand what these 2026 pressures mean for the next round of installs, this is the page where the numbers line up.
Statistics · 2026
Pickleball Industry
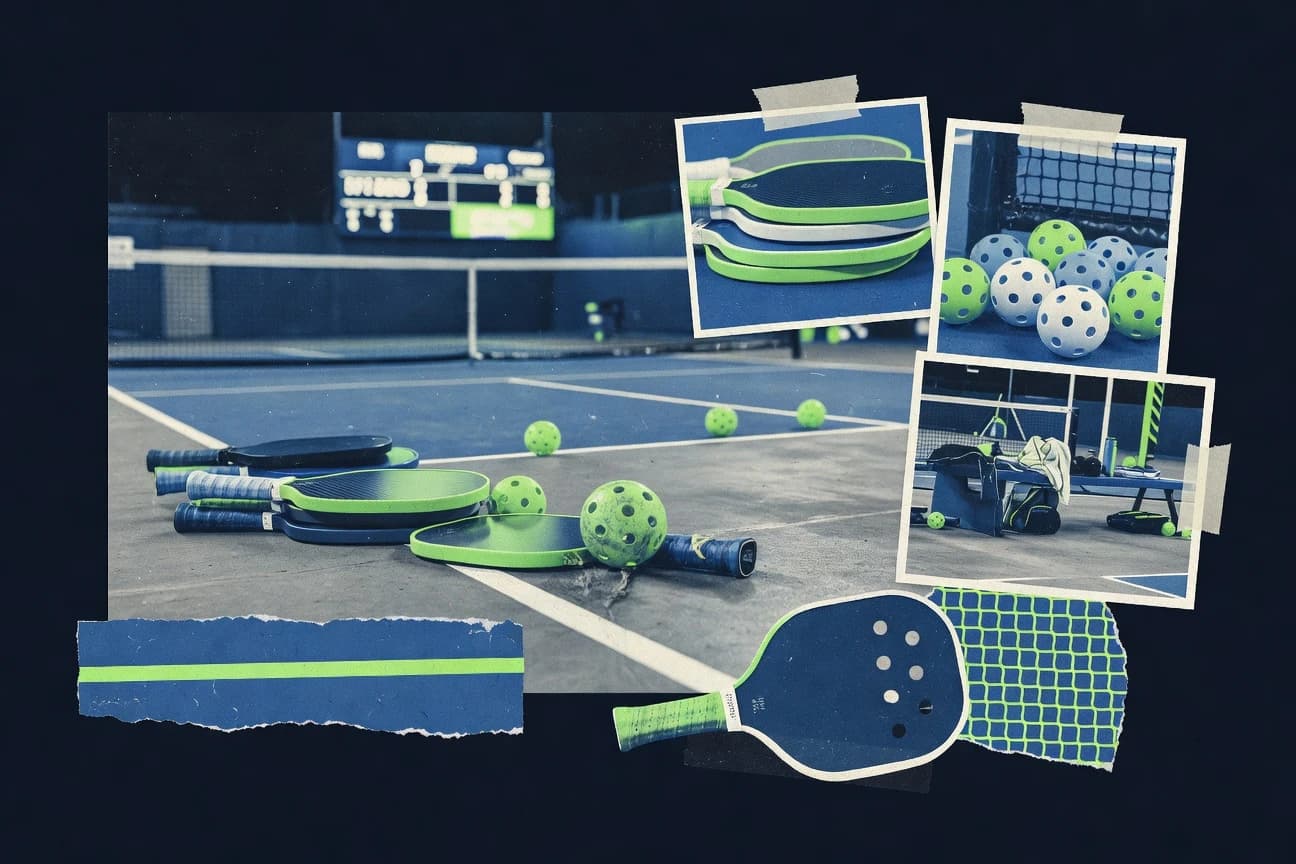
A 52% surge drives pickleball to 36.5 million players in 2023—jumping from casual to core fast. See the stats behind the boom.

Statistics · 2026
Personal Watercraft Industry
With fuel, insurance, and repair realities shaping ownership, the page ties risk and downtime to hard costs such as a $12,000 typical 3-year total cost for a mid-range PWC, plus a median 0.8 hours to repair common dealer logged issues. It also connects tech and safety adoption to outcomes, from 2024’s 4.3% jump in average PWC transaction prices to PFD use and a 2.1x drowning risk when no PFD is worn, showing exactly what buyers and owners need to plan for.

Statistics · 2026
Performance Racing Industry
See how the performance racing ecosystem translates into real headcount, pay, and buying power, from 1.2 million U.S. jobs tied directly to performance racing and $42.3 billion in global revenue growth to 78% of PRI attendees hiring for tech roles. It also tracks where the next labor and parts demand is stacking up, including 4% 2022 aftermarket distributor growth to 350,000 jobs, ASE-certified mechanics making $52 per hour, and attendance and engineering hiring surges that separate podium dreams from buildable capacity.
Statistics · 2026
Overlanding Industry
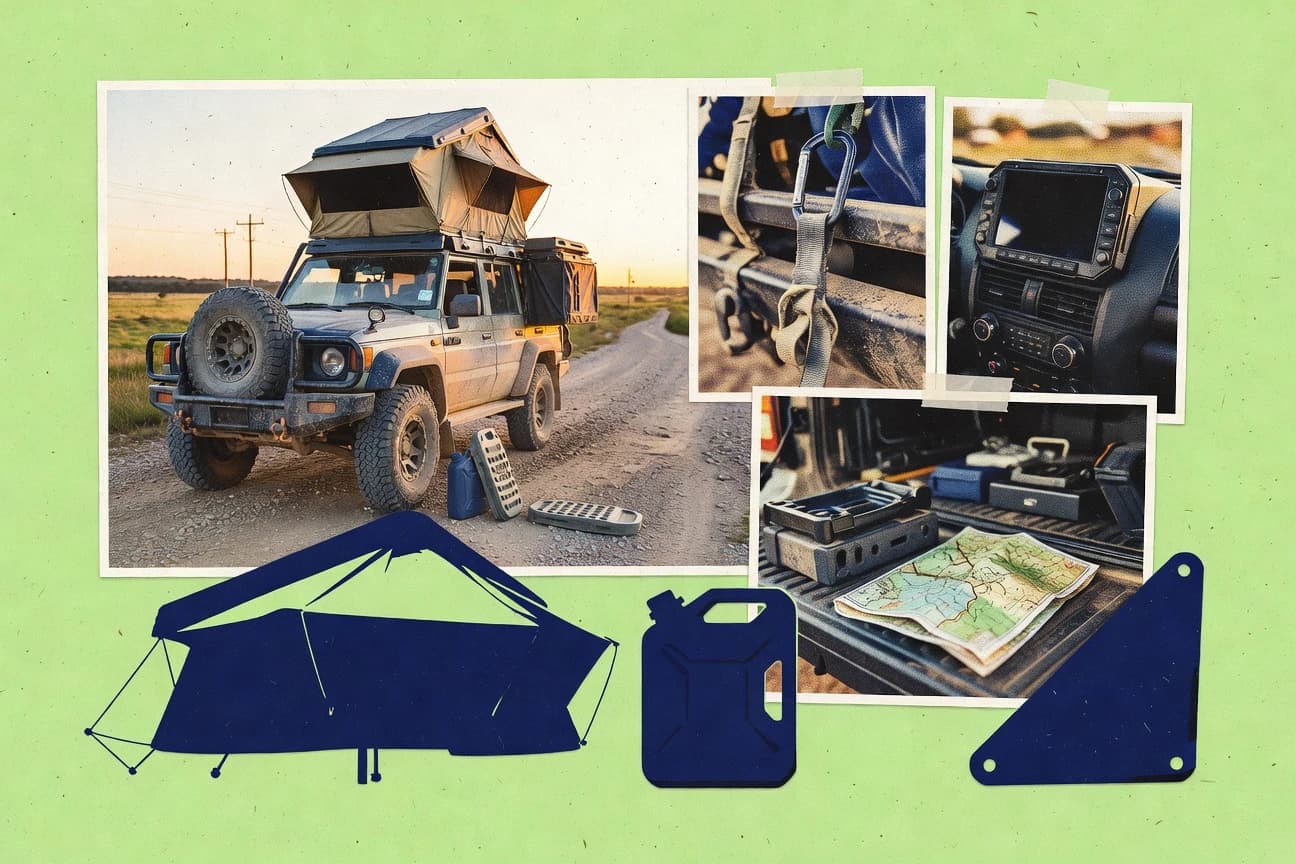
From 2023, the U.S. overlanding scene already packs $4.1 billion in GDP impact and 1.2 million participants, yet just 1.2 rollover incidents per 100,000 off road miles and 87% first aid kit compliance reveal how safety minded it is. Global growth is accelerating with the market at USD 8.2 billion in 2023 heading toward a 12.5% CAGR to 2030, while North America’s revenue jumped 18% year over year, and even the gear shift toward rooftop tents is unmistakable with 250,000 units sold worldwide in 2023.

Statistics · 2026
Off Road Industry
With 2026 figures on manufacturing output and trail-ready vehicle demand, this Off-Road Industry statistics page captures the shift happening faster than the usual production cycle can explain. Compare that momentum against cost pressures and market churn to see why what sold best last year may not hold up on the next track.

Statistics · 2026
Off Road Utv Industry
From a projected 11.8% global UTV CAGR from 2024 to 2032 to a U.S. used market median of $1,200 for non-titled UTVs in 2023, this page pinpoints what is actually moving demand and pricing across side by sides. You will also see how 60% of U.S. adults rely on online reviews, 15% insurance premium jumps, and stricter EPA emissions compliance are reshaping the cost and sales funnel for Off-Road UTV brands and dealers.

Statistics · 2026
Motorsport Industry
Find out how 2026 lineups are shaping the economics behind the grid, from where teams are putting the money to how quickly motorsport’s sponsorship and supplier networks are reorganizing. The page connects the most current participation and performance trends to the signals that are likely to decide who gains advantage next.

Statistics · 2026
Motocross Industry
Motocross Industry numbers are showing a sharp shift by 2025 and 2026, where rider, venue, and parts demand don’t move in sync the way fans expect. If you care about what’s driving growth right now, these latest figures explain the real bottlenecks shaping tracks, sponsorships, and buying decisions.