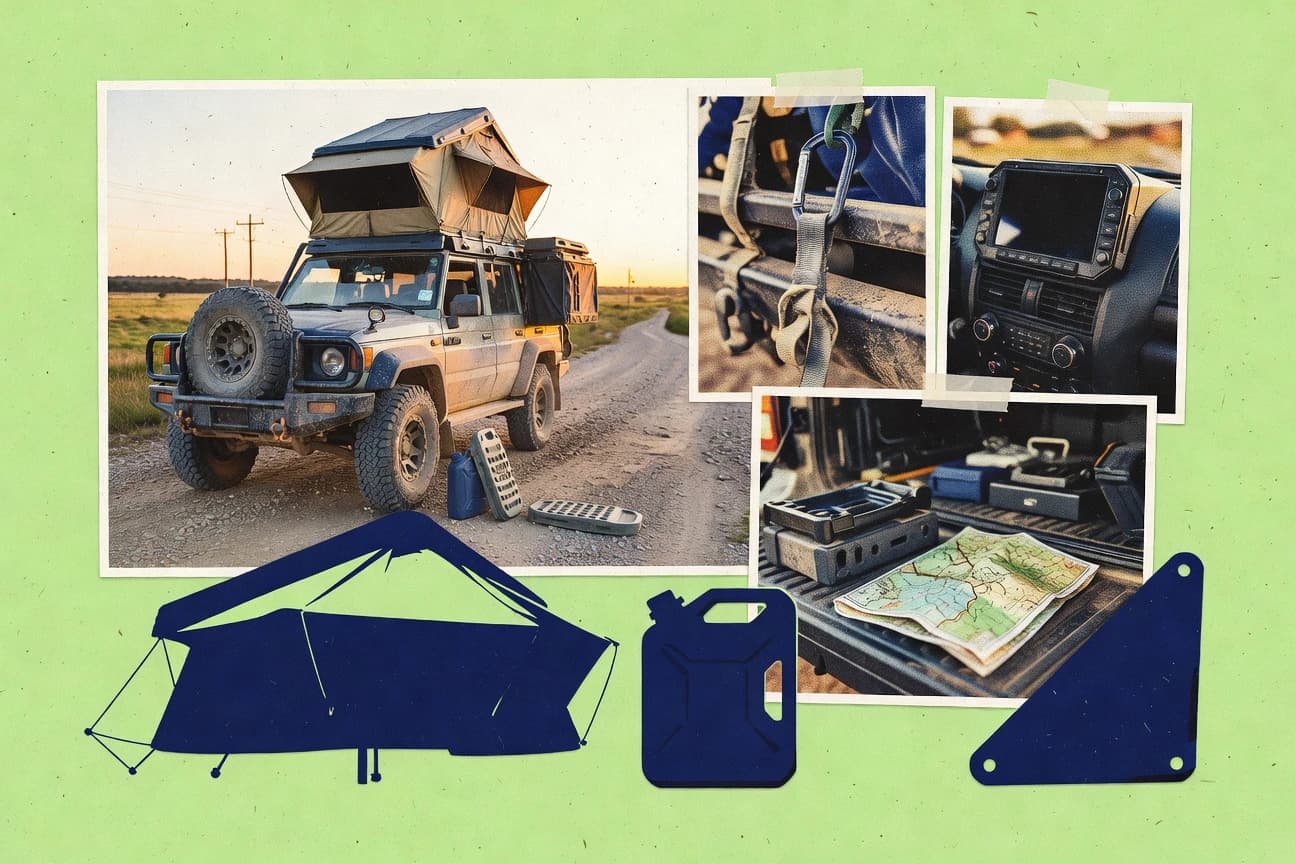

Overlanding is no longer a niche hobby, with the global market hitting $8.2 billion in 2023 and projected to grow at a 12.5% CAGR from 2024 to 2030. In North America, revenue climbed to $3.4 billion in 2023 while 35% of overlanders are aged 25 to 34, and women make up 28% of participants. The surprising part is how lifestyle meets impact, from rooftop tents jumping to 250,000 units in 2023 to an average trip footprint of 2.1 metric tons CO2.
Key Takeaways
- 35% of U.S. overlanders are aged 25-34, representing the largest demographic segment.
- Women account for 28% of overlanding participants in North America as of 2023.
- Average income of U.S. overlanders is $95,000 annually in 2023 survey.
- The global overlanding market was valued at USD 8.2 billion in 2023 and is projected to grow at a CAGR of 12.5% from 2024 to 2030.
- North American overlanding industry revenue reached $3.4 billion in 2023, up 18% year-over-year.
- Overlanding equipment sales in Europe surged by 22% in 2022, totaling €1.2 billion.
- Overlanding rollover incidents average 1.2 per 100,000 miles driven.
- 87% of overlanders carry first aid kits exceeding basic requirements.
- Permit violations cost overlanders $450 average fine in U.S. parks 2023.
- 55% of overlanders take trips longer than 2 weeks annually.
- Average annual mileage for overlanders: 5,200 off-road miles.
- 68% prefer national forests/parks for camping.
- 4x4 pickup trucks used by 45% of U.S. overlanders.
- Roof top tents sales increased 35% to 250,000 units in 2023 globally.
- Solar panels average 200W capacity in 68% of overland rigs.
With booming market growth and rising participation, overlanders increasingly invest in equipment and long trips worldwide.
Related reading
01 · Category
Consumer Demographics28 stats
01
35% of U.S. overlanders are aged 25-34, representing the largest demographic segment.
02
Women account for 28% of overlanding participants in North America as of 2023.
03
Average income of U.S. overlanders is $95,000annually in 2023 survey.
04
42% of European overlanders have college degrees or higher.
05
Millennials comprise 55% of new overlanding entrants globally in 2023.
06
62% of Australian overlanders are married or in partnerships.
07
Hispanic/Latino overlanders grew to 15% of U.S. total in 2023.
08
Average age of overlanders worldwide is 38 years in 2023 data.
09
51% of Canadian overlanders live in urban areas.
10
Gen Z overlanders increased by 30% to 12% of total in 2023.
11
67% of U.K. overlanders own their primary residence.
12
African overlanders average household size of 3.8 members.
13
29% of overlanders are families with children under 18.
14
Solo female overlanders rose to 11% in global stats 2023.
15
73% of German overlanders have professional occupations.
16
U.S. overlanders with military background: 22%.
17
Average education level among Brazilian overlanders: 14 years schooling.
18
48% of South African overlanders aged 35-54.
19
Overlanders identifying as LGBTQ+ at 8% globally in 2023.
20
56% of New Zealand overlanders self-employed.
21
Mexican overlanders 40% from middle class income bracket.
22
65% of Asian overlanders male-dominated segment.
23
U.S. overlanders with pets: 37%.
24
French overlanders average age 41, 2023 survey.
25
24% of overlanders retired or semi-retired worldwide.
26
Italian overlanders 55% urban dwellers.
27
Global overlanders with children: average 1.7 kids per family.
28
Spanish overlanders income avg €55,000.
Interpretation
Consumer Demographics Interpretation
The consumer demographics of overlanding are being increasingly driven by millennials, who make up 55% of new global entrants in 2023, alongside a young core of 35% of U.S. overlanders aged 25 to 34.
02 · Category
Market Size & Growth30 stats
01
The global overlanding market was valued at USD 8.2 billion in 2023 and is projected to grow at a CAGR of 12.5% from 2024 to 2030.
02
North American overlanding industry revenue reached $3.4 billion in 2023, up 18% year-over-year.
03
Overlanding equipment sales in Europe surged by 22% in 2022, totaling €1.2 billion.
04
The U.S. overlanding sector saw 1.2 million participants in 2023, contributing $4.1 billion to GDP.
05
Asia-Pacific overlanding market expected to reach $2.8 billion by 2028 with 14.3% CAGR.
06
Overlanding vehicle aftermarket modifications generated $1.5 billion in 2023 globally.
07
Australian overlanding industry valued at AUD 750 million in 2023, growing 16% annually.
08
Latin American overlanding market expanded to $900 million in 2023, with 20% YoY growth.
09
Overlanding app and tech sector revenue hit $450 million in 2023 worldwide.
10
U.S. overlanding rental market grew to $650 million in 2023, 25% increase from 2022.
11
Global overlanding insurance premiums totaled $320 million in 2023.
12
Middle East overlanding market projected at $500 million by 2027, CAGR 13%.
13
Overlanding event attendance generated $200 million in ticket and vendor sales in 2023.
14
Canadian overlanding sector valued at CAD 1.1 billion in 2023.
15
Africa overlanding tourism contributed $1.8 billion to economy in 2023.
16
Overlanding apparel market reached $550 million globally in 2023.
17
U.K. overlanding market grew to £450 million in 2023, 19% YoY.
18
Overlanding fuel and logistics sector valued at $1.2 billion in 2023.
19
Projected global overlanding market size of $25 billion by 2032.
20
Overlanding media and content creation industry at $180 million in 2023.
21
South African overlanding market at ZAR 5 billion in 2023.
22
Overlanding training and certification programs generated $90 million in 2023.
23
New Zealand overlanding sector valued at NZD 400 million in 2023.
24
Overlanding accessories e-commerce sales hit $2.1 billion in 2023.
25
Brazil overlanding market reached BRL 2.5 billion in 2023.
26
Overlanding community membership fees totaled $75 million globally in 2023.
27
German overlanding industry at €800 million in 2023, 17% growth.
28
Overlanding satellite comms market $250 million in 2023.
29
Mexico overlanding tourism $1.1 billion in 2023.
30
Global overlanding investment funding reached $600 million in 2023.
Interpretation
Market Size & Growth Interpretation
The market size signals strong momentum for overlanding, with the global industry reaching USD 8.2 billion in 2023 and set to expand at a 12.5% CAGR through 2030, while key regions and segments like North America growing 18% year over year to $3.4 billion underscore sustained growth under the Market Size and Growth category.
03 · Category
Safety, Regulations & Sustainability26 stats
01
Overlanding rollover incidents average 1.2 per 100,000 miles driven.
02
87% of overlanders carry first aid kits exceeding basic requirements.
03
Permit violations cost overlanders $450average fine in U.S. parks 2023.
04
Carbon footprint of average overland trip: 2.1 metric tons CO2.
05
94% use tire pressure monitoring systems post-2022 regulations.
06
Wildlife encounters requiring evasion: 3% of trips.
07
EU overland emissions standards compliance at 76% for diesel rigs.
08
Fire safety training completed by 41% of participants.
09
Leave No Trace adherence self-reported at 92%.
10
Breakdown recovery calls: 1 per 1,500 miles average.
11
Australia vehicle recovery regs updated, 88% compliance.
12
Solar-only power users reduced emissions by 45%.
13
Helmet use in motorcycle overlanding: 98%.
14
Water purification failure incidents: 0.5% trips.
15
BLM land restoration costs from overlanders: $1.2M in 2023.
16
Satellite SOS activations: 1 per 10,000 trip days.
17
Fuel spill prevention kits in 79% rigs.
18
Canada backcountry regs: 82% permit holders.
19
Biodiversity impact zones avoided by 67% route planners.
20
Hypothermia cases: 0.8 per 1,000 cold trips.
21
Waste carryout compliance 96% audited sites.
22
U.K. MOT adaptations for overland: 71% pass rate.
23
EV charging station gaps cause 14% trip alterations.
24
Bear canister mandates followed by 89% in grizzly areas.
25
Global overland trail erosion control investments $15M 2023.
26
Communication blackouts led to 2% distress calls.
Interpretation
Safety, Regulations & Sustainability Interpretation
With 87% carrying upgraded first aid kits and 94% using tire pressure monitoring after the 2022 rules, overlanding is getting safer even as risks like rollover incidents of 1.2 per 100,000 miles remain, alongside sustainability concerns reflected in a 2.1 metric ton CO2 average trip.
More related reading
04 · Category
Trip Patterns & Preferences30 stats
01
55% of overlanders take trips longer than 2 weeks annually.
02
Average annual mileage for overlanders: 5,200 off-road miles.
03
68% prefer national forests/parks for camping.
04
Most popular destination: Moab, UT with 42% visits.
05
Group travel preferred by 53% of participants.
06
Average trip budget $2,800per person.
07
71% plan trips 3-6 months in advance.
08
Winter overlanding done by 19% annually.
09
Australia Outback routes top for 37% international trips.
10
44% use apps for route planning daily.
11
Multi-month expeditions by 12% of hardcore overlanders.
12
59% camp exclusively dispersed/free sites.
13
Baja Peninsula visited by 28% of U.S. overlanders.
14
66% incorporate fishing/hunting in trips.
15
Average convoy size 3-5 vehicles for 49%.
16
Patagonia routes popular with 21% Southbound travelers.
17
52% prefer self-supported no-resupply trips.
18
Night photography stops on 73% of trips.
19
Africa Cape-to-Cairo route by 8% lifetime goal.
20
61% repeat favorite routes annually.
21
Electric vehicle overlanding trials by 5% in 2023.
22
47% include cultural site visits.
23
Silk Road modern routes by 14% Eurasian overlanders.
24
39% use ferries for island hopping.
25
Average stops per trip: 12-15 campsites.
26
75% avoid highways, stick to backroads.
27
Alaska Highway traversed by 23% North Americans.
28
56% document trips via social media daily.
29
Mongolia Gobi solo trips by 7% adventurers.
30
63% prioritize scenic drives over speed.
Interpretation
Trip Patterns & Preferences Interpretation
Overlanders show a strong preference for extended off-road getaways, with 55% taking trips longer than two weeks and averaging 5,200 off-road miles, while 68% choose national forests and parks and 42% head to Moab, UT.
05 · Category
Vehicle & Equipment27 stats
01
4x4 pickup trucks used by 45% of U.S. overlanders.
02
Roof top tents sales increased 35% to 250,000 units in 2023 globally.
03
Solar panels average 200W capacity in 68% of overland rigs.
04
Winches installed on 72% of overlanding vehicles worldwide.
05
ARB fridge/freezers top choice for 41% of overlanders.
06
Tire upgrades to 33-35" common in 59% U.S. builds.
07
Suspension lifts averaging 2-3 inches on 64% of rigs.
08
Dual battery systems in 81% of serious overland vehicles.
09
GoFastCampers most popular pop-up camper model.
10
Water storage capacity avg 40 gallons in expedition rigs.
11
Starlink adoption at 15% among overlanders in 2023.
12
Rhino-Rack roof systems on 33% of Australian vehicles.
13
Fuel capacity expansions to 50+ gallons in 52% setups.
14
Inverter power avg 2000W in 70% electrical systems.
15
BFGoodrich KO2 tires preferred by 28% globally.
16
Front runner slimline II roof rack top seller.
17
Air compressors owned by 76% of overlanders.
18
iKamper rooftop tents hold 25% market share.
19
Recovery gear kits in 89% of vehicles.
20
LED light bars 50" size most common at 44%.
21
Engel compressors fridge top in Europe 39%.
22
Jeep Wrangler modified for overlanding by 31% owners.
23
Maxtrax recovery boards owned by 62%.
24
Garmin Overlander GPS used by 27%.
25
Toyota Land Cruiser most popular globally at 22%.
26
Dometic awnings on 35% of rigs.
27
Average overland rig modification cost $25,000.
Interpretation
Vehicle & Equipment Interpretation
Vehicle and equipment choices are getting more purpose-built, with 72% of overlanding vehicles worldwide adding winches and roof top tents rising 35% to 250,000 units in 2023 globally.
report visual · Comparison
Overlanding: Growth and Scale
The market is expanding rapidly while generating sizable regional revenue and ecosystem spending.
The U.S. overlanding sector saw 1.2 million participants in 2023, contributing $4.1 billion to GDP.$4.1 billion
Overlanding vehicle aftermarket modifications generated $1.5 billion in 2023 globally.
$1.5 billion
North American overlanding industry revenue reached $3.4 billion in 2023, up 18% year-over-year.
18%
The global overlanding market was valued at USD 8.2 billion in 2023 and is projected to grow at a CAGR of 12.5% from 202
12.5%
Reference
Cite This Report
This report is designed to be cited. We maintain stable URLs and versioned verification dates. Copy the format appropriate for your publication below.
APA
Isabelle Moreau. (2026, February 13). Overlanding Industry Statistics. Gitnux. https://gitnux.org/overlanding-industry-statistics
MLA
Isabelle Moreau. "Overlanding Industry Statistics." Gitnux, 13 Feb 2026, https://gitnux.org/overlanding-industry-statistics.
Chicago
Isabelle Moreau. 2026. "Overlanding Industry Statistics." Gitnux. https://gitnux.org/overlanding-industry-statistics.
Sources & references
100 datasets cited across this report