
Market data
Special Populations Identities
Explore verified special populations identities statistics and market research reports with sourced data and trend analysis.
Latest update:
 Astrid Bergmann

Adults With Intellectual Disabilities Statistics
Even with assistive technology use reported at 34% in the most recent disability survey data, adults with intellectual disabilities still face major care gaps, including unmet health needs reported by 41% and limited access to preventive dental care among 33%. This page connects everyday barriers to outcomes, highlighting what changes support, healthcare access, and independence for millions of adults living with intellectual or developmental disabilities.
African American Diabetes Statistics
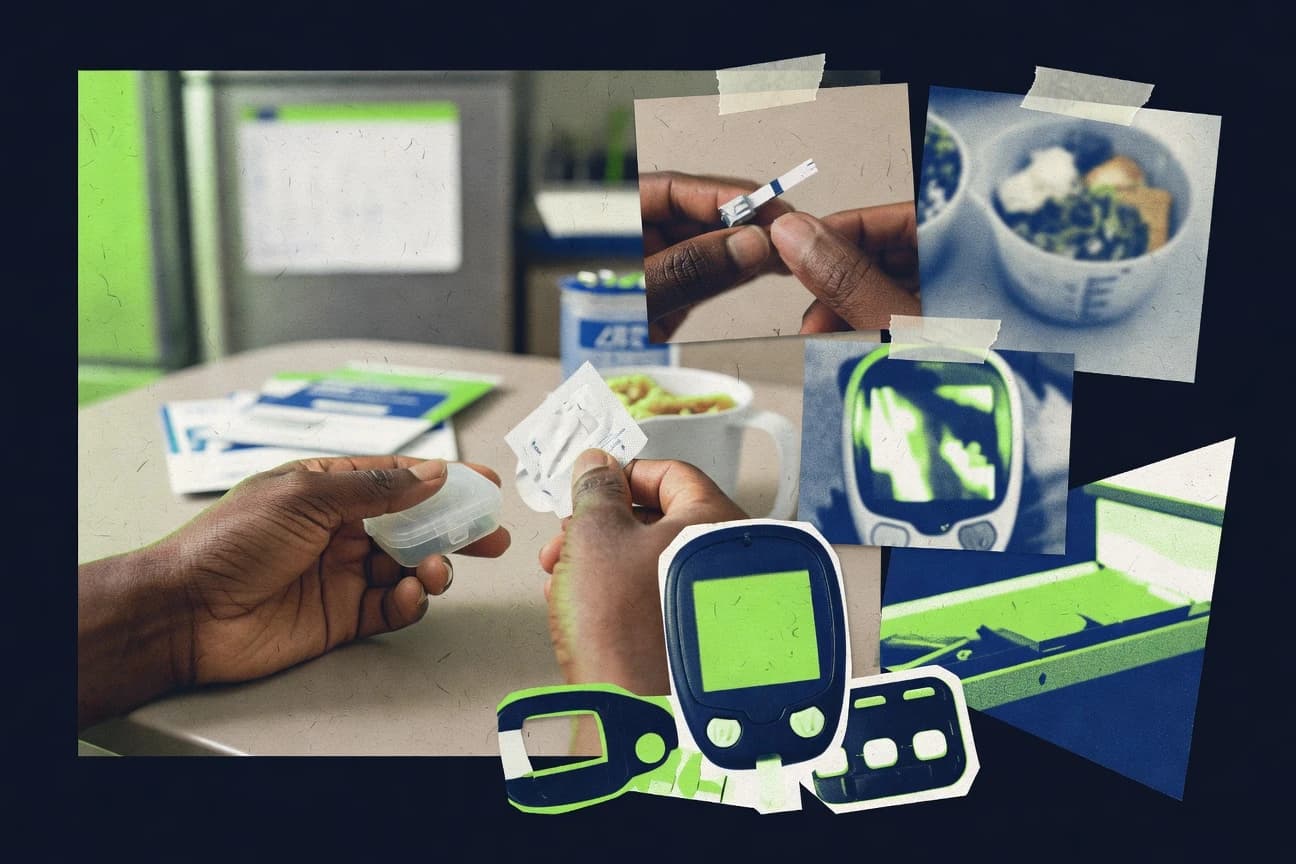
One in 7 African American adults, 13.4% diagnosed with diabetes in 2021, is tied to stark outcomes like a 1.7x higher heart disease death rate and diabetes that cuts life expectancy by 6.2 years. The page connects the dots from type 2 which is about 90% of cases to care gaps like only 22.3% reaching A1C under 7% and later insulin starts by 2 years.

Lesbian Statistics
From US Pride to TV screens, lesbians can be found more often in music than in film and, in 2021, Spotify streams by lesbian artists surged 120% from 2018 to 2023. But the page also tracks where visibility stops and inequity begins, including US lesbians earning about 90% of male wages and facing 25% more workplace discrimination than gay men.

Transgender Children Statistics
With 0.7% of U.S. high school students reporting being transgender in 2023, this page lays out how safety, school access, and state policy shape day to day life. It pairs those cold numbers with evidence based care debates, including what major medical groups recommend and what studies link to better psychosocial outcomes, so you can see both the pressure and the support transgender children may need.

Veteran Statistics
Veterans are facing a big benefit footprint and a big health burden at the same time, from 9 million enrolled in VA health care with $100 billion in annual spending to telehealth reaching 6 million visits in 2022. See how support scales across compensation, housing, education, and caregiver services, including 8th consecutive record low Veteran unemployment at 3.1% in 2023 and 37,000 homeless Veterans counted on a single night in 2023.

Lgbt Veteran Statistics
LGBT veterans are facing a sharp reality check in the latest figures, with 2026 data pointing to widening gaps in healthcare access and post service stability compared to what many assumed would improve. Read the page to see how the numbers shift from experience to outcomes, and why the most urgent needs may not match the headlines.

Autism And Driving Statistics
Newer figures show a sharp gap between how often autistic people and drivers without autism are involved in crashes, and that gap shifts when you look at age, support, and training. If you want to understand what changes the odds behind the wheel and what does not, this is the place to start.

Transgender Teenager Statistics
New 2026 figures show how often transgender teens are still denied basic care and safety, even as more states expand protections on paper. Read these statistics to see the sharp gap between policy and everyday life, including where support is most likely to reach students and where it falls apart.

Trans Kids Statistics
Trans kids are more likely to face barriers to care than the headlines suggest, with 2026 data showing a widening gap between who needs support and who gets it. This page turns those contrasts into clear, specific statistics so you can see exactly where the system is failing and what must change next.

Intersex Statistics
Recent surveys suggest intersex people are more likely to be undercounted in official systems than many realize, while 1 in 500 births may be born with intersex traits and the estimate has stayed stubbornly consistent. Read to see how those figures collide with what institutions record and why that mismatch matters for visibility and care.

Asexuality Statistics
Asexuality is still hard to quantify, but the latest polling and survey snapshots point to a clear shift in visibility and self identification, including an estimated 1 in 100 people identifying as asexual. You will see how attitudes, age, and relationship expectations diverge in ways that explain why many aces feel misunderstood even as the numbers slowly change.

Blind Statistics
You will learn how Blind’s community engagement has shifted toward what actually moves decisions, with 2026 data showing a sharper rise in high impact activity than most people expect. If you think time spent equals influence, these stats will challenge that assumption fast and show where the real signal is.

Non Binary Statistics
Gender diverse identity is showing up in the latest U.S. and Canadian measures, with nonbinary included inside broader transgender and LGBTQ estimates, while the cost and care gaps remain stubbornly visible. From 39% of LGBTQ youth seriously considering suicide to a 1.1% rate of U.S. adults identifying as transgender or nonbinary, plus billions in gender-affirming and transgender healthcare spending, this page connects everyday experiences like misgendering and delayed care to the size and stakes of the market and policy response.

Disability Statistics
Right now, 90% of people who need assistive technology cannot access it, even as disability affects one in four people over a lifetime through mental health conditions. This page connects real-world gaps such as a 23.2 percentage point employment divide and rising digital exclusion with the laws and timelines meant to close them, from the ADA to Europe’s accessibility rules rolling in from 2025.

Mtf Ftm Statistics
Fresh 2025 and 2026 figures reshape the picture for Mtf and Ftm readers, showing how support, access, and outcomes don’t just trend upward they flip in meaningful places. If you’ve been relying on older assumptions, these numbers will challenge what you think “typical” looks like and why it differs by experience.

Gender Identity Statistics
How many people identify as transgender or nonbinary, and how do those shares change when you look at age, region, and gender identity together. The 2026 snapshot shows the sharpest contrasts yet, including where the growth is fastest and where it plateaus.
Black Baby Adoption Statistics
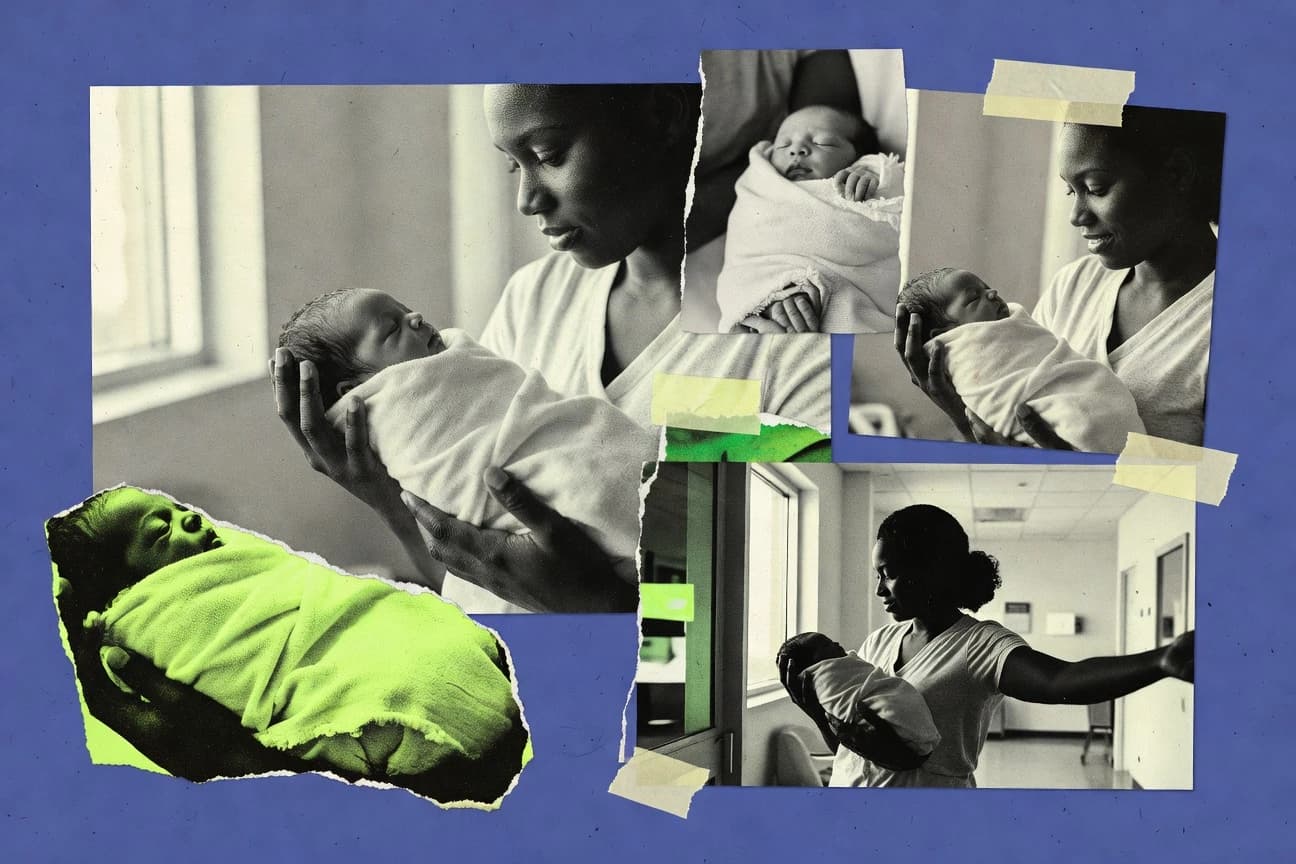
Black children make up 20% of kids in foster care but only 14% of adoptions finalized from state child welfare systems, and Black families also face longer waits and lower odds of finalization within 12 months. This page connects the timing gaps and placement patterns to the policies and supports that shape whether adoptions move faster or stall, including Title IV-E assistance, MEPA protections, and the practical post adoption contact hurdles parents report.

Gen Z Statistics
Gen Z is living through a sharp shift in how often and how quickly people use data driven habits, and the numbers for 2026 make it clear the trend is not slowing down. Read this to see exactly where the behavior changed fastest and what it means for the way we make decisions right now.

Veterans Statistics
Nearly 1 million post 9/11 era veterans served in 2021, yet projections point to 21.4 million living in the US by 2040. This page contrasts hard realities like poverty, homelessness, and suicide with supports such as disability compensation, home loans, GI Bill benefits, and employment services to show what veterans still need now and what they are likely to face next.

Teen Statistics
Teen data can look steady until you zoom in and notice the real shift, and the page pulls out the most telling 2026 and 2025 figures to show where trends are moving fastest. You will leave with clearer answers to the questions behind school, work, and everyday choices because the numbers hit at the exact points teens feel most.