Market data
Military & Defense
Explore military & defense statistics and market research reports with sourced data and trend analysis.
Latest update:
 Yumi Nakamura


Statistics · 2026
China Navy
With 3 carriers already in service and more heavy hitters on the way, China’s naval buildout looks less like steady growth and more like a direct push toward carrier aviation at scale, including 300 plus carrier capable aircraft projected by 2030 and 80,000 ton Fujian commissioning with EMALS catapults. This China Navy statistics page also stacks the rest of the force behind that focus, from 200 plus auxiliaries and 60,000 plus amphibious lift plans to 300 plus day underwater endurance and integrated modern shipborne EW across most new hulls.

Statistics · 2026
Taiwan Invasion
A Taiwan invasion is modeled as a simultaneous shock to chips, cash, and cities with 2025 Bloomberg shutdown analysis pegging semiconductor losses at $1 trillion each year and Rand estimating a $10 trillion world economy hit in year one. It also stacks the operational costs, from CSIS wargames that place Taiwan at roughly 20 percent air readiness within days and a 9 percent US inflation spike tied to chip shortages, so you can see how quickly military timelines turn into global economic ones.

Statistics · 2026
Middle East Conflict
With Gaza deaths now topping 41,000 and injuries reaching about 93,000 since October 7, 2023, the page tracks the grim arithmetic alongside the scale of displacement and broken services, including 500,000 people at famine-level risk. It also sets the Gaza toll against Lebanon and wider regional spillovers, where more than 2,300 Lebanese civilians have been killed and 93,000 Palestinians injured, showing how fast one conflict becomes a whole geography of strain.

Statistics · 2026
Hypersonic Weapons
See how the hypersonic race is shifting in 2025 with planning and procurement that could lock in new competitive edges, from France’s €3.8B budget for 2023 to 2030 and the Australia HIFiRE program reaching Mach 8 in 2017 to Russia’s Avangard deployed to the 13th Missile Division. The page pairs hard performance contrasts like Avangard Mach 20 to 27 maneuvering and Zircon’s reported 1,500 km class range with the unglamorous reality of test cadence and failures, including ARRW’s Sep 2021 booster setback.
Statistics · 2026
Turkey Nato
Turkey’s NATO snapshot puts hard capability against hard constraints, from 2,231 tanks and 206 F-16s to 16 submarines, while air defense priorities show a sharp tension with just four S-400 batteries acquired and Patriot PAC-3 seeking no delivery. It also links today’s readiness to budgets and manpower, with defense spending hitting $15.8 billion in 2022 and a second-largest standing force in NATO with 355,200 active personnel, plus Bayraktar TB2 exports and domestically planned Altay and TF-X programs shaping what comes next.

Statistics · 2026
Iran Nuclear Program
See how Iran’s centrifuge buildout and stockpile growth moved from gradual enrichment to near weapons grade momentum, including 5,473 advanced centrifuges enriching as of August 2023 and a 60 percent HEU stockpile of 144.8 kg (hex) by May 17, 2023. The page connects the plant level changes at Natanz and Fordow to safeguards and verification friction, showing why IAEA access gaps and production scaling now sit uncomfortably close to breakout estimates.
Statistics · 2026
Tactical Nuclear Weapons
See how 2024 estimates place Russia at about 1,912 non strategic warheads while the United States holds roughly 230 tactical nuclear weapons, then trace that gap to delivery details like B61-12 hosted in Europe and W76-2 on Virginia class submarines. You will also compare striking accuracy and yield contrasts, from 10 meter precision F 16 delivery to Iskander M options and low yield W76-2 settings, alongside the major treaties and removals that reshaped today’s tactical count.

Statistics · 2026
Israel Defense Industry Statistics
Israel’s defense industry is forecast to keep widening its economic footprint, with defense-related output already driving 25% of manufacturing GDP and creating 250,000 indirect jobs, plus a 30% surge in TASE defense stock performance in 2022. From record exports reaching $12.5 billion to R&D intensity at 8.5% of defense sales and local production cutting IDF costs by $5 billion a year, the statistics page shows how Iron Dome components, drones, and munitions translate into both national security and measurable growth.

Statistics · 2026
Military Recruiting Statistics
With FY2023 shortfalls spreading across services despite a still massive DoD recruiting effort, the Army missed its target by 15,000 and the overall active and reserve accessions still topped 150,000, while waivers, disqualifications, and recruiter capacity are quietly reshaping what “success” looks like. This page puts the fulfillment gaps, the marketing push, and the quality tradeoffs side by side so you can see exactly why the pipeline is struggling even when the budgets and impressions are rising.

Statistics · 2026
Greece Defense Industry Statistics
Greece’s defense industry is spending at NATO-mandated pace and scaling local capability alongside it, with 2024 targets at 3.5% of GDP and planned spending of about 7.2 billion euros tied to advanced procurement like F 35 planning. From 8.2% of defense sales going into R and D and major missile and naval technology work to 45,000 defense related jobs in 2023 plus arms exports rising to 1.1 billion euros in 2023, the page maps how money, manufacturing, and upgrades are reshaping Greek power projection.

Statistics · 2026
South Australia Defence Industry Statistics
South Australia’s defence industry pumps $12.4 billion a year into state output, with $1.2 billion in defence exports and $3.5 billion in contracts awarded to local businesses still pulling economic weight. Behind the headline growth, the state’s multiplier effect lifts $2.80 per direct dollar into 45,000 indirect jobs, while defence R and D reaches $450 million in 2023 and the AUKUS submarine pipeline adds a projected $2.3 billion GDP uplift over the decade.

Statistics · 2026
Obama Drone Strike Statistics
Between 2009 and 2016, Obama era drone strikes in Pakistan, Yemen, and Somalia involved 563 strikes total, yet reported civilian death estimates range wildly from 12 to 4,026 across studies, with TBIJ confirming 28 Pakistan strikes with civilian deaths and critics putting civilian casualty rates at roughly 10 to 20 percent. The page tracks the sharp contradiction between official US and Pakistan tallies and findings from organizations such as TBIJ, Amnesty, and HRW including Pakistan’s North Waziristan, where 365 of 430 strikes concentrated, and Yemen where HRW documented civilian deaths in multiple attacks.

Statistics · 2026
Turkish Defense Industry Statistics
Turkey’s defense and aviation exports hit $3.2 billion in 2022, but the quieter engine behind that surge is harder to spot without the details on R&D depth, from ASELSAN’s 1,000 plus R&D personnel to Turkey’s 98,000 R&D staff. See how SSB procurement and its 400 plus offset projects by 2021 feed a 1,700 plus company and university collaboration network while Bayraktar TB2 and HİSAR capability targets add a battlefield reality check to the figures.

Statistics · 2026
War In Ukraine Statistics
Ukraine’s humanitarian and economic toll is still staggering even by the latest tracked figures, from 8,911 civilian casualties including 1,000+ children to 3.4 million people needing urgent help in 2023. At the same time, the war reshaped far more than front lines, with power and food systems strained and Black Sea shipping volumes dropping by about 80 percent, making the monthly casualty peaks and global ripple effects impossible to ignore.
Statistics · 2026
Türkiye Defense Industry Statistics
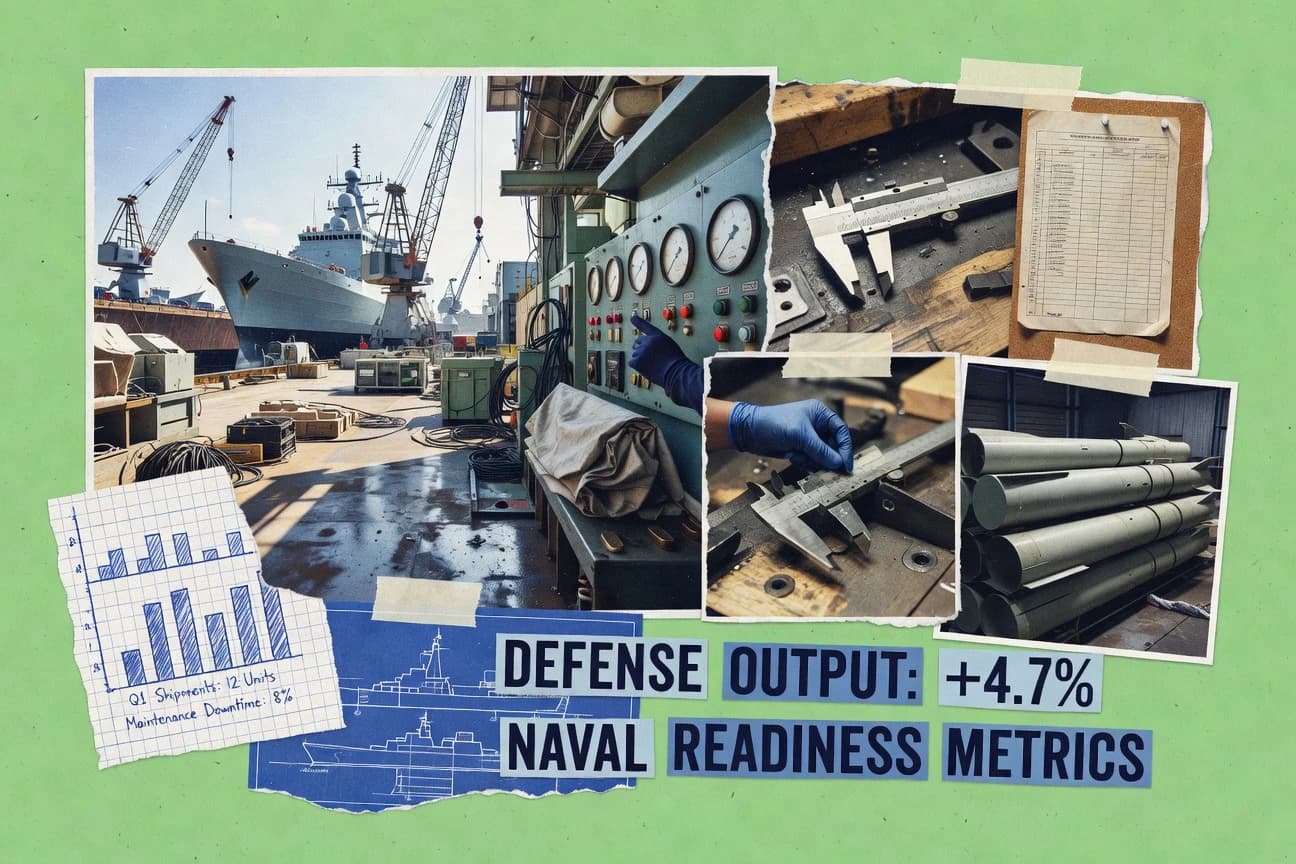
Türkiye defense industry keeps scaling, with employment reaching 132,000 overall in 2023 and a clear R&D pull from major firms like ASELSAN, which grew its R&D staff to 5,000. The page sets the export picture against the workforce one, from drone output and radar revenue to localization gains, showing how capabilities are expanding faster than headcount on the surface suggests.
Statistics · 2026
Saudi Defense Industry Statistics
Saudi defense localization is moving from target to requirement fast with 50 percent by 2030 and local content embedded in at least 45 percent of contracts under the National Industrial Strategy, while the 2023 defense market is estimated at 13.6 billion with military spending up 12 percent year over year. Track how Najran sustainment and HALCON’s expansion sit alongside export ambitions of 4 billion by 2030, and why the wider resource and logistics metrics from oil rents to port coverage matter for what can be produced, sourced, and maintained at scale.

Statistics · 2026
Defense Statistics
With AI, cloud, and cyber risks rising as fast as procurement momentum, you will see how 63% of defense officials expect AI to shape future force design alongside 90% of organizations reporting a cloud security incident and 2,300 plus CVEs published in the last 12 months of 2023. The same page traces the money through near term buying and modernization at scale, from a $56.9 billion FY 2024 DoD procurement topline and $2.0 billion for space launch obligations to major NATO and US industry capacity, then connects it to stabilization pressures with $4.6 billion in 2023 military assistance to Ukraine.

Statistics · 2026
European Defence Industry Statistics
European defence budgets are still largely awarded at home, with 70% of procurement value staying nationally rather than becoming truly cross border, even as €30.0 billion is earmarked for the European Defence Fund across 2021–2027 and NATO members plan €40.0 billion of defence investment at European level in 2024. The page sets those procurement frictions against industrial scale ups like ASAP’s €2.0 billion planned support and ammunition and missile production funding worth €1.7 billion under EDIRPA, so you can see where policy ambition meets delivery capacity.

Statistics · 2026
Polish Defense Industry Statistics
PLN 186.5 billion is now on the table for Poland’s 2024 defense budget proposal, pushing spending toward 4% of GDP while R&D, cyber defense, and domestic production scale fast enough to keep up. See how a 73% modernization jump and a surge in exports sit alongside a tight procurement debt picture and a rapidly expanding defense workforce, turning policy commitments into measurable industrial output.

Statistics · 2026
Brazil Defense Industry Statistics
Brazil’s defense procurement is still pulling in US$2.3 billion of military equipment imports in 2023, with aircraft and airframe parts the most concentrated at 18.7%, even as local-content rules gradually reshuffle the supply chain and services now account for R$3.2 billion. See how contract execution, sustainment readiness, and R&D funding are moving together, including cyber and electronic warfare investment and domestic qualification milestones that reveal whether Brazil is closing dependency or simply shifting it.