GITNUX MARKETDATA
Browse Our Category
Lifestyle Hobbies
Latest update:

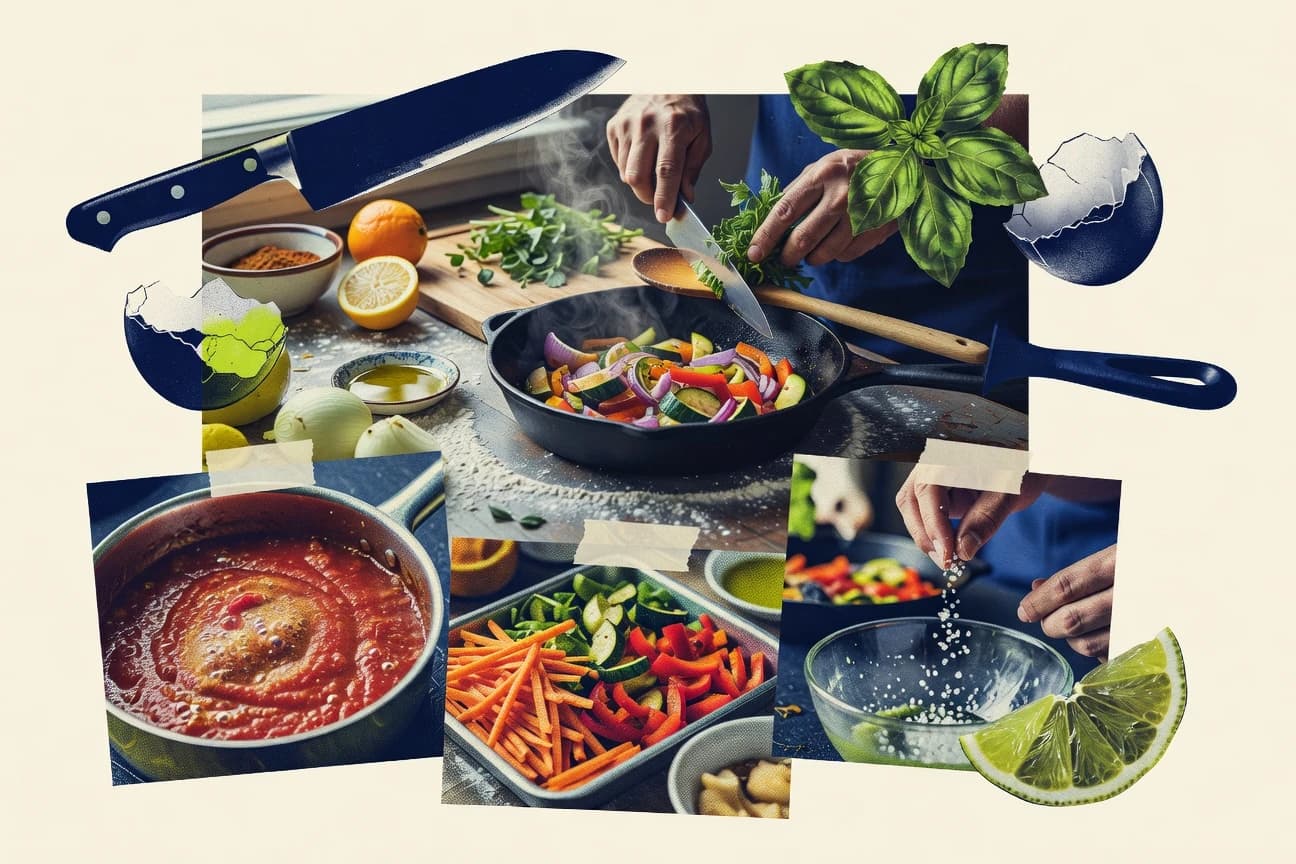
Cooking Statistics
From 48 million US foodborne illnesses a year to 6.6% higher restaurant prices and US food at home up 5.4% year over year in 2023, these cooking stats explain why what you buy and how you cook matters for both budgets and health. Then compare the rise of smart kitchens and online food habits with markets projected to hit $182.2 billion for online delivery and $14.1 billion for meal kits in 2024, and see what is shifting from stove to screen.

Deer Hunting Statistics
New 2025 deer hunting data shows hunters are tightening their shot planning and timing as conditions shift, and the results are showing up in measurable changes to success rates and tag pressure. If you only count “bigger bucks,” this page will challenge that habit with the kind of field level numbers hunters can actually use before the season turns.

Percussion Industry Statistics
Percussion demand is being reshaped by fast moving economics and new buying habits, from $1.7 billion in the 2023 global drum market to $7.4 billion in music education that feeds the next generation of players, while US prices for musical instruments rose 1.6% in 2024 and steel, freight, and energy costs keep tightening margins. You will also see how makers and retailers respond to behavior like 41% of buyers planning to shop online and how electronic percussion is riding pedal and smart instrument growth, plus what current safety targets mean for practice spaces pushing past 90 dBA.

Trophy Hunting Statistics
Trophy hunting data shows protection tied to fees is scaling wildlife outcomes, from Namibia’s conservancies expanding to 170,000 km² and elephant populations up 7% in conservancies between 1995 and 2015 to Zimbabwe’s CAMPFIRE growth from 20,000 to 300,000 animals. It also challenges assumptions with tighter quotas and measurable anti-poaching effects, including 1,000 elephants protected annually in Zimbabwe and lion densities 50% higher in Tanzania’s hunting zones than in non-hunted areas.

Gardening Industry Statistics
Gardening is no longer a niche hobby with 55 percent of U.S. households participating in food gardening, while eco minded practices spread fast from composting to water saving and container growing. This page tracks how participation, spending, and jobs are shifting across generations and cities, including Gen Z gains, surging hydroponics, and the $114.5 billion U.S. lawn care and gardening services market, so you can see where the industry is growing and where it is changing next.

Boat Ownership Statistics
U.S. recreational boating is still dominated by smaller, outboard powered boats with 76% under 26 feet and outboards driving 64% of the fleet, while the average boat is aging to 22 years and shows no rush to retire. You will also see how buying patterns are shifting as pontoon boats take 22% of new sales and PWC ownership sits at 2.8 million, alongside the business side of boating reaching $221 billion in economic impact in 2022.

Gardening Statistics
Home gardens lean hard into results, with tomatoes in 86% of vegetable plots and hydroponics using 90% less water than traditional beds. Then reality gets even sharper, from 6 to 8 hours of sun and soil pH precision to how night accounts for 15% of plant growth and raised beds controlled by 40% of gardeners change what actually thrives.

Recreational Fishing Industry Statistics
Recreational fishing pulled in $126 billion in U.S. economic output in 2022 and supported 826,000 jobs, but the participation story is just as striking, with 40 million Americans fishing at least once and women reaching 9.5 million anglers. See how spending patterns, catch-and-release survival rates, and state-level conservation tools like slot limits and lead tackle bans add up across freshwater, saltwater, and the tournament scene.

Astrology Statistics
Astrology belief is not evenly spread, with women far more likely to buy into it than men in the US at 32% versus 16%, while political identity also sharply splits views at 42% among liberals versus 14% among conservatives. This page pulls together the latest global patterns and market size, where the astrology apps industry hit $4.3 billion in 2023, then juxtaposes the cultural pull with how often astrology predictions actually outperform chance.
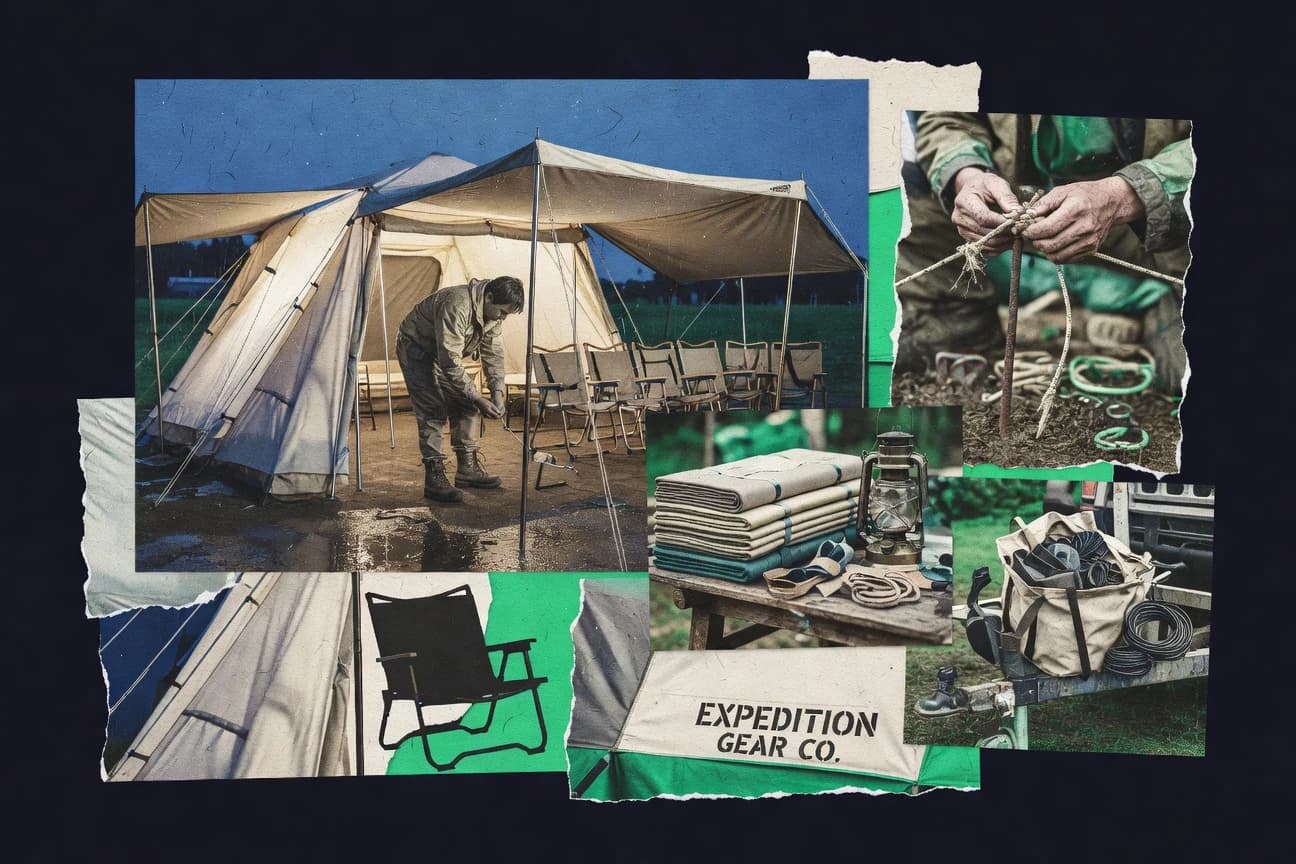
Camping Industry Statistics
Camping demand is bigger and more diverse than ever, with 78.4 million U.S. households going camping in 2023 and 42% of campers now millennials, while Gen Z makes up 27% of new campers. The page links spending and behavior to real identity trends too, from 52% of campers having household income above $75,000 and women rising to 52% of participation, to the lifestyle split between 34% of new participants being remote workers and 22% of lower income campers favoring tenting.

Zodiac Statistics
From the 408 symbol Z408 solved in just 7 days to the Z340 break after 51 years, the page tracks how Zodiac’s cipher messages, claims, and phone taunts collide with investigators’ biggest swing and failures, including Z13 still unsolved as of 2023. If you want to understand why the case keeps resisting closure, the tension is right there in the evidence gaps, DNA mismatch, and the crossed circle that appears again and again.
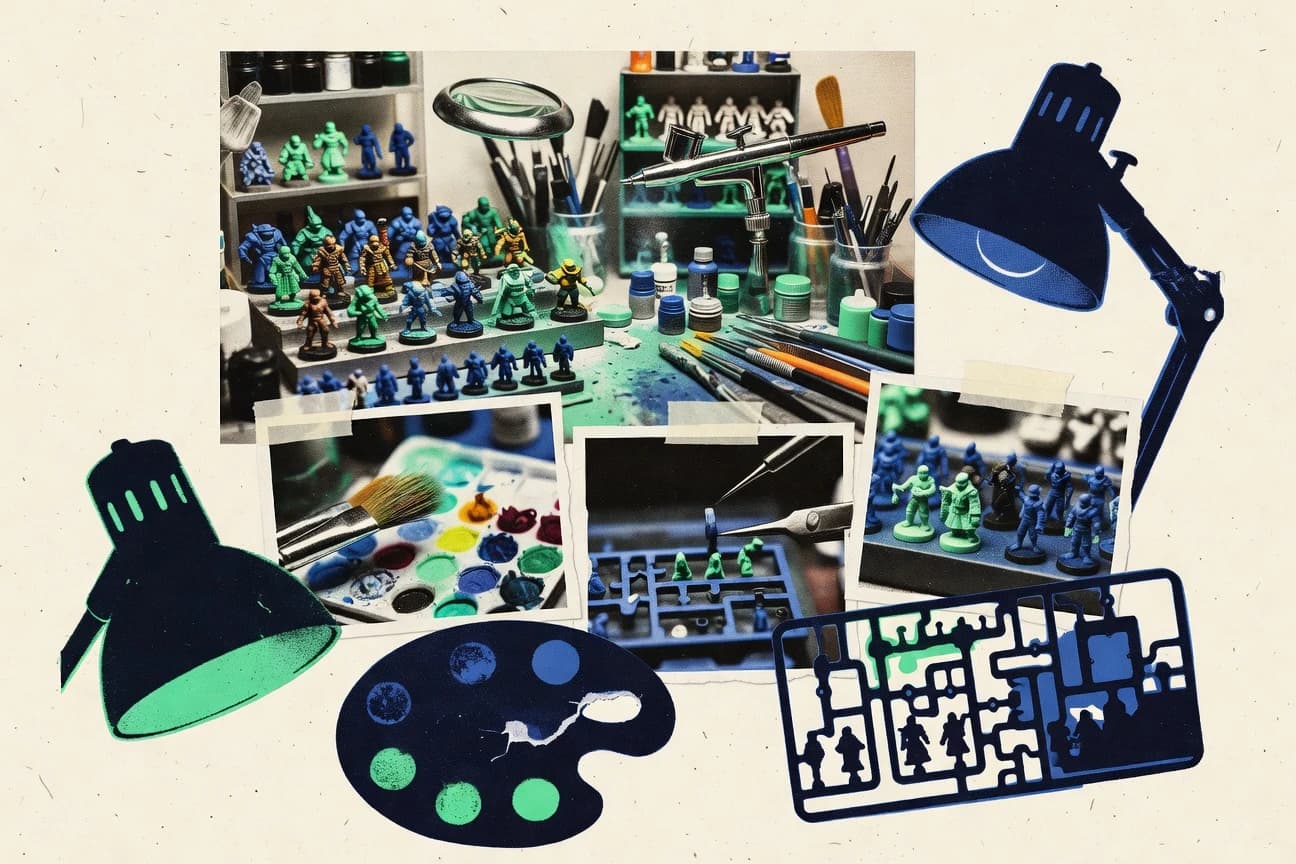
Miniatures Industry Statistics
See why 42% of miniatures enthusiasts have college degrees while buyers skew heavily urban at 62%, even as fandom keeps widening with Gen Z now 25% of new entrants. This Miniatures Industry statistics page also tracks the trade shift to digital and custom making, where 65% of buyers own 3D printers and online sales surged 22% in 2023 to account for 45% of global revenue.
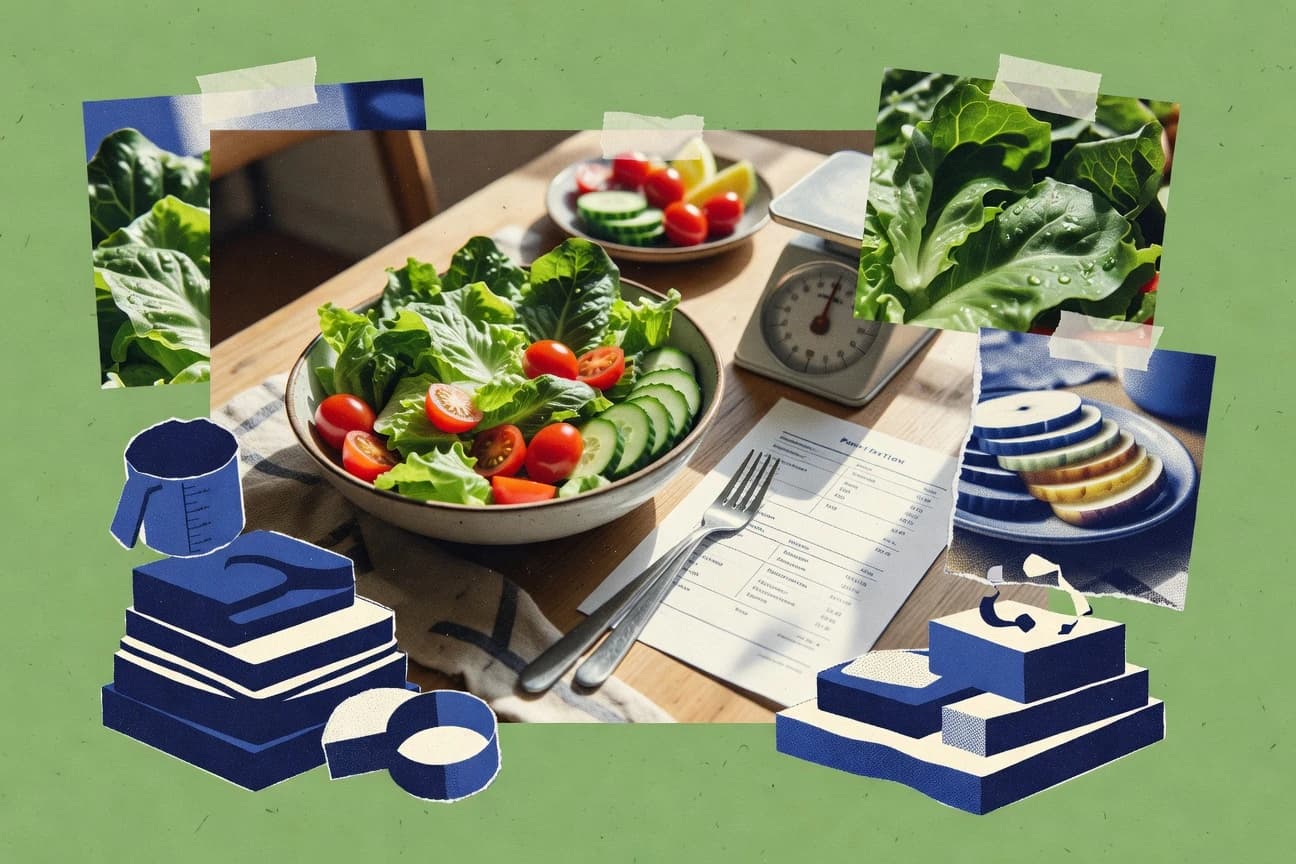
Eating Healthy Statistics
From a 2025-ready roundup of cancer, heart, diabetes, mood, and weight outcomes, this Eating Healthy page translates everyday food choices into striking targets like 3 plus cups of green tea lowering stomach cancer risk by 30% and 90 g a day of whole grains cutting gastric cancer by 40%. It also turns the surprise tradeoffs into practical guidance, showing how fiber, plant foods, and the Mediterranean style of eating can reshape risk from cardiovascular deaths to depressive symptoms.

Quilting Industry Statistics
With 11 million Americans quilting in 2023 and online supply sales hitting $1.5 billion in 2023, this page captures how modern habits are reshaping a hands-on craft, from Gen Z growth of 35% between 2020 and 2023 to 41% of quilters buying supplies online exclusively. Expect a sharp reality check on time, community, and spending as quilters average 150 hours a year while 65% belong to guilds and 78% gift quilts annually, plus surprising signals like 33% left-handed and 48% of older quilters quilting for therapy.

Van Life Statistics
Van life is scaling fast and getting louder online as Google search interest for van life spiked 35% in Q4 and group membership jumped 28% YoY to 1.2 million members. Want to understand who is really doing all the building, traveling, and posting plus what it costs and how safe it can be under the hood based on the latest community, social, health, and safety stats.

Leisure Industry Statistics
Leisure Industry’s 2023 data tracks a comeback that still has momentum with global entertainment and media at $2.8 trillion and live events rebounding to $1.4 trillion. From Netflix’s 260.28 million subscribers and 6.6 billion cinema admissions to tourism expenditure hitting $1.4 trillion and sustainable travel projected to reach $11.53 trillion by 2032, it’s a single page that connects what audiences watch, buy, and attend.

Country Club Membership Statistics
Club pricing and demand keep moving fast, with industry revenue up 7% to $28 billion in 2023 and waitlists for elite clubs still averaging 200 to 500 applicants per opening. You will see exactly how membership costs can swing from social fees that are 40 to 60% lower than full golf to equity buy ins averaging $250,000 in major metros, plus what demographics and amenities from cart path fees to pickleball usage say about who clubs are building for now.

Moving Stress Statistics
Daily mindfulness cut moving cortisol by 24% after just 2 weeks, while hiring movers reduces physical stress and injury risk dramatically, dropping strains to 12% from 45%. If you want fewer sleepless nights, faster packing, and less financial shock from hidden fees, this page connects the mental and body level stress dots to the actions that actually change outcomes.

Baking Statistics
Bread habits are getting reshaped by nutrition and convenience, with 35% of global consumers now hunting for gluten free options since 2018 and U.S. millennials eating 28% more artisanal bread per capita than baby boomers. You will also see how ingredient and market shifts are moving fast, from $496.4 billion in the global bakery products market in 2022 to fast growing categories like organic and vegan, plus calorie and fiber realities behind everyday choices like baguettes, bagels, and sourdough.

Piano Industry Statistics
U.S. piano buying is being reshaped by a clear new split: 28% of 2023 buyers are first-time owners under 35, while 35% of U.S. owners are aged 45 to 64 and the highest Midwest ownership hits 22%. Scroll through Piano Industry’s latest figures and see how online research drives 62% of purchases, digital and silent practice preferences are accelerating, and where the money and momentum are landing.