GITNUX MARKETDATA
Browse Our Category
Lifestyle Hobbies
Latest update:


Reading For Pleasure Statistics
Pleasure reading is doing more than entertaining people. From 82% of UK adults reporting lower stress after sessions to higher sleep, sharper memory, and improved wellbeing across age groups and countries, the page reveals how regular reading habits can translate into measurable real life benefits.

Board Game Statistics
See how board gaming has widened well beyond the stereotypical game night, with 25% of US households owning at least one game and over 100 million people playing weekly worldwide. Then line up the meta you might not expect, from social media fueling 70% of discoveries to apps used by 65% for tracking, plus solo and co op rising alongside the new Gen Z slice that now makes up 25% of the market.

Pool Statistics
From Simonis 860 and 3.5 inch pockets to K-55 cushions and 0.25 inch level tolerance, this page maps every tournament-ready spec of modern 9 foot tables and cues. You will also see the sharp practical contrasts players feel, like legal 9 ball breaks, 70 to 85 percent cloth speed targets, and how a 16 to 19 ounce butt and 12 to 14 mm tip can change what “control” means.

Musical Instrument Industry Statistics
From 35% of U.S. retail sales moving online to 28% of buyers swayed by TikTok demos, the 2023 musical instrument scene is being remixed by screens and social proof. The page pulls together the full contrast between where instruments are made, who buys them, and what is changing now including women up 12% from 2019 in global guitar purchases and used instruments topping USD 1.2 billion on Reverb.com.

Saddle Industry Statistics
Premium is where the market gets quietly demanding. In 2023, women aged 25 to 54 bought 620,000 saddles, while 35 percent of purchases came from competitive riders and professional equestrians drove 35 percent of custom sales, even at just 12 percent of buyers.

Crafting Industry Statistics
With Etsy bringing in $25.9 billion in 2023 and Shopify Handmade merchants generating $4.0 billion GMV in the same year, the demand engine for real craft keeps getting louder even as factory costs bite, including energy at 23% of production challenges. This page connects those storefront signals to upstream pressure points like industrial automation adoption at 58% of US manufacturers and quality cost hits averaging $1,300 per employee in US manufacturing so you can spot what will shape craft supply chains next.
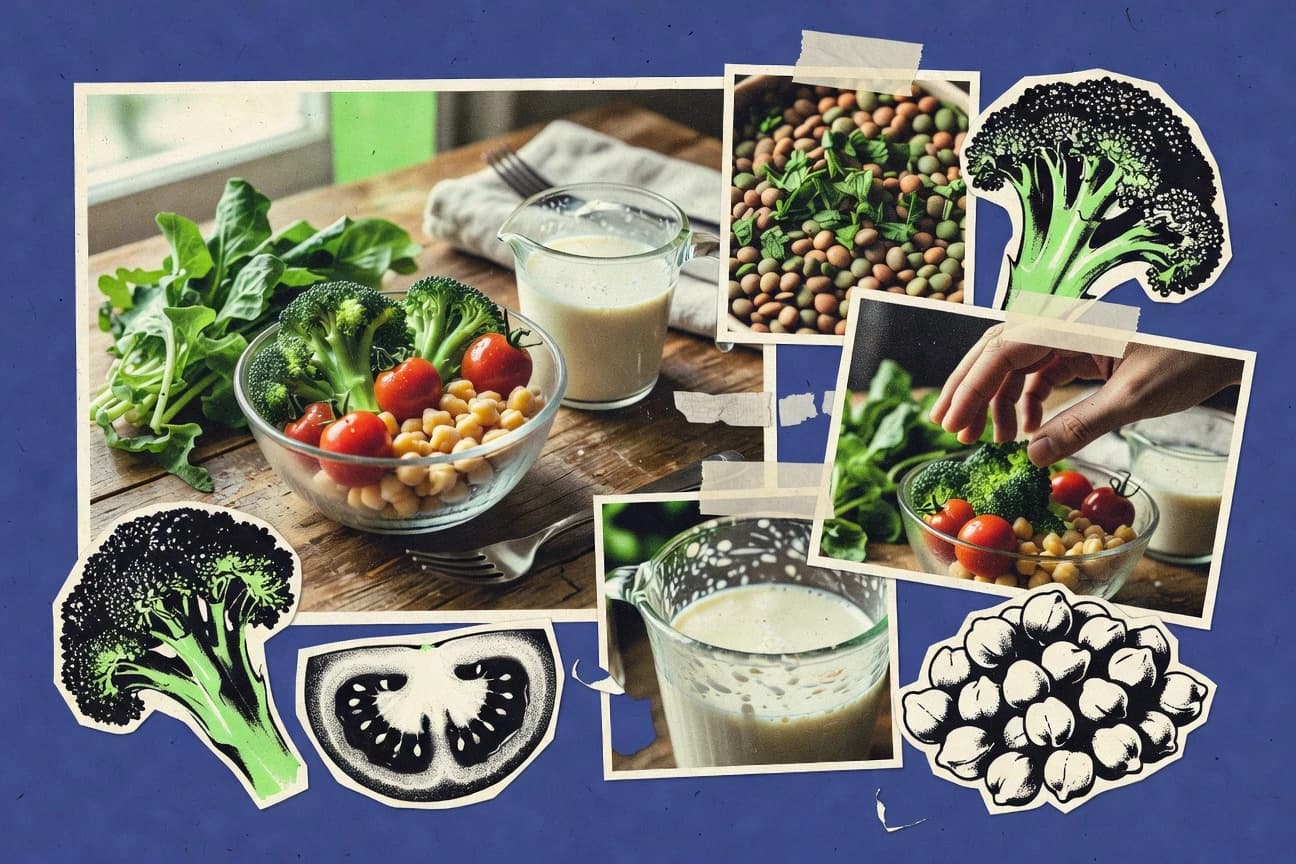
Plant Based Diet Statistics
With the global organic food market at €135.0 billion in 2023 and plant based protein supply still scaling, this page connects the money behind plant based demand to what it means for health and planet. You will see projections such as the plant based meat market reaching $33.9 billion by 2030 alongside evidence on lower cardiometabolic risk and the climate math of shifting diets away from livestock.

Eagle Scout Statistics
See how the Eagle pipeline blends discipline and service, from 21 merit badges with 13 Eagle required to a service project averaging $25,000 in value, then test your assumptions against the pass rate of 95% on the first board review. The page ties those specifics to real outcomes, including 71% of Eagles voting and college graduation at 90% versus 70% nationally, so you can measure Eagle’s impact with numbers that hold up.

Asmr Statistics
With 70% of TikTok users in 2022 saying they use the app to relax and 45% of study participants reporting ASMR helps them unwind, this page turns “tingles” into measurable stress relief, backed by peer reviewed research and psychophysiology. It also connects the craft to the business side where 76% of people report emotional calming from ASMR stimuli and where global audio and influencer markets now reach $18.4B and $31.9B, explaining why ASMR creators, microphones, and sponsorships are getting serious momentum.

Crochet Statistics
From 20% of crafters spending 5 to 10 hours a week on crochet to Pinterest delivering 1.1 billion impressions of crochet content, this page ties yarn demand to real maker behavior and massive audience pull. It also connects cost pressures and supply chain reality, like a 0.30 average standardized improvement in mental health from arts participation and 0.4 effect sizes from group craft studies, so you can see why crochet is growing both creatively and economically.

Playing Cards Industry Statistics
U.S. buyers snapped up 10.5 million playing card decks in 2023 while global playing card retail sales reached $4.6 billion, with Europe taking a dominant 34.2% share, so the page tracks how demand concentrates even as deck sales are a tiny slice of the wider cards category. It also connects market size to supply, shipping, and inputs from paper and recycled paper through HS 9504.40 trade flows and printed packaging production, linking today’s deck boxes to broader printing and packaging forces alongside digital and board game spend.

Binge Watching Statistics
A weekly binge clocks in at 3.2 hours for the average US viewer yet stretches to 8.3 hours for millennials and 12 hours for Gen Z, with episode counts hovering around 4.7 before the real tradeoffs hit. See how binge routines like Sunday marathons and late night continuations can shift sleep, mood, and even health risk, alongside the behaviors that quietly keep streams profitable.

Pocket Knife Industry Statistics
Pocket Knife Industry buyer behavior in 2023 swings sharply toward slim EDC carry, with urban shoppers grabbing 52% of purchases under 3.5 inches and online reviews steering 72% of sales, where 4.5+ stars can lift demand by 30%. You also get the supply and price forces behind it, from Asia Pacific’s 38% market share fueled by China and India’s 60% global output to premium blades above $100 rising 12% YoY, plus the regulatory and safety friction that shapes what actually gets sold.

Most Dangerous Hobbies Statistics
Home and recreation injuries sent 2,678,000 people to U.S. emergency rooms in 2023, while the causes behind “fun” activities range from alcohol-linked driving crashes to fireworks peaks and preventable drownings. The page connects the hobby market and participation boom to the specific, actionable risks like life jackets and smoke alarms, so you can see exactly where preventable injury risk hides.

Cribbage Statistics
Cribbage starts with Sir John Suckling’s 1630 origins, a separate four card crib for the dealer, then turns into a modern obsession with precision and pressure including a 1M+ download streak for cribbage apps on Google Play as of 2023. Want the useful tension between strategy and luck more than the history, check how hard it is to hit the perfect 29 hand with odds of 1 in 216,580 and how the fastest pace to 121 points can take just four hands.

Monday Statistics
Monday’s stats page pulls together what 2024 and 2025 era work actually looks like, from 27% of global companies using project management software and 61% of employees relying on collaboration tools to 43% of data breaches tied to human error. Then it tightens the connection between tech and outcomes with claims like 83% of organizations adopting continuous delivery and spending set to reach $188.3 billion on security and risk management, so you can see where productivity gains may be earned or lost.

Listening To Music Statistics
Streaming is now so dominant that 68% of US adults listen to music daily, while global listening time climbs to 2 hours 20 minutes a day and algorithms help 91% of Spotify users find new tracks every week. This page tracks the quiet habits and bigger shifts behind the sound, from commute multitaskers and genre preferences to how new tech like spatial audio and voice assistants is reshaping what people actually play.

Healthy Food Trend Statistics
With 67% of Gen Z shoppers seeking sustainable packaging in healthy foods, and 72% of US consumers actively choosing healthier options at the grocery store in 2023, the signal is clear. Meanwhile, Europe’s organic sales hit €54.5 billion in 2022 and the global healthy snacks market is projected to keep climbing at a 6.8% CAGR to 2030, even as 40% of consumers actively avoid ultra processed foods.

Camping Statistics
Camping is worth $44 billion to the U.S. economy and drives $8.9 billion in federal tax revenue, yet the environmental cost is hard to ignore with 500 new contamination sites each year and 7 million tons of CO2 from campfires. Get the full picture of where the money goes, why local economies see a 20% boost, and what safety and stewardship gaps look like across campgrounds, gear, and public lands.

Custom Picture Framing Industry Statistics
A quick look at what is driving custom picture framing demand right now, from a 3.2% annual change in 2023 output service prices and strong store momentum to staffing pressure and online order realities like 34% of customer questions tied to shipping or returns. You will also see how consumers keep choosing personalization with 61% saying customization matters, plus the cost and supply context shop owners feel every day from frame component imports to wood product output gains.