Market data
Health & Medicine
Explore health & medicine statistics and market research reports with sourced data and trend analysis.
Latest update:
 David Kowalski

Statistics · 2026
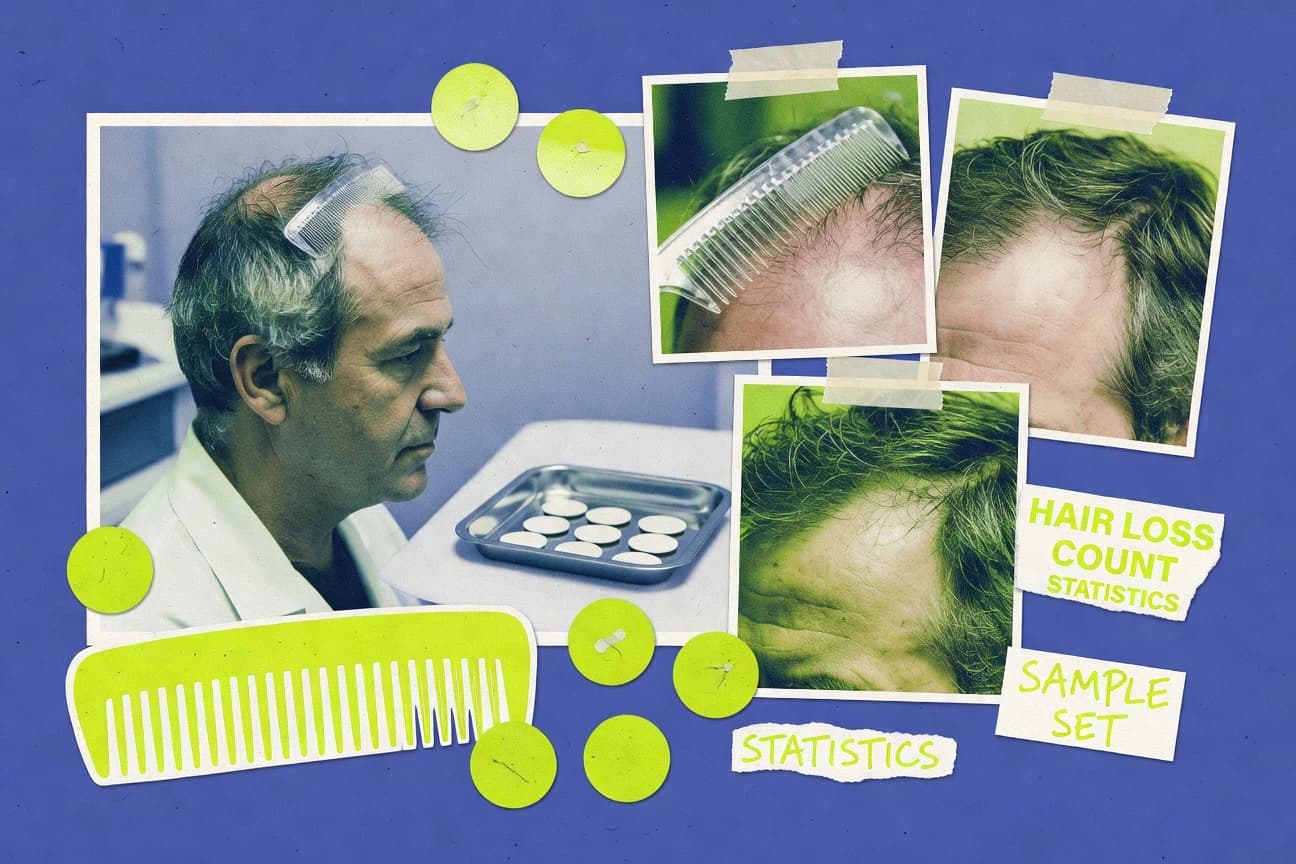
Male Hair Loss Statistics
More than 1 in 5 men in the United States live with androgenetic alopecia, which accounts for about 95% of male hair loss and can begin as early as before age 30 in 2.5–7.1% of cases, yet most treatment patterns are far messier than the science. Find how Norwood Hamilton stages and Sinclair I through VII are used alongside trial results and real world use rates, including a 54% finasteride discontinuation within 1 year and how finasteride, microneedling plus minoxidil, and low level laser therapy compare on hair counts and tolerability.

Statistics · 2026
Hearing Aid Statistics
Hearing help adoption still sits at about 33% globally, even as modern hearing aids, evidence-backed outcomes, and faster market momentum push the hearing aid industry toward a projected $14.8 billion by 2030. You will also see how regulations, pricing, and real-world gains like improved speech in noise and cognitive risk reduction collide with access barriers such as cost limits in the US.

Statistics · 2026
Professional Sports Injuries Statistics
Professional Sports Injuries pinpoints the real scale of risk, from 3.7 million youth injuries each year to 10.5% of pro soccer players getting hurt during training exposures, and shows why workload spikes and sprint intensity can flip risk fast. You will also see how concussion and recovery timelines, imaging and rehab patterns, and prevention programs like neuromuscular training shift outcomes, alongside the costs and market pressures reshaping how teams and clinicians respond.

Statistics · 2026
Longevity Statistics
Healthcare is a staggering $3.6% of global GDP in low income countries versus 15.3% in the United States and 14.8% in France, yet the funding for the longevity pipeline is smaller than most people expect with just 8.0% of health spending going to health R and D in 2021. See how the mix of long term care costs, survival gains, and emerging tech markets like AI in healthcare and digital therapeutics helps explain both the opportunity and the bottlenecks for living longer with better health.

Statistics · 2026
Interesting Medical Statistics
Your body runs on mind boggling numbers and you will see them side by side, from 300 to 500 million alveoli and a brain power draw of 12 to 25 watts to skin that renews every 27 days and a heart that beats about 100,000 times each day. Then the page pivots to what those limits mean for survival, with heart disease still responsible for 17.9 million deaths annually and diabetes affecting 422 million adults, plus a timeline of breakthrough medical tech that reshaped care from vaccines to CRISPR.

Statistics · 2026
Opioid Statistics
US funding for opioid response climbed from $2.0 billion in FY2022 to $2.3 billion in FY2023 and $2.8 billion in FY2024, even as 1.9 million patients still received opioid pain relievers for non-cancer pain in 2020. You will also see the sharp gaps behind treatment and prevention, including that only 28.1% of adults with opioid use disorder got any substance use treatment in 2022, alongside gains like a 90% rise in naloxone prescribing in Medicare Part D from 2013 to 2019.

Statistics · 2026
Meth Relapse Statistics
Even when treatment works, meth relapse remains stubbornly common with about half of people with substance use disorders relapsing within a year and cravings showing up in 80.0% of relapse episodes. This page pulls together the most actionable risk and prevention signals, including contingency management and integrated approaches, plus what high-frequency monitoring and relapse prevention therapy can change.

Statistics · 2026
Drug Relapse Statistics
When treatment ends, relapse is not a slow drift but a fast rebound, with 40% to 60% of people with substance use disorders relapsing after treatment and opioid return-to-use risk spiking sharply when MOUD is discontinued. This page puts the timeline in context so you can see why staying in care and using the right medication and supports can mean the difference between months of risk and long term recovery.
Statistics · 2026
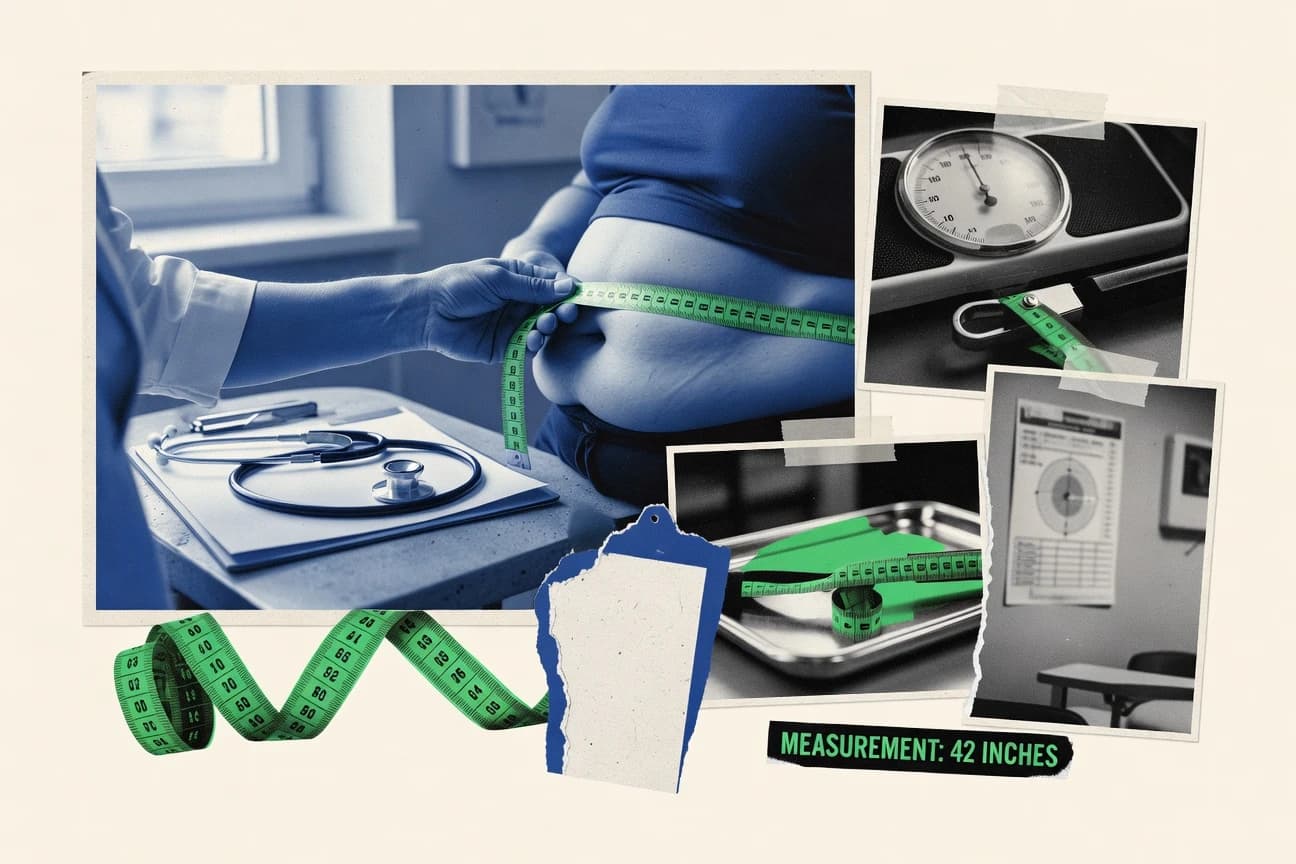
Obesity Statistics
Obesity affects 1.3 billion people worldwide and is linked to millions of deaths, with the global burden now costing about $2.0 trillion each year by 2020. You will also see how risks and spending translate into real life, from US obesity rising to 41.9% in 2017–2018 to treatments like semaglutide and tirzepatide delivering double digit weight loss in major trials.

Statistics · 2026
Kidney Transplant Statistics
A kidney transplant can save lives, yet the risks stack up quickly, with acute rejection affecting 10 to 15 percent of recipients in the first year and urinary tract infections hitting 20 to 35 percent during that same window. This page also connects the longer shadow of immunosuppression and chronic injury, from malignancy rising 2 to 3 fold to BK virus nephropathy driving graft loss in 45 percent of cases.

Statistics · 2026
Fentanyl Statistics
Nearly 90% of fentanyl related overdose deaths involve synthetic opioids, putting fentanyl at the center of the most lethal shift in recent mortality data. You will also see why market size is hard to measure and how enforcement, poison center calls, and FDA approvals each count fentanyl differently, down to what “strength” even means across products.

Statistics · 2026
Drugs Abuse Statistics
For the newest snapshot, U.S. illicit drug use among 18 to 25 year olds hit 39.3% in 2021, while treatment is far from matching the scale of need, with only 10.4% of people with substance use disorder receiving any care and relapse still common after discharge. This page connects the sharp gaps by age, sex, place, employment, and LGBTQ+ identity to the opioid and overdose toll, where drugs are not just a public health issue but an economic one costing the U.S. about $740 billion a year.

Statistics · 2026
Clinical Trial Participation Statistics
Why do eligible people still get left out? This Clinical Trial Participation statistics page pairs 55% citing lack of awareness and 41% deterred by fear of side effects with access and trust gaps like 14% of physicians routinely discussing trials, while highlighting how targeted outreach and modern trial models can still move outcomes fast. It also tracks how enrollment and retention shift under pressure such as COVID fears dropping in person enrollment by 38% in 2020 and regulatory paperwork delaying site activation by 4 to 6 months for 45% of trials.
Statistics · 2026
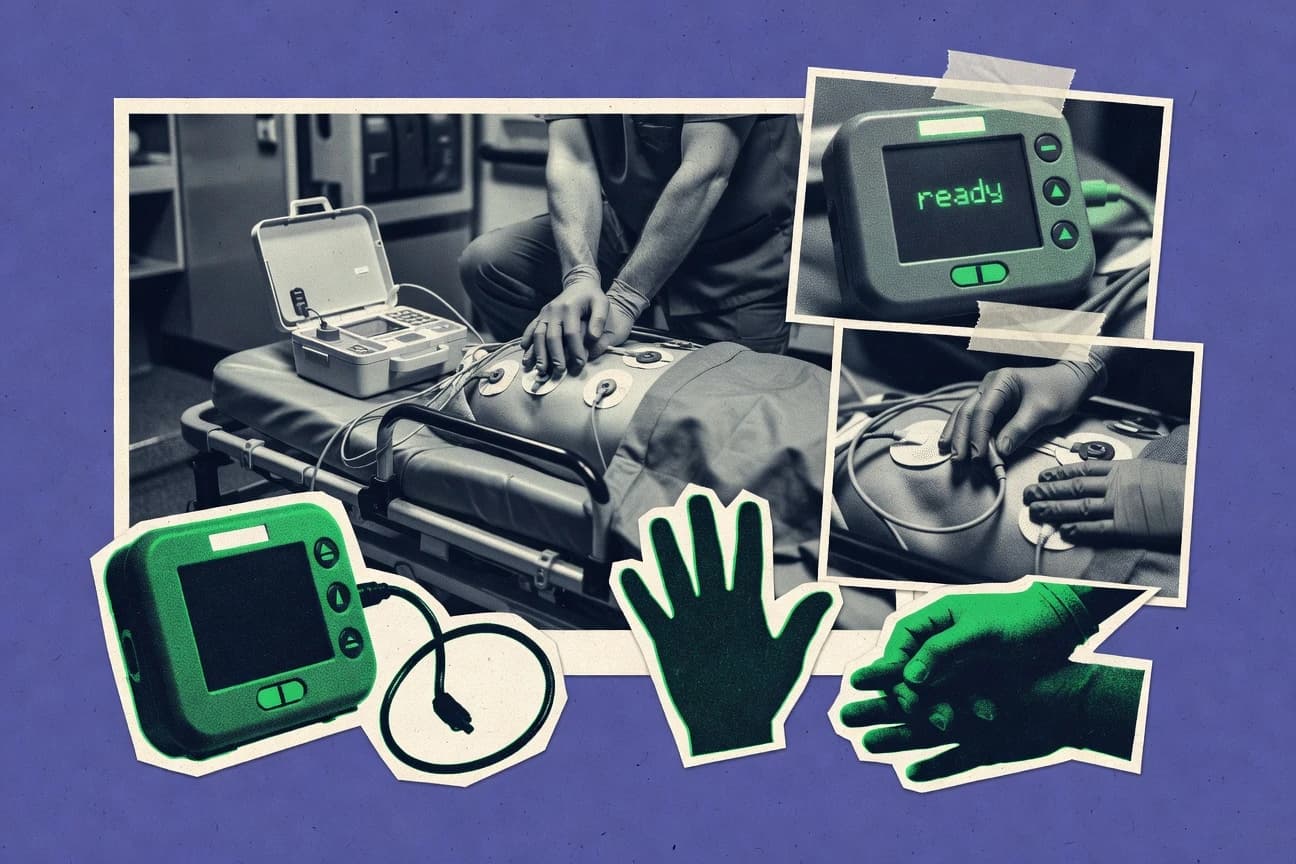
Sudden Cardiac Arrest Statistics
Sudden Cardiac Arrest strikes about 350,000 times each year in the US and nearly 9 out of 10 victims die before reaching the hospital, with stark gaps by sex, age, location, and rhythm. Learn which situations raise or lower survival, from EMS response and bystander CPR to workplace, nursing home, and public settings where outcomes can swing dramatically.

Statistics · 2026
Sleep Deprivation Statistics
Sleep deprivation is linked to 6,000 fatal crashes in the US every year and 800 to 1,000 driver deaths, while short sleep also turns normal days into measurable cognitive and emotional failures, from microsleeps and slower reactions to a 2.9x higher depression risk. This page pulls those results together with human moments and workplace consequences, so you can see exactly how one small loss of sleep can snowball into danger.
Statistics · 2026
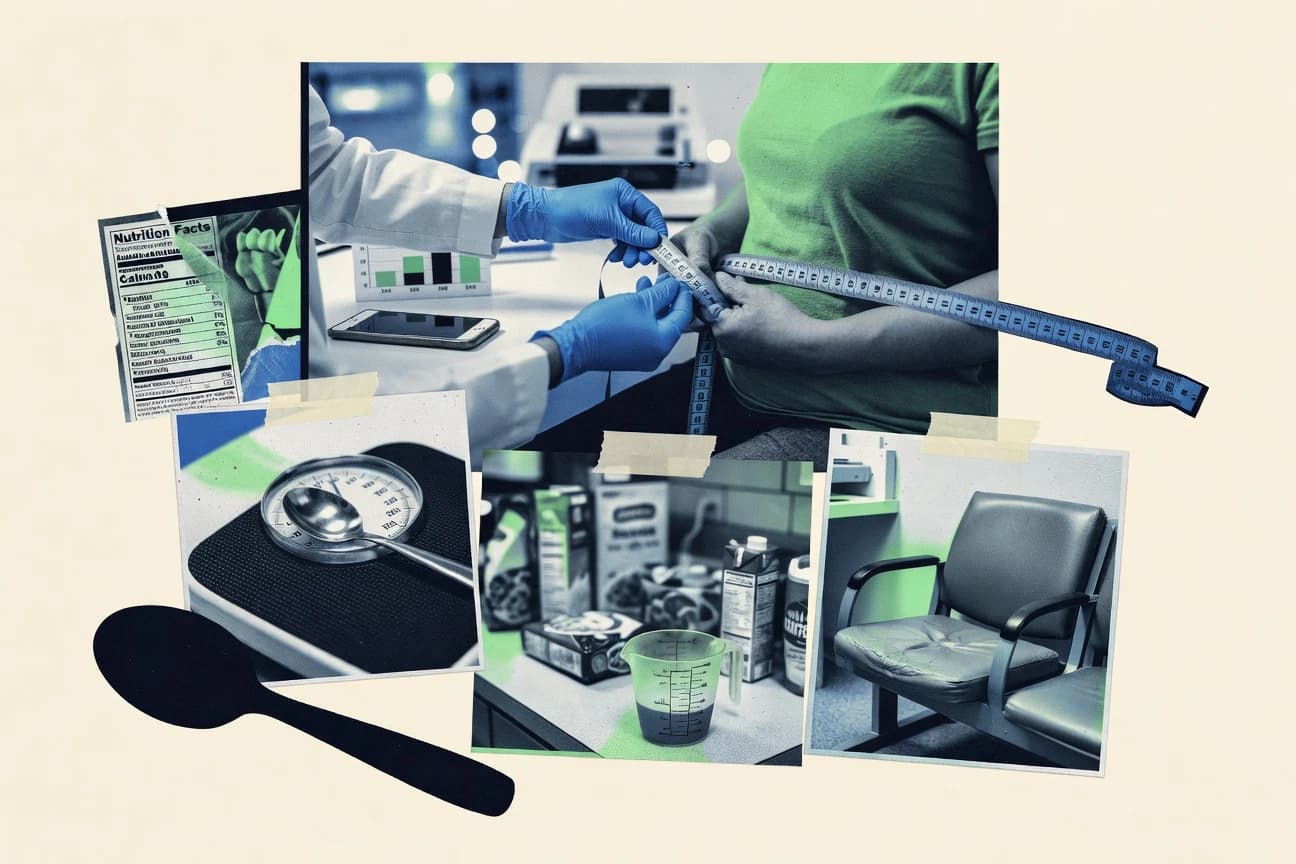
World Obesity Statistics
By 2022, obesity affected more than 1 in 8 children and adolescents and nearly 1 billion adults globally, with adult obesity up from 4% in 1975 to 16% in 2022. You will also see how childhood trends are shifting fast, with 37 million under 5s already overweight or obese and projections warning that the share could climb to 4 in 10 by 2030 if nothing changes.

Statistics · 2026
Epidemiology Statistics
Cardiovascular disease and diabetes still dominate global preventable risk, but the page also tracks how threats shift across time and methods, from COPD and dementia surges to testable interventions like vaccination, screening, and public health policies. You will also find the epidemiology toolkit behind the claims, including odds ratios, relative risks, NNT, PAF, and modern bias control that turns raw outcomes into evidence you can actually trust.

Statistics · 2026
Obesity Epidemic Statistics
In the US, obesity peaks at 50.2% among men aged 40 to 59, while 43.3% of women aged 40 to 59 are also living with obesity, and low income adults reach 40.8% compared with 31.6% for high income. The page connects that gender and income divide to a global bill that goes beyond BMI with obesity driving massive healthcare and productivity losses plus clear country contrasts from England’s 32.9% in deprived areas to Egypt’s 45.2% urban obesity.

Statistics · 2026
Laser Eye Surgery Statistics
Projected laser eye surgery market growth to $9.6 billion by 2024 sits beside hard patient experience signals like 0.5 to 1.0% overall LASIK complication rates, 86% of US ophthalmologists using satisfaction surveys, and a 2021 eligibility yield of 47% after screening. You will also see how choices and outcomes diverge across methods and motionless details like contrast sensitivity and haze risk which help explain why cost, technology adoption, and safety endpoints often pull in different directions.

Statistics · 2026
Addiction Relapse Statistics
Relapse after addiction treatment is not the exception it is the most common outcome, with 81% of people who finished treatment reporting at least one relapse or return to drug use within 1 year. You will also see how unmet care and support gaps keep risk high, including 27% of adults who needed but did not receive SUD treatment in the past year, plus what actually lowers the odds through medication continuity, CBT, and contingency management.