
Market data
Health Medicine
Explore verified health medicine statistics and market research reports with sourced data and trend analysis.
Latest update:
 David Kowalski
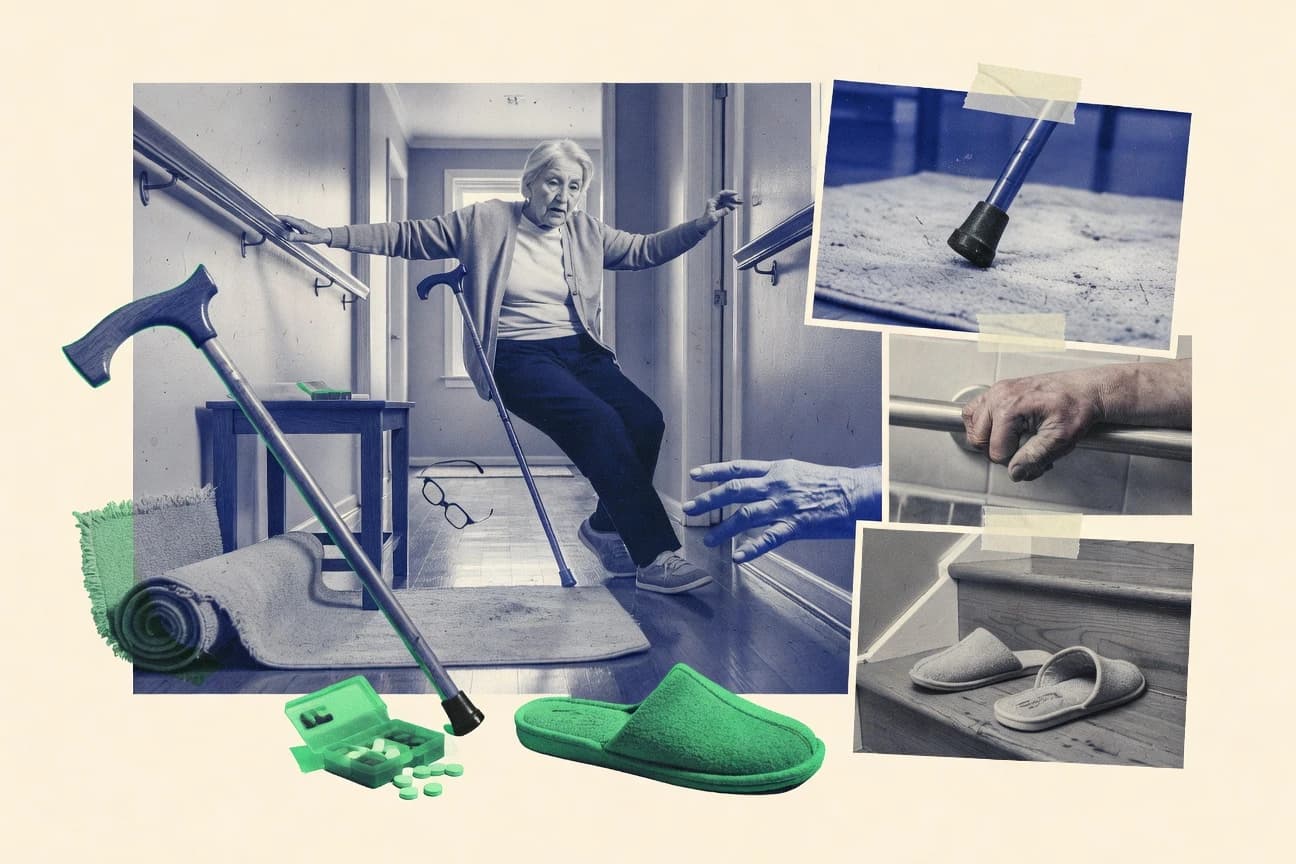
Elderly Falls Statistics
Hip fractures stem from falls 95% of the time, and yet many readers are shocked to learn that half of survivors do not regain walking ability. Elderly Falls pulls together the latest fall and cost patterns, from the 1 in 3 older adults who fall in a typical year to how targeted prevention can cut falls by roughly a third, so you can see where risk concentrates and what actually reduces it.

Ectopic Pregnancy Statistics
Ectopic pregnancy happens in only 1 to 2% of pregnancies worldwide but it can become life threatening when rupture arrives early, with the US incidence at about 19.7 per 1,000 pregnancies and mortality down 99% since the 1970s through earlier detection and treatment. This page compares rates across countries and connects them to outcomes like rupture risk, recurrence, and fertility after salpingostomy, so you can see exactly where the danger and hope differ.

Birth Injury Statistics
Instrumental delivery is used in just 10% of births yet drives 20% of injuries, and one overlooked trigger can raise risk dramatically such as vacuum extraction with a 12-fold jump in subgaleal hemorrhage. This page ties together the most urgent, up to date risk multipliers from prolonged labor to chorioamnionitis so you can see exactly where preventable pressure points may be hiding.

Gallbladder Removal Age Statistics
Gallbladder removal age is more than just a timeline, with ultrasound and CT still driving decisions in late decades while conversion to open surgery jumps to around 15% after 80 and readmission rises to 9% after 75. See how timing, technique and risk shift by age, from near 0.01% elective mortality for ages 20 to 40 to 92% symptom resolution under 40, and what that means for planning your care.
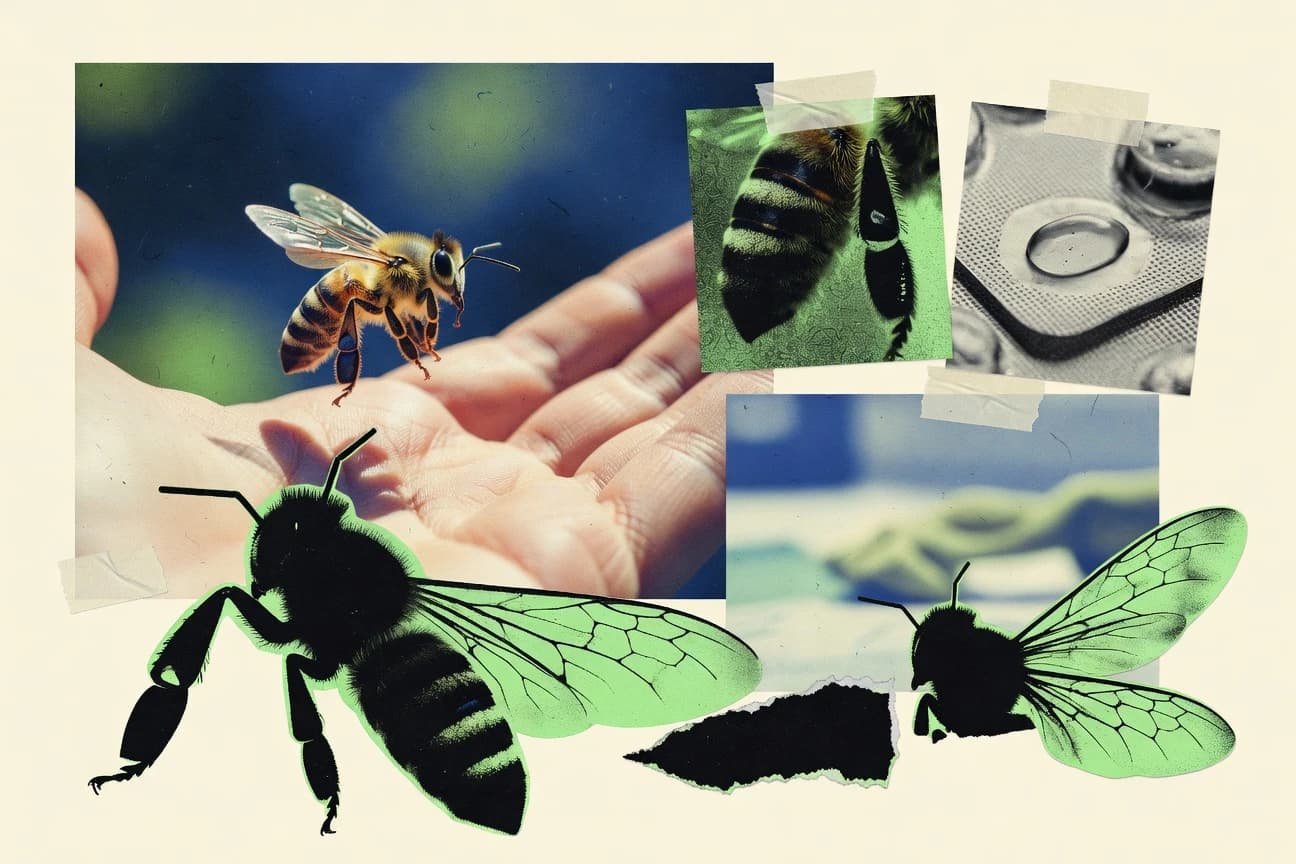
Bee Sting Statistics
Only 3 to 5% of people are IgE sensitized, yet anaphylaxis can still strike 0.3 to 0.5% of stings in those individuals, and after a first systemic reaction the untreated risk jumps to 30 to 50%. Learn how markers like API m 1 and tryptase steer outcomes, why venom immunotherapy cuts future anaphylaxis risk by 80 to 90%, and how often bee stings are mistaken for wasps when cross reactivity reaches 50%.

Stress Kills Statistics
Chronic stress is tied to 15 to 20% of US deaths each year and shaves years off your life, with a meta analysis finding high stress shortens life expectancy by 2.8 years. But the page goes further than heart and cancer risks, mapping how stress, loneliness, shift work, and insomnia can compound into immune failure, infection, and even suicide risk.

Baldness Statistics
DHT can run 3 to 5 times higher on balding scalps, while smoking adds an OR of 1.79 for severe baldness and metabolic red flags such as BMI over 30 and hyperinsulinemia further sharpen the risk. You will also see why a dermatologist’s “hair loss” label can reflect very different biology from autoimmune-driven alopecia areata to chemotherapy anagen fallout, plus what the most effective treatments are targeting right now.

Sleep Deprivation Death Statistics
Sleep deprivation is not a minor lifestyle slip. With chronic cases linked to a 45% higher heart disease mortality and shift workers facing 40% higher cardiovascular deaths, this page connects short sleep and insomnia to real, measurable loss across heart, stroke, diabetes, road crashes, and even workplace fatalities.

Pregnancy Test Statistics
When used correctly after day 1 of a missed period, home tests hit 97 to 99 percent accuracy, yet testing too early and diluted urine can swing results by turning false negatives from a rare glitch into a real risk. This page walks you through the sensitivity thresholds and the jump from urine to lab blood and ultrasound so you know which kind of pregnancy test fits your timing and why that 1 percent precision difference can matter.

Condoms Breaking Statistics
Latex condoms break in head to head trials 1.2% of the time versus polyurethane at 2.1%, and the stakes are clearer when “perfect use” still shows 2% pregnancy failure compared with typical 13% including breakage and mistakes. The page also tallies the sharp swing points that drive real world risk like oil based lube breakage reaching 12.4% and proper sizing cutting breakage to as low as 0.5%, so you can pinpoint what actually changes outcomes.

Pregnancy Loss Statistics
Why do losses happen so often for reasons that are both biological and heartbreakingly specific, from fetal chromosomal issues causing 50 to 70 percent of miscarriages to placenta abruption driving 30 percent of third trimester losses. This page also weighs the emotional aftermath, including 39 percent of stillbirth parents reporting complicated grief and a 3x higher suicide attempt risk in the year after stillbirth, so you can make sense of what may be known, what remains unexplained, and what support and next steps could matter.

Benzodiazepines Statistics
Chronic benzodiazepine use can bring a quiet double hit of impairment and risk, including daytime drowsiness in 15 to 25% of users and an elderly fall risk increase of 1.5 to 2 fold over age 65. It also lays bare hard-to-ignore tradeoffs, from respiratory depression rising to as high as 20% with opioids and overdose mortality of 0.22 per 100,000 prescriptions to a current clinical reality where in 2021, 12.6% of US adults filled benzodiazepine prescriptions.
Vital Health Statistics
Vital Health closed 2023 with a rare mix of momentum and discipline, growing revenue 17.8% to $2.3 billion while lifting net profit margin to 12.4% and pushing training ROI to $4.20 per $1. From clinician burnout at 14% and 89% physician job satisfaction to 99.99% IT uptime and 4.2 million patient visits handled with 97.1% telemedicine follow up adherence, this page connects performance, people, and patient outcomes in one place.

Circumcision Statistics
From brit milah on the 8th day to taunuu in Samoa and VMMC programs across Africa, this page tracks how circumcision practices, rates, and reasons diverge worldwide, while the evidence on benefits and risks is front and center. It is updated with 2025 level HIV prevention projections and includes standout complication and policy contrasts like Sweden’s anesthesia and age rules, Germany’s court shift, and WHO VMMC scale up.

Nicotine Addiction Statistics
Nicotine hijacks the brain fast, delivering dopamine 2 to 10 times more than cocaine per dose while tolerance builds within days and withdrawal can peak at 24 to 48 hours and last up to 4 weeks. See how genetic differences and rapid receptor changes keep dependence locked in for years, and why quitting rarely fails due to willpower alone when proven treatments like varenicline reach 25 to 30% abstinence at 1 year.

Lsd Statistics
LSD turns perception up to 11, with geometric hallucinations, strong color enhancement, and visual tracers in 95 percent of users at 150 micrograms, while brain imaging links the experience to default mode network connectivity lasting up to 12 hours after the dose. At the same time, the page puts the risks and the hype into the same frame, from claustrum quieting and up to a 200 to 300 percent jump in emotional intensity to HPPD affecting 4.2 percent of hallucinogen users and the latest prevalence estimates for classic psychedelic use in 2023.

Hallucinogens Statistics
Hallucinogen use is widespread, yet the risk profile swings sharply by substance, with 2011 DAWN hallucinogen related ED visits climbing to 33,452 and classic effects turning medical in only specific cases like PCP linked to 10% of violent ED injuries. The page tracks that split in one place, from LSD lifetime HPPD prevalence of 4.2% to ketamine bladder cystitis in 20 to 30% of chronic users, so you can see where harm spikes and where it does not.

Missed Miscarriage Statistics
Missed miscarriages account for about 50% of first trimester miscarriages detected by ultrasound in the US, and the causes are more specific than most people expect. From chromosomal abnormalities driving 50 to 70% of cases and implantation and placental problems leaving fingerprints even when symptoms are quiet, to updated risk signals like IVF rates of 3 to 6% and progesterone deficiency in 10 to 20%, this page helps you connect what happened with what to ask next.
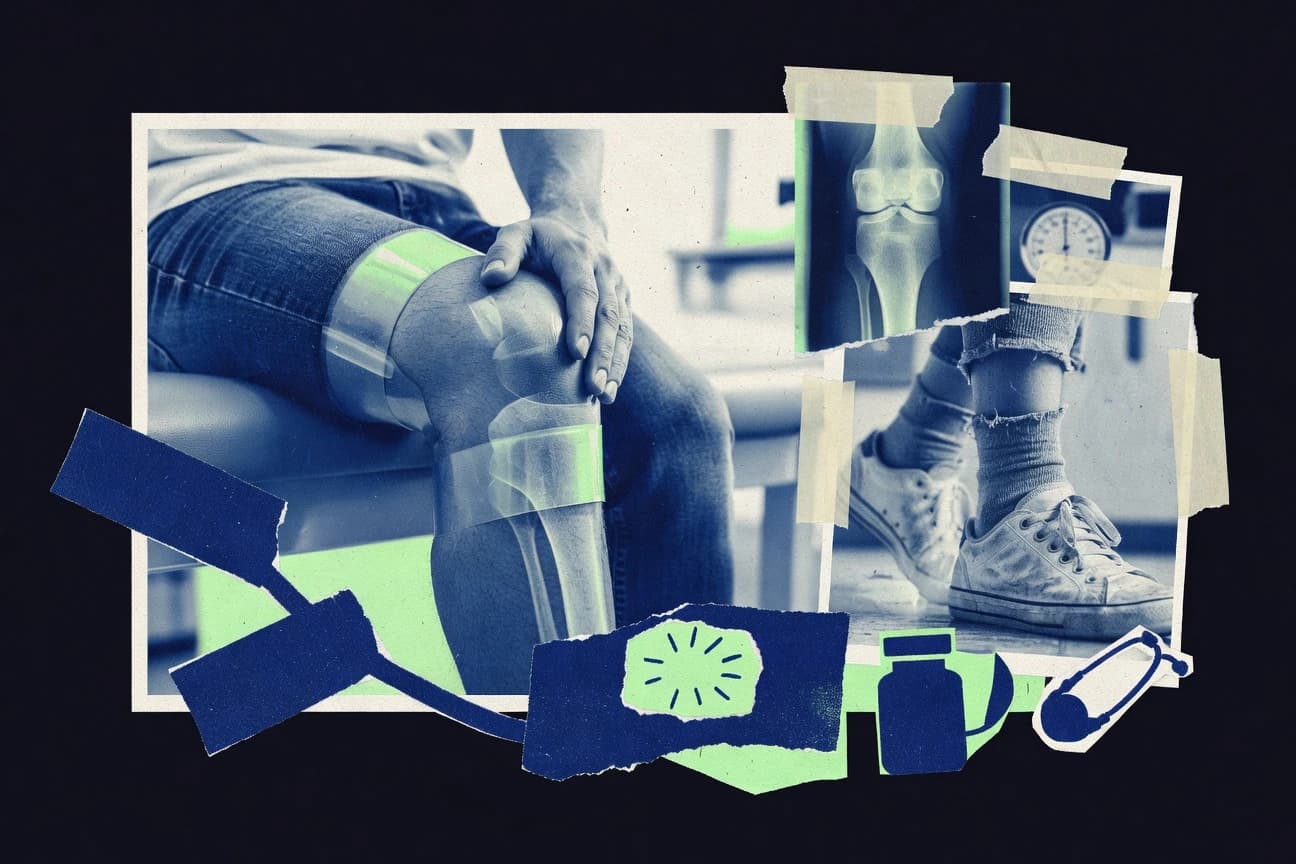
Knee Pain Statistics
Obesity can multiply knee osteoarthritis risk up to 4 to 5 fold under age 50, yet smoking and targeted rehab can swing outcomes in surprising directions, including exercise based care that cuts knee pain by 20 to 30% within 12 weeks. This page also connects the dots from meniscal tears, malalignment, and quadriceps weakness to the lived burden of knee pain worldwide, so you can see which risk factors actually move the needle.

Wisdom Teeth Statistics
From pericoronitis tied to 38% of impacted third molars to the fact that panoramic OPG is still the most common first look, this page cuts through what imaging and impaction angles really predict, including that up to 86% of removed mandibular third molars are impacted. It also maps your risk timeline from about 1% to 10% postoperative infections to typical pain lasting 3 to 5 days, plus how the global oral surgery and imaging markets and newer CBCT and AI tools are reshaping how wisdom-tooth care gets planned in 2023 to 2030.