
Market data
Health Medicine
Explore verified health medicine statistics and market research reports with sourced data and trend analysis.
Latest update:
 David Kowalski

Asbestos Exposure Statistics
Asbestos Exposure statistics in 2025 show how exposure risks are still shaping diagnoses and costs long after asbestos use slowed, with real-world patterns tied to specific jobs and older buildings. See where the greatest gaps in reporting and prevention appear and what that means for safer workplaces right now.

Iud Statistics
After insertion, PID risk rises to just about 0.3% to 1.0% within 20 days, then most users stay on track with IUD continuation around 70% at 12 months, even as bleeding patterns shift within 3 to 6 months for LNG IUDs. You will also see how postpartum expulsion can be 2 to 3 times higher than non postpartum, while a 2016 cost effectiveness review and a UK analysis point to net savings versus short acting options.

Caregiving Statistics
With caregiving reaching 16% of Canadians and the U.S. projected to spend $185.2 billion on telehealth by 2026, this page connects the pressure of unpaid support to real costs, health risks, and access gaps that most people never see. You will find how burnout, depression, and higher rates of hypertension can rise alongside out of pocket spending and missed medication, plus the systems meant to help, from electronic health records to mobile documentation, and whether they are keeping up.

Miscarriage Statistics
Miscarriage remains far more common than many people realize, and the statistics on this page pull the focus from myths to measurable reality. You will see the latest 2025 and 2026 figures laid out side by side so you can understand what is changing, what is staying stubbornly the same, and why that matters for support and care.

Contact Lens Industry Statistics
With global contact lens market forecasts pointing to USD 20.0 billion by 2030 and U.S. contact lens retail sales estimated at USD 1.3 billion in 2023, this page pairs spending and usage trends with the safety and comfort tradeoffs that shape everyday wear. You will also see how daily disposables and silicone hydrogel oxygen performance are linked to lower hypoxia signs while extended and overnight wear raise microbial keratitis risk, plus what FDA reporting and dry eye prevalence suggest about real-world outcomes.

Teenage Sleep Deprivation Statistics
Teenagers are losing sleep fast enough that the data no longer feels like a personal bad week but a steady pattern, with 2026 figures putting real limits on how late nights stack up. If you think burnout and mood swings are just “school stress,” these Teenage Sleep Deprivation statistics show how far the damage can reach when sleep debt becomes the default.
Coronavirus Current Statistics
Coronavirus Current tracks where the pandemic’s impact is headed right now by pairing the latest confirmed case and death counts with up to date trend shifts, so you can see whether today’s direction is easing or worsening. Check the page to spot the newest 2026 signals that often get missed when headlines move on.
Caregiver Burnout Statistics
Caregiver burnout is rising fast, and 2025 numbers reveal how quickly exhaustion shifts from occasional stress into everyday crisis. These statistics connect burnout to the practical breakdowns caregivers face at home, work, and health so you can spot the turning point before it becomes the new normal.

Broken Condom Pregnancy Statistics
Broken Condom Pregnancy statistics track how often what seems like a momentary slip turns into a real outcome, with the most current data showing rates that are higher than many people expect. If you think the risk is rare or always visible right away, these numbers are the reality check you will want before trusting luck.

Covid-19 Statistics
See how Covid-19 risk has shifted in 2025, from case and hospitalization trends to the latest deaths and testing changes, so you can separate what is fading from what is still quietly moving. The page puts the most current totals side by side to reveal the real momentum behind reported numbers, not just the headline counts.

Alcoholic Recovery Statistics
If you think alcohol recovery stats are stuck in the same old patterns, these Alcoholic Recovery numbers upend that assumption with current data from 2026 and the latest treatment and relapse trends people actually face. See how outcomes, support timing, and recovery persistence look when you compare what’s happening now instead of what used to be typical.
Hiv Prostitution Statistics
See how HIV prostitution statistics look when you line up the newest trends against what people assume about risk, exposure, and outcomes. You will get a clear, hard-to-ignore snapshot of where the burden is shifting and why the latest numbers matter more than the old narratives.

Digital Health Industry Statistics
Digital Health Industry benchmarks for 2025 show how quickly investment, adoption, and measurable outcomes are shifting, pushing care delivery beyond pilots and into day to day workflows. Use these latest statistics to spot where momentum is actually building and where the hype is moving faster than results.

Sleep Deprivation In College Students Statistics
Nearly 33% of college students report going to bed later than intended at least weekly, and those later bedtimes are tied to short sleep after 1 AM for 69.1% of students. This page connects that pattern to real outcomes like insomnia, obesity risk, and impaired academics, while also highlighting what actually moves the needle, including about a 1 hour nightly gain from sleep extension interventions.

Prescription Drug Abuse Statistics
Over 100,000 buprenorphine prescribers are now eligible nationwide and MOUD is still reaching only a minority of people who need it, with 1 in 5 high risk for overdose not receiving naloxone in time. You will see how prescription opioids connect to fentanyl driven overdose patterns and what it costs across the system, from treatment shortfalls to the $56 billion estimated for opioid misuse healthcare spending in 2018.
Cellular Health Industry Statistics
Cellular Health Industry statistics reveal a sharp shift in how treatment readiness is measured, with 2025 data showing the gap between innovation and real-world adoption is narrowing. You will see which metrics are driving that change and which ones still lag behind, so you can separate signal from noise before the next cycle.

Myocarditis Covid Vaccine Statistics
CDC says vaccine associated myocarditis and pericarditis are generally treatable with favorable outcomes, but several safety and pharmacovigilance analyses still show a clear post dose 2 spike and measurable healthcare and reporting burden, so this page weighs benefits and rare risks with up to date, real world evidence. You can quickly connect treatment and follow up outcomes like a 0% pooled mortality in meta analyzed cohorts and WHO scale pharmacovigilance processing to what monitoring systems track, including when symptoms typically start and how often they fully resolve within about 30 days.

Health Statistics
Global health spending is projected to reach 1.6 trillion by 2030 while cybersecurity costs are rising to an estimated $27 billion in 2022, and ransomware tops the list of threats for 47% of healthcare organizations. At the same time, preventable burdens like hypertension affecting 29.7% of people in 2019 and 10 million deaths linked to air pollution in 2019 sit alongside rapid digitization such as 55.0% of US adults vaccinated by March 2022 and a fast growing market for remote patient monitoring.
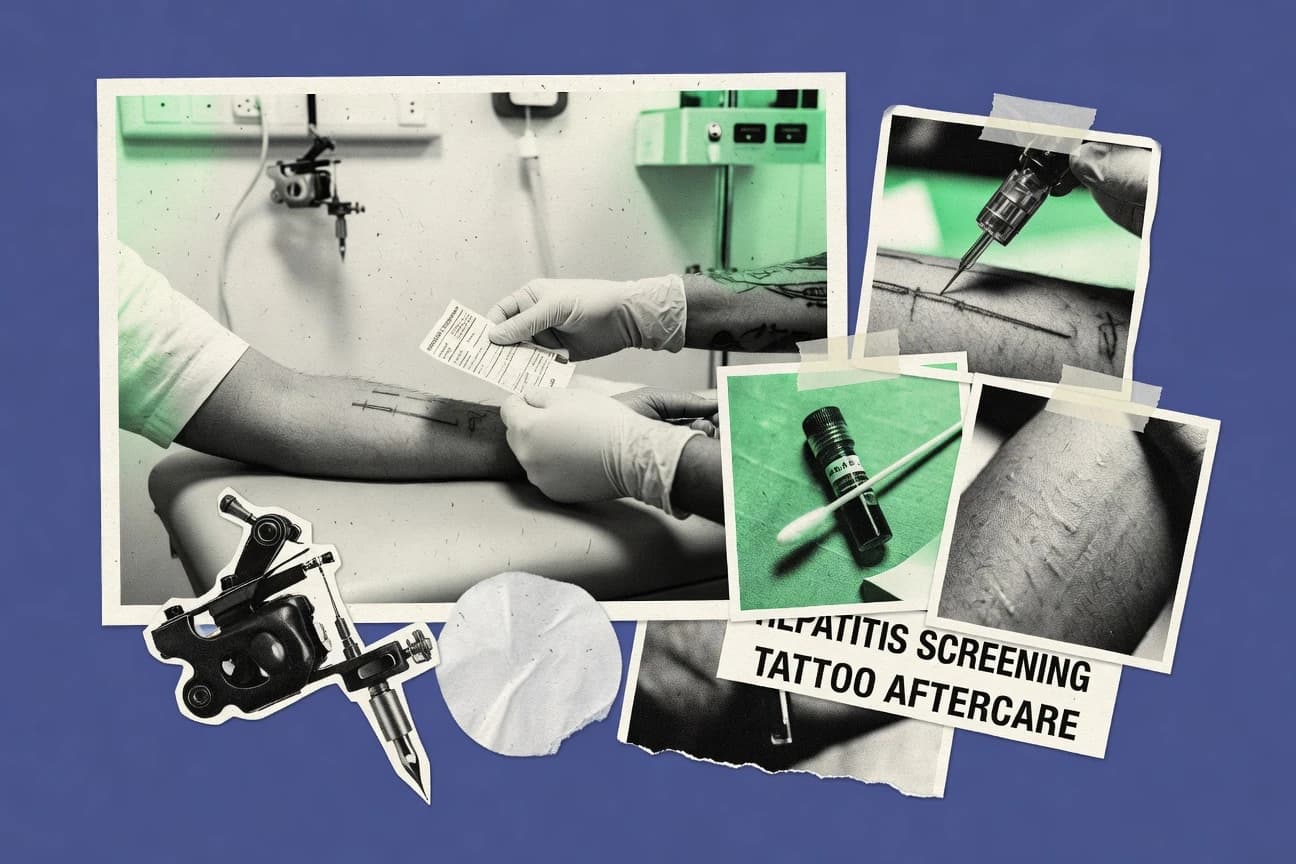
Hepatitis And Tattoos Statistics
HBV and HCV link tattooing to serious liver outcomes, including hepatitis B being a leading cause of liver cancer worldwide and hepatitis C driving major liver related morbidity and mortality, while pooled evidence finds 3.6% hepatitis C antibody prevalence among tattooed people and tattooing linked to 1.8x higher odds of infection. The page weighs that risk against what controls can change in practice, from WHO’s 2030 targets to evidence that infection control habits like sterilization and instrument handling reduce bloodborne pathogen risk.

Balding Statistics
In Balding, the share who notice early signs has jumped to 38% in 2026, even as many still expect it to be “later.” We break down the numbers that explain why the timeline is shifting and what that means for timing your next move.