Market data
Finance Financial Services
Explore verified finance financial services statistics and market research reports with sourced data and trend analysis.
Latest update:
 Nicholas Chambers

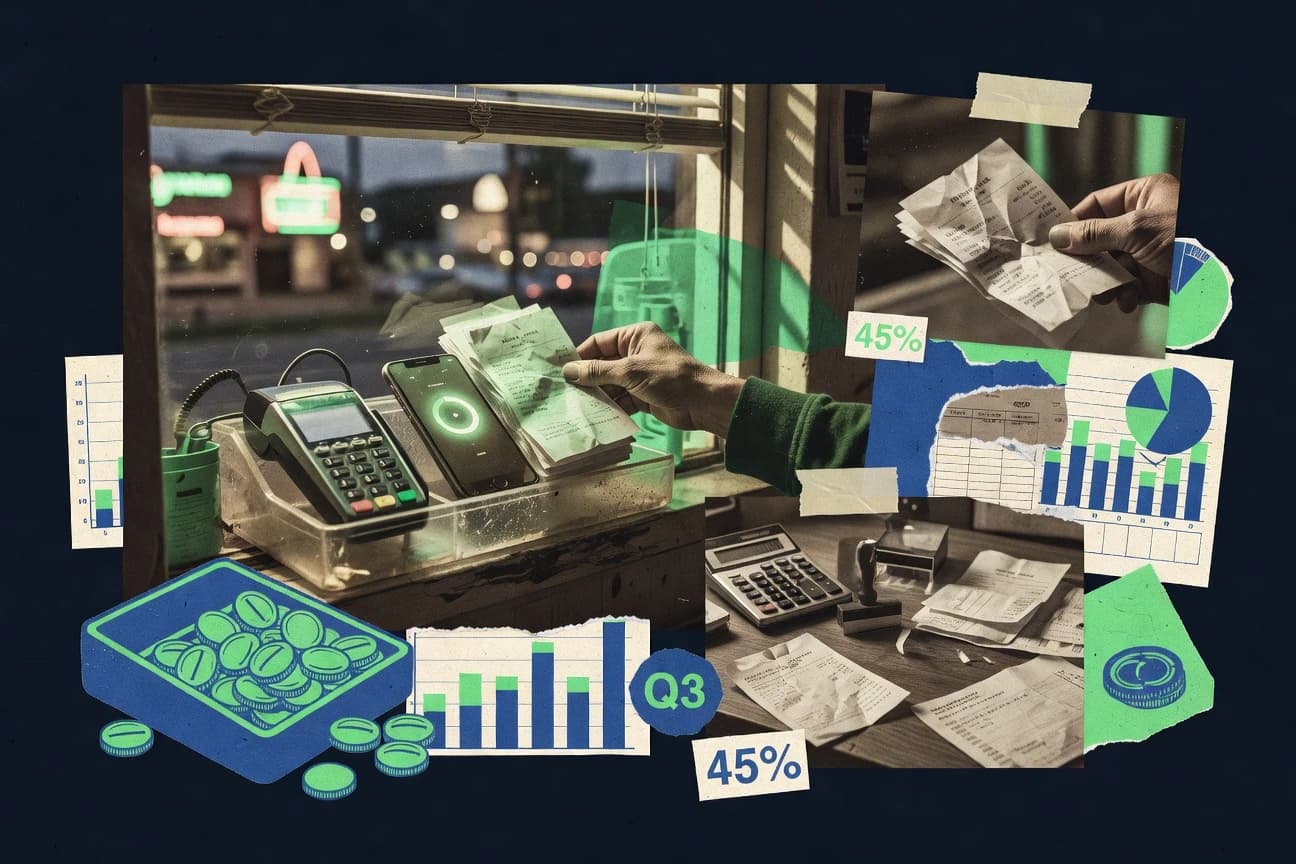
Card Statistics
See why card rails move $4.1 trillion of global payment value in 2023 while mobile wallet card transactions are forecast to top 7 billion in 2024, yet merchants still report 1.0% of consumer card accounts seeing chargeback attempts. From EU Strong Customer Authentication pressure and an 88.2% e commerce authorization success benchmark to a 97% tokenization adoption rate and a 1.8% risk flag prevalence, Card statistics reveal exactly where approvals, fraud, and compliance collide.

Ultra High Net Worth Individuals Statistics
With 33,000 Ultra High Net Worth Individuals in Asia Pacific and a regional UHNW wealth pool of about $22.8 trillion, this page connects cohort size to what they actually need from wealth platforms, from 54% seeking tax planning and 45% prioritizing estate planning to 49% demanding faster onboarding and 46% preferring a dedicated client portal. It also contrasts private investment appetite and compliance pressure, showing $10.0 trillion globally parked in alternatives, rising ESG momentum, and still incomplete beneficial ownership coverage that keeps regulators, and advisors, on high alert.

Bankruptcy Filing Statistics
Bankruptcy Filing statistics in 2026 reveal how filings are shifting in real time, with the latest totals showing a sharper split than many people expect. If you want to understand what is changing now, not just what happened before, this page is built to help you read the trend with clarity.

Online Banking Usage Statistics
See how online banking habits have shifted, including a clear 2026 snapshot of active users and transaction patterns that don’t match the expectations many people still carry. Get the practical take on where usage is accelerating and what that means for how banks should design support, security, and services right now.

Seattle Financial Services Industry Statistics
See what changed in Seattle’s financial services in 2025 as key indicators shift between consumers, businesses, and regulators, revealing where demand is tightening and where opportunity is emerging. If you make decisions off performance metrics, this page gives the sharpest snapshot of local momentum so you know what to trust and what to question.

Ria Wealth Management Industry Statistics
See how quickly industry momentum is shifting, with 2026 data that highlights the gap between what investors expect and how portfolios are actually being positioned. Ria Wealth Management Industry statistics put those changes into sharp relief so you can spot the signal before it becomes the new normal.

Global Payments Industry Statistics
Payment risk is getting more expensive even as adoption accelerates, with 40% of global consumers using at least one mobile wallet method and leading operators targeting 99.99% uptime, while payments leaders also report 26% revenue loss from failed payments. You get the full squeeze across markets and fraud trends, from 25% of e-commerce fraud tied to account takeovers and a 10.2% CAGR forecast for fraud detection systems to how merchants are planning unified payment stacks and absorbing dispute and chargeback pressure.

Retirement Planning Statistics
Retirement Planning turns hard numbers into clear decisions, showing how 2026 shifts in savings, income sources, and withdrawal planning can reshape what “enough” looks like. You will see the gap between assumptions and reality so you can adjust your strategy before the math catches up.
Merchant Cash Advance Industry Statistics
See how Merchant Cash Advance funding moved from a steady advance model toward faster, more data driven decisions, with 2026 metrics revealing what lenders are prioritizing as risk and approval speed tighten. If you want to understand where underwriting is heading and what that shift means for merchants trying to finance growth, these industry statistics are the fastest way to get oriented.

Singapore Financial Services Industry Statistics
With S$52.4 billion in financial services revenue, S$31.8 trillion in assets under custody, and a 99.99% payments availability target, Singapore’s finance engine is scaling while staying tightly governed. From QR payments uptake and instant payments savings to banks’ RegTech and cloud push, the page explains how cost, compliance, and customer adoption are shifting alongside fintech momentum such as S$10.3 billion in venture funding raised by fintechs in 2022.

Mobile Banking Statistics
Mobile Banking keeps pulling ahead, with 2025 showing mobile as the preferred channel for 57% of consumers while overall banking visits drop by 14%. The page breaks down what’s driving that shift and where the biggest opportunities and friction still sit.

Ocio Industry Statistics
See how Ocio Industry’s latest figures for 2026 are reshaping the industry picture, with the most current shifts in demand, revenue, and audience patterns moving faster than the narrative from just a year ago. If you want to understand what is actually changing right now, not what investors expected, this statistics page gives you the sharp contrasts you can’t get from headlines.

Japan Asset Management Industry Statistics
Japan Asset Management Industry data is showing where the momentum has shifted in 2026, with fresh figures that separate fast-growing segments from the parts still struggling to gain traction. If you want to understand what is changing for managers and investors right now, these key statistics make the contrast impossible to miss.

Retirement Plan Industry Statistics
See what’s driving retirement plan outcomes right now as 2026 projections point to shifting participation patterns and benefits pressure across the industry. If you’ve been using yesterday’s benchmarks, these fresh figures show exactly how the risk and retirement readiness gap has changed since the most recent year you last relied on.

New York Investment Management Industry Statistics
New York is running the numbers as a true heavyweight, from 10.6% of U.S. adviser AUM to owning 36% of hedge fund assets and reaching $6.6 trillion in private fund market size in the dataset. At the same time, regulators are tightening the screws with about 18% of cybersecurity related enforcement actions against financial services and $2.2 billion in U.S. regulatory fines in 2024 while pay for investment decision roles stays among the highest, including a $190,000 median base salary for New York portfolio managers.

Auto Finance Industry Statistics
See how auto finance is shifting right now, with 2025 figures that spotlight changing borrower behavior, tightening approval trends, and loan performance pressure in real time. One glance at the latest metrics will show why lenders are rethinking risk faster than the market expects.

F&I Industry Statistics
The latest numbers in F&I Industry reveal how fast customer expectations and lender pressure are reshaping the deal room, with a 2025 snapshot that makes the shifts hard to ignore. See which performance metrics moved in the real 2025 data and where margin opportunities are tightening, so you can separate what changed from what is just noise.

Open Banking Statistics
Open Banking isn’t just growing, the latest figures show adoption and account data sharing are moving fast into 2025, with real consequences for how customers switch, manage, and monetize financial services. Read the page to see where the momentum is strongest and where the friction still shows up.

Inheritance Statistics

Payment Fraud Statistics
Payment fraud is still finding new ways in 2025, with attackers shifting tactics faster than most teams update their controls. See which payment types and failure points are driving the sharpest spikes and what the latest patterns suggest about where losses are most likely to hit next.