Market data
Entertainment & Events
Explore entertainment & events statistics and market research reports with sourced data and trend analysis.
Latest update:
 James Okoro


Statistics · 2026
Malayalam Film Industry
Kerala film numbers stay punchy in 2024 even as new hits recast the audience split, from 75 percent weekend occupancy to 40 percent OTT share and Premalu’s 50 day pull. Use this page to compare everything from Manjummel Boys peak cultural momentum to awards and box office ROI, so you can see exactly why survival thrillers and rom coms are winning ticket counters and screens across Kerala and overseas.

Statistics · 2026
Game Development Industry
83% of game developers fear industry contraction in 2024. Explore the survey signals, layoffs, and funding strain shaping what comes next.

Statistics · 2026
Bollywood Industry
Real GDP growth cools to 1.4% for FY 2024 after 7.6% in FY 2023, yet cinema and streaming keep widening their reach with broadband investment of INR 1,34,000 crore under NTP 2018 and 56% of internet users watching OTT at least weekly in 2023. Bollywood Industry statistics are laid out in one page so you can connect the macro slowdown to the box office shocks and OTT momentum behind Hindi demand.

Statistics · 2026
Bc Film Industry
British Columbia’s film industry delivered $3.37B to provincial GDP in 2023—see how $4.1B in production volume drives jobs and spending.

Statistics · 2026
Tollywood Film Industry
Tollywood’s business reality sits between blockbuster thresholds and streaming math with 2.0x theatrical box office recovery in 2022 versus 2021 alongside a 35 percent jump in completion rates for films under two hours. Get the funding, audience, and economics picture too from ₹2.4 billion FDI since 2000 to ₹12,000 crore planned entertainment investment and how mobile time, OTT supply, and ticket affordability ultimately shape which Telugu releases win.

Statistics · 2026
Fan Industry

Statistics · 2026
Fireworks Industry
The latest Fireworks Industry numbers reveal a swing in demand and supply that is reshaping how manufacturers, distributors, and retailers plan for peak season. With 2026 figures in view, you can see whether capacity and pricing are tightening or loosening, and what that means for next year’s product mix.

Statistics · 2026
Film Production Industry
From 12,900+ film production businesses in Los Angeles County to $29.7 billion in 2023 box office revenue and $487.1 billion forecasted global video production services by 2030, this page connects where production happens to how money moves. It also tracks the infrastructure shift behind modern filmmaking, including 47% cloud adoption in 2022 and rising data and AI investment expectations, so you can see what is changing before it shows up on screen.

Statistics · 2026
Film And Television Industry
Streaming and box office are pulling in opposite directions, from Netflix’s 2023 Wednesday at 1.7 billion hours viewed and global streaming revenue of $50 billion to US TV hitting 3.2 trillion minutes in Q1 2024 and global box office reaching $33.9 billion in 2023. The page also tracks who is getting the screen and the job, including 44% women leads in 2023 top films and 18% of directors, alongside strike driven production dips and workforce impact.

Statistics · 2026
Film And Streaming Industry
With streaming still driving 67% of all global consumer internet traffic, this page connects that reach to the cost pressure behind it, from $154.0 billion in 2023 streaming operating expenses tied to amortization and production to $117.2 billion in global OTT spend. It also tracks the ad and distribution shift, including $39.0 billion AVOD and $18.2 billion FAST alongside Netflix password sharing crackdowns and the industry’s budget cuts, so you can see where profitability is reshaping what gets made, marketed, and streamed.

Statistics · 2026
Film And Animation Industry
From AI-assisted storyboards and 90% CGI dominance in Hollywood blockbusters to the streaming surge that put global film audiences at 1.3 billion monthly active users in 2023, this page connects how production tools and viewing habits are reshaping film and animation jobs and markets. You will also see why the global hit run helped box office jump to $33.9 billion in 2023 and how animation still commands a 60% TV series share even as new tech and workflows accelerate.

Statistics · 2026
Festival Industry
Nearly 37% of U.S. adults went to a festival or fair in 2023, but that turnout lands in a market that spans $21.8 billion in U.S. spending and a $1.2 trillion global live events economy, alongside pressure points like staffing costs and rising fraud. The page puts attendee experience and event safety under a microscope, from emergency readiness to 3.0% reporting fraudulent ticketing experiences, so you can see where growth is getting it right and where it is getting it risky.
Statistics · 2026
Family Entertainment Center Industry
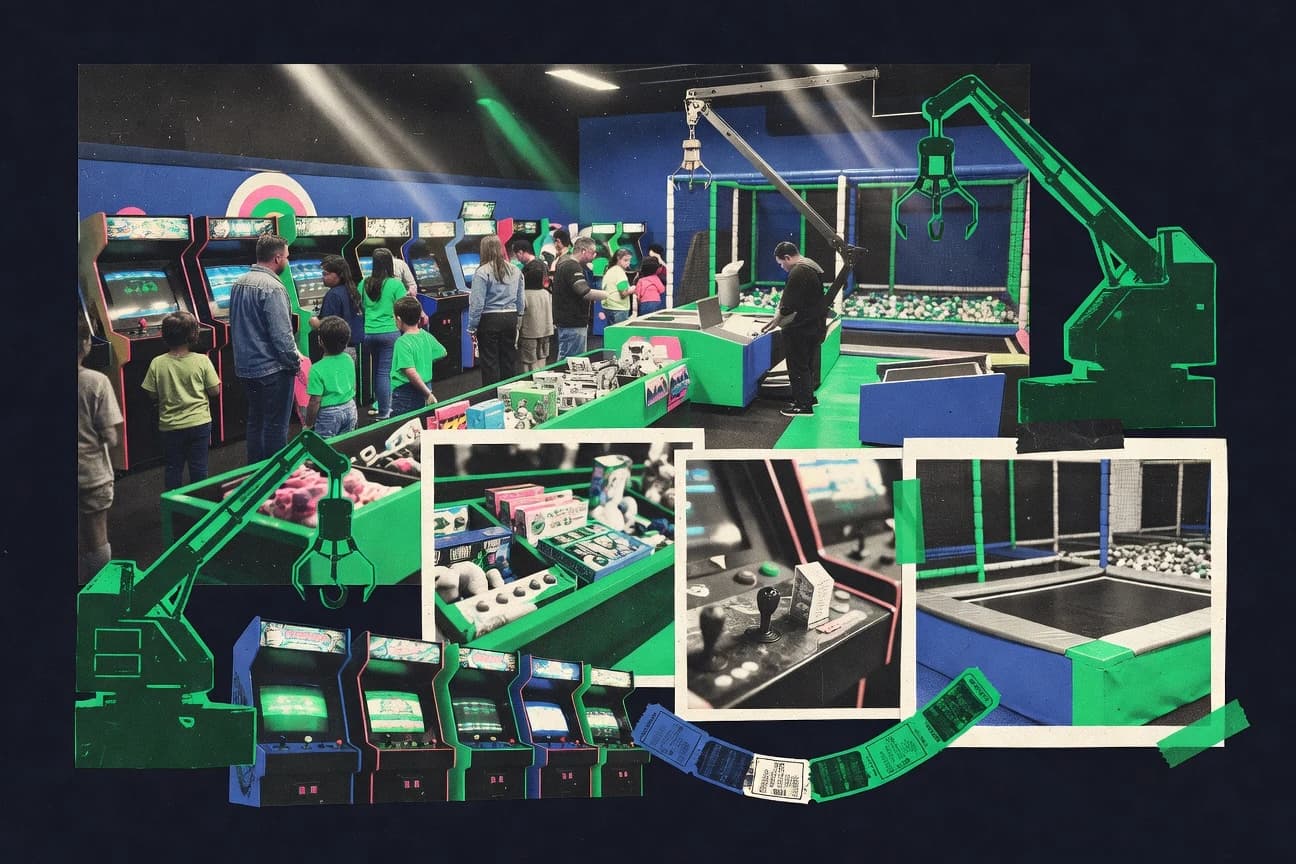
25%+ of US households buy home video games, fueling out-of-home arcade demand; see the Family Entertainment Center industry stats behind the rush.

Statistics · 2026
Events Industry
With blockchain ticketing cutting fraud by 90%, AI personalization can also lift attendance by 20%—see the trends redefining events in 2024.

Statistics · 2026
Event Ticketing Industry
Even in 2023, ticketing is shifting fast from where people buy to what they pay, with 62% of Gen Z favoring mobile apps and U.S. concert ticket prices up 12% to $94, while service fees still take 27% of the total. From Eventbrite processing 282 million tickets and Live Nation ticketing revenue hitting $3.1 billion to blockchain cutting fraud by 90% and AI dynamic pricing now used by 45% of major venues, these stats explain why the modern ticket market feels pricier and more tech driven all at once.

Statistics · 2026
Event Venues Industry
See how event venues are reshaping capacity, pricing, and booking timelines in 2026, with shifts that suggest demand is tightening in some segments even as new growth pockets appear. It is a practical read for anyone planning schedules or budgets who needs more than headlines and wants the signals behind what is changing now.

Statistics · 2026
Event Rental Industry

Statistics · 2026
Event Production Industry
See how event production staffing and costs are shifting, with 2026 figures showing what it really takes to keep venues, crews, and timelines aligned. The contrast between rising complexity and changing spend makes the tradeoffs clear and worth benchmarking before your next build.

Statistics · 2026
Escape Room Industry
From online-first booking habits to a 92% customer satisfaction score after the clock stops, this page translates the latest escape room industry metrics into what operators can actually expect, with Saturday driving 35% of weekly sessions and an average session lasting 60 minutes. You also get the sharp contrasts that matter, like walk ins staying at just 12% and only 3% no shows thanks to prepayment, alongside the market scale and growth trajectory shaping 12,000+ venues worldwide and the move toward virtual plays with 1.2 million in 2023.

Statistics · 2026
Entertainment Providers Industry
Streaming video services generated $129.9B in 2023—45% of all video entertainment revenue. Discover what’s driving demand and reshaping content.