Market data
Entertainment & Events
Explore entertainment & events statistics and market research reports with sourced data and trend analysis.
Latest update:
 James Okoro


Statistics · 2026
Theme Park Attendance Statistics
See how Theme Park Attendance surged to new highs in 2026 even as pricing and crowding pressures climbed, flipping the usual wait time logic on its head. This page breaks down the latest attendance swings by season and park so you can spot what’s driving the momentum right now.
Statistics · 2026
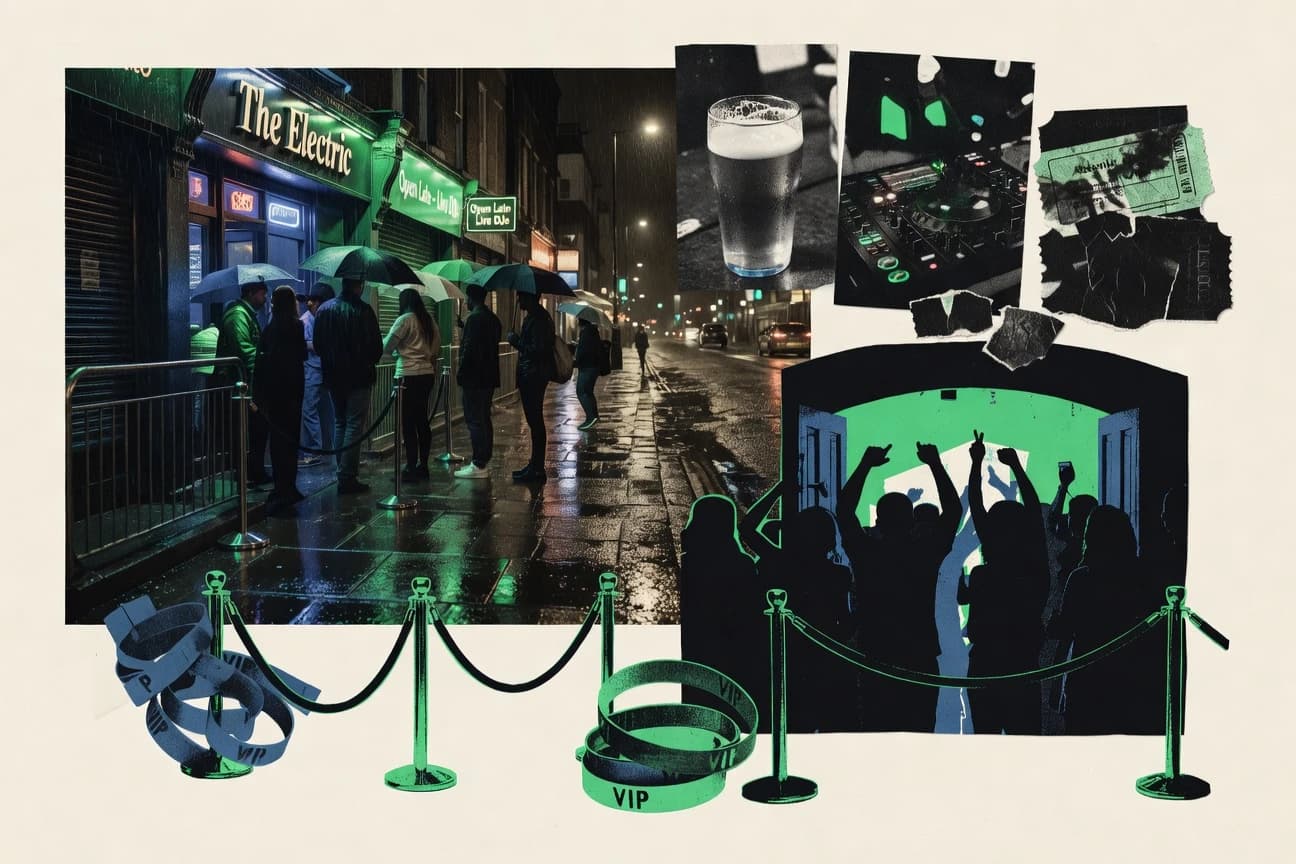
Uk Nightlife Industry Statistics
UK nightlife isn’t just bouncing back, it is shifting in measurable ways as 2025 trends reveal how spending, venues, and visitor patterns are moving at odds with what people expect from a typical night out. Read the figures behind the UK scene to spot the contrasts shaping what stays busy and what quietly slips.

Statistics · 2026
Russia Music Industry Statistics
Russia’s music business is rebalancing fast, with 2025 revenue rising to 211.6 billion rubles while the number of active listeners climbs to 78.1 million, outpacing growth in paid subscriptions. Get the side by side view of what this means for streaming, catalog monetization, and where the next competitive gap is likely to open.

Statistics · 2026
Exhibitions Industry Statistics
With 2026 and 2025 figures reshaping the exhibitors game, this page puts hard performance metrics side by side to show what is really changing in the exhibition floor, from demand signals to revenue momentum. It is the kind of quick, number based reality check that helps you spot where planning assumptions are out of sync before your next event calendar locks in.

Statistics · 2026
Corporate Event Industry Statistics
How corporate events are reshaping budgets and formats in 2025 and 2026 is laid out in the numbers, from shifting attendee expectations to what sponsors now prioritize. If you still plan around last decade’s playbook, these fresh statistics will show exactly where the industry is changing faster than assumptions.

Statistics · 2026
Pyrotechnics Industry Statistics
See how pyrotechnics industry performance shifted by 2026 with numbers that challenge the usual assumption that demand always runs ahead of regulation and labor. If you need to forecast contracts, production capacity, or compliance risk, these latest statistics are the quickest way to separate what looks like momentum from what actually holds.

Statistics · 2026
Uk Live Events Industry Statistics
UK live events are showing sharper recovery signals in 2025, with demand and spending moving in noticeably different directions across venues, ticketing, and production. Read this page to see where the biggest 2025 shifts are happening and what they mean for operators planning for 2026.

Statistics · 2026
Expo Industry Statistics
Expo Industry’s latest figures show how event planning is shifting fast, with 2026 numbers placing real pressure on capacity, staffing, and exhibitor ROI expectations. Read this to see which metrics are rising and which are cooling, and what that means for your next show strategy.

Statistics · 2026
Poland Events Industry Statistics
Poland stacked up 19,000+ music events and over 3,000 Warsaw concerts in 2023, while major metro listings show demand tightening into fewer cities, not spreading evenly. Pair that with 22.7% investment intensity, 14.4% inflation in 2022 turning into 11.5% cost pressure in 2023, and a rising digital and online marketing base, and you get a clear picture of what shapes ticketing, hotel performance, and sustainability priorities for Poland’s events industry.

Statistics · 2026
Crunchyroll Statistics
Crunchyroll now has 15 million paid subscribers and a global audience that spends about 45 minutes per day in the app, with subscription revenue still driving over 80% of earnings even as ad income from the free tier adds 8% to 12%. See how pricing and scale collide, from $7.99 Fan to $14.99 Ultimate Fan and the brand’s 200+ country reach, alongside behind the scenes cost pressures like 2023 license acquisition as the biggest expense.

Statistics · 2026
Movie Audience Statistics
US theaters sold 1.26 billion tickets in 2023, and the average American still went 5.3 times, but streaming is now pulling 42 percent of US movie audiences to primarily watch at home. This page lays out what changed and who is driving it, from IMAX’s 150 million global attendees and premium large format buying to mobile influenced choices and the biggest shifts by age, genre, and region.

Statistics · 2026
Acting Career Statistics
Peak earning years for actors land between 35 and 50, when 70% of total income typically arrives, yet nearly 82% still face career dry spells lasting over two years. You will also see why 50% of actors pivot or retire by 40 from burnout, how a Golden Globe can spike film offers 150% in a year, and what odds shape everything from first break timing to booking drops after age 60.

Statistics · 2026
Movie Goers Statistics
Even with post pandemic habits sticking, the average U.S. moviegoer still clocks 5.1 trips a year, while frequent fans push attendance to 12 plus times yearly at 12% and weekly viewership climbs 15% among young adults. It also reveals the practical swing makers, from evening shows taking 70% of daily traffic to how loyalty members attend 3 times more often, plus what keeps Gen Z and solo viewers coming back.

Statistics · 2026
Comic Books Sales Statistics
Graphic novels drove 76 percent of bookstore comic sales in 2023 while print still holds an 85 percent share, yet direct market revenue hinges on single issues, with digital formats only 15 percent of total sales and Webtoons pulling in $1 billion in 2022. Track how the U.S. comic market reached $2.1 billion in total direct market sales in 2023 and how shares tightened across Marvel and DC as titles like Ultimate Spider Man #1 surged and the sector stabilized after the pandemic spike.

Statistics · 2026
Paint And Sip Industry Statistics
With 1,000+ paint and sip locations across the United States and a $2 billion global “social painting” industry expected by 2025, the category keeps pulling in new customers. This page also traces the shift from traditional franchise growth and DIY competition to wellness minded themes, mobile operators, and high-impact studio habits like stress relief and repeat attendance.

Statistics · 2026
Kpop Industry Statistics
From 2023 hype to current scale, this page maps how K pop turned record setting fandom and award dominance into measurable power, from BTS and BLACKPINK to SEVENTEEN’s 6 MAMA wins and Stray Kids stacking first million seller streaks 4 times in a row. Then it jumps from chart milestones like ATEEZ hitting Billboard World Digital Song Sales number 1 ten times to an industry impact of roughly 9.63 trillion KRW in 2022 and $9.3 billion in global market size for 2023, showing why the next breakout is as much about infrastructure as it is about the music.

Statistics · 2026
Dvd Sales Statistics
US DVD unit sales plunged 90% from the 2006 peak to 2022, and physical media revenue shrank from $25B to $2B as streaming took over US households after 2010. You will see how store and service shifts such as Netflix ending DVD mailing and Redbox rentals down 70% rewired video profit, including the stark 2022 US DVD/Blu-ray revenue of $1.2B versus $18B in 2011.

Statistics · 2026
Movie Theater Attendance Statistics
U.S. movie theater attendance rebounded to 820 million tickets in 2023, a 24% jump from 2022, yet it still sits below the 2019 peak of 1.34 billion as streaming, pricing, and availability reshaped demand. See how global admissions moved from 7.3 billion in 2019 to an estimated 6.2 billion in 2023 and which factors kept people choosing big screens, from premium formats and blockbuster power to social habits and ticket affordability.

Statistics · 2026
Harry Potter Statistics
A jaw dropping split sits at the heart of these Harry Potter statistics, with 37 BAFTA nominations yet only 2 wins, while the franchise racked up 12 Saturn Awards and even topped the Guinness record for most translated books by a single author. You will also find how 600 million plus copies sold worldwide and $7.7 billion in book revenue by 2016 from the wizarding universe meet the film figures that pushed global box office past $7.73 billion.

Statistics · 2026
Harry Potter Books Statistics
From 7 books and a precisely counted 1,084,170 words to over 600 million copies sold worldwide, this page ties every spell, house, and award moment to the series that still dominates bestseller lists. It also shows how Philosopher’s Stone began with a 500 copy hardcover print run and later won the Nestlé Smarties Book Prize, while the translation footprint, record sales surges, and stage and screen juggernaut kept expanding through 85 languages by 2023.