Market data
Construction Infrastructure
Explore construction infrastructure statistics and market research reports with sourced data and trend analysis.
Latest update:
 Jonathan Hale

Statistics · 2026
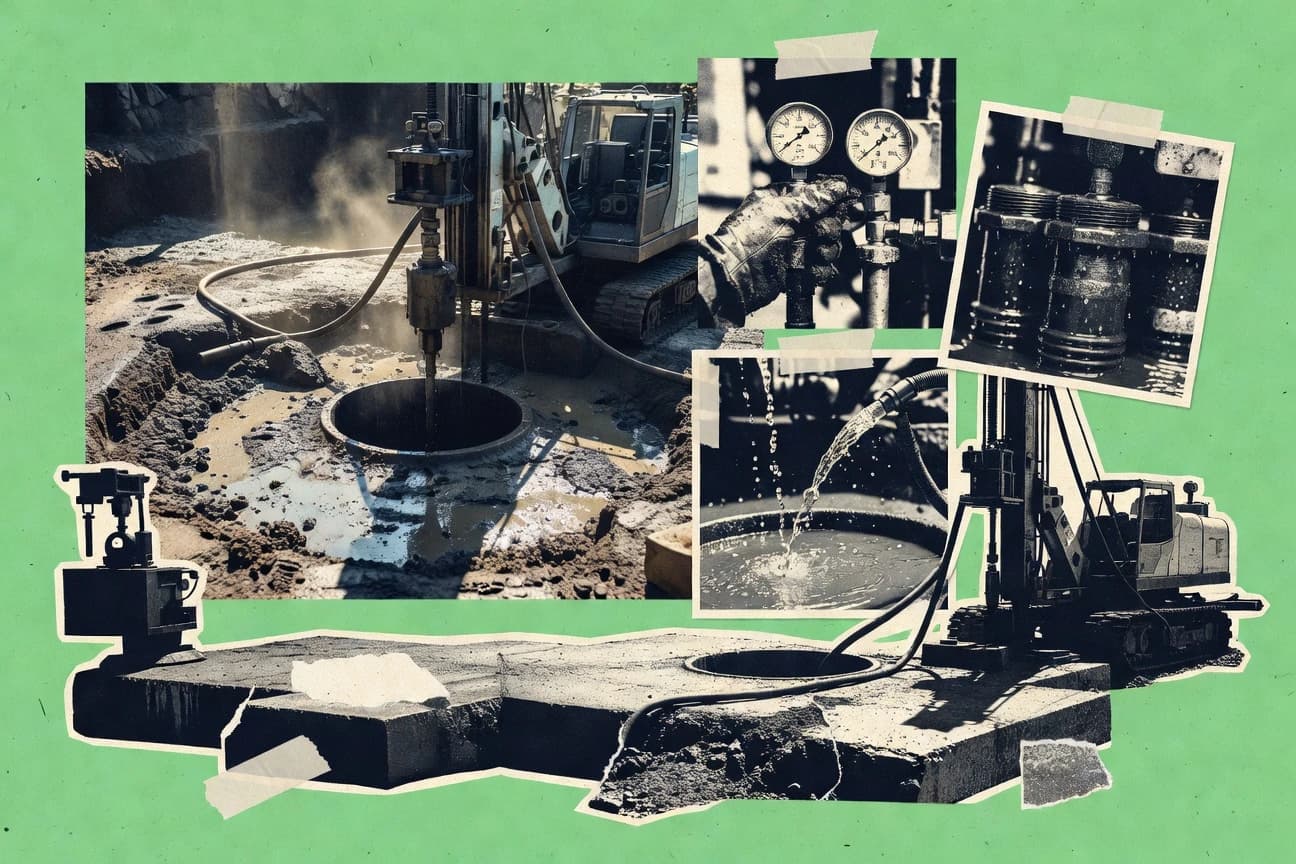
Water Well Industry Statistics
Groundwater is not one-size-fits-all. From 75% of new Australian wells using PVC casing materials in 2023 to 0.020 inch screen slot averages for U.S. sand aquifers and subsidence risk hitting 40% of global wells from overpumping, these statistics explain why drilling choices, yields, and water quality diverge so sharply by region and method.

Statistics · 2026
Kazakhstan Construction Industry Statistics
With construction output index up 5.7% in January 2024 versus January 2023, Kazakhstan’s building boom is clearly re-accelerating even as skilled labor shortages hit 65% of firms. This page ties together the sector’s latest employment, investment, productivity, and safety snapshot across regions so you can see where growth is coming from and what could slow it next.

Statistics · 2026
Hong Kong Construction Industry Statistics
Construction activity in Hong Kong is forecast to climb to HK$280 billion by 2027, yet latest Q1 2023 output dipped to HK$60.2 billion seasonally adjusted, making growth feel anything but smooth. Track how the sector is balancing demand, costs and people, from construction deflation of -0.5% in 2022 and tender price rises to a 2.8% 2022 unemployment rate and persistent skilled labour gaps.

Statistics · 2026
House Building Industry Statistics
With 2025 still too uncertain to trust, this page uses fresh signals such as a 6.81% 30 year fixed mortgage average in 2023 and a 5.2% Q4 2023 rise in the Construction Cost Index to show why building costs and affordability keep tightening. It ties everything to the real cost stack, with materials at 57% and labor at 27%, plus regional build totals like $510,000 in the Northeast versus $395,000 in the South, so you can see exactly what is driving quotes, not just trends.

Statistics · 2026
Ceramics Tile Industry Statistics
From a projected 12.6% CAGR for the ceramic tiles market through 2032 to kiln energy use where 65% of EU consumption is tied to firing, this page connects demand growth with the levers that actually cut emissions and costs. You will also see why natural gas still drives about 60% of kiln fuel in Europe and how newer controls and waste heat recovery can trim kiln fuel, alongside the regulatory reality of EU ETS coverage and tight REACH scrutiny of tile chemistry.

Statistics · 2026
Sydney Construction Industry Statistics
Sydney’s construction industry leans on skilled, but strained, labour with a mid 2023 shortage of 22,000 workers hitting 65% of firms while overtime averages 5.2 hours a week. Find out how pay sits at $2,150 weekly in Q4 2023, profit margins average 4.2%, and where the biggest shifts are for apprenticeships, safety, and major pipeline spend driving growth across the city.
Statistics · 2026
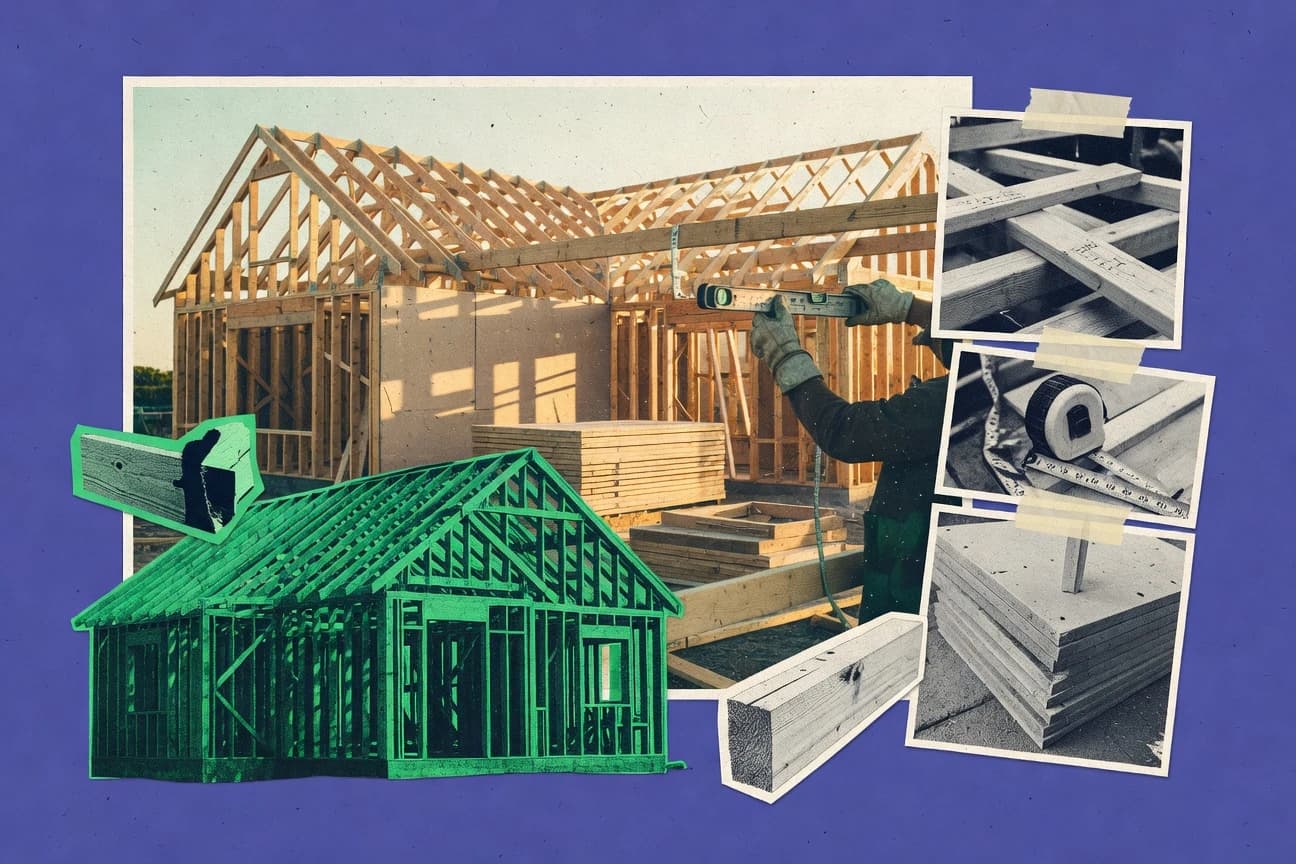
House Building Statistics
See why building a single-family detached home now averages 10.2 months from permit to occupancy, with every trade milestone timed to the week and cost pressure reflected in a $492,300 nationwide average. Then compare the schedule and labor impact of innovations like prefab and BIM, against the real drag from 6-week permitting in major metros and 2-week supply chain delays.