GITNUX MARKETDATA
Browse Our Category
Chemicals Industrial Materials
Latest update:

European Chemicals Industry Statistics
Europe’s chemicals industry is still steering an uneven course as production and trade indicators diverge and recycling and circularity efforts scale up in the latest figures. Get the 2025 snapshot of where growth is holding, where supply chains are tightening, and which sustainability metrics are moving fast enough to change the narrative.

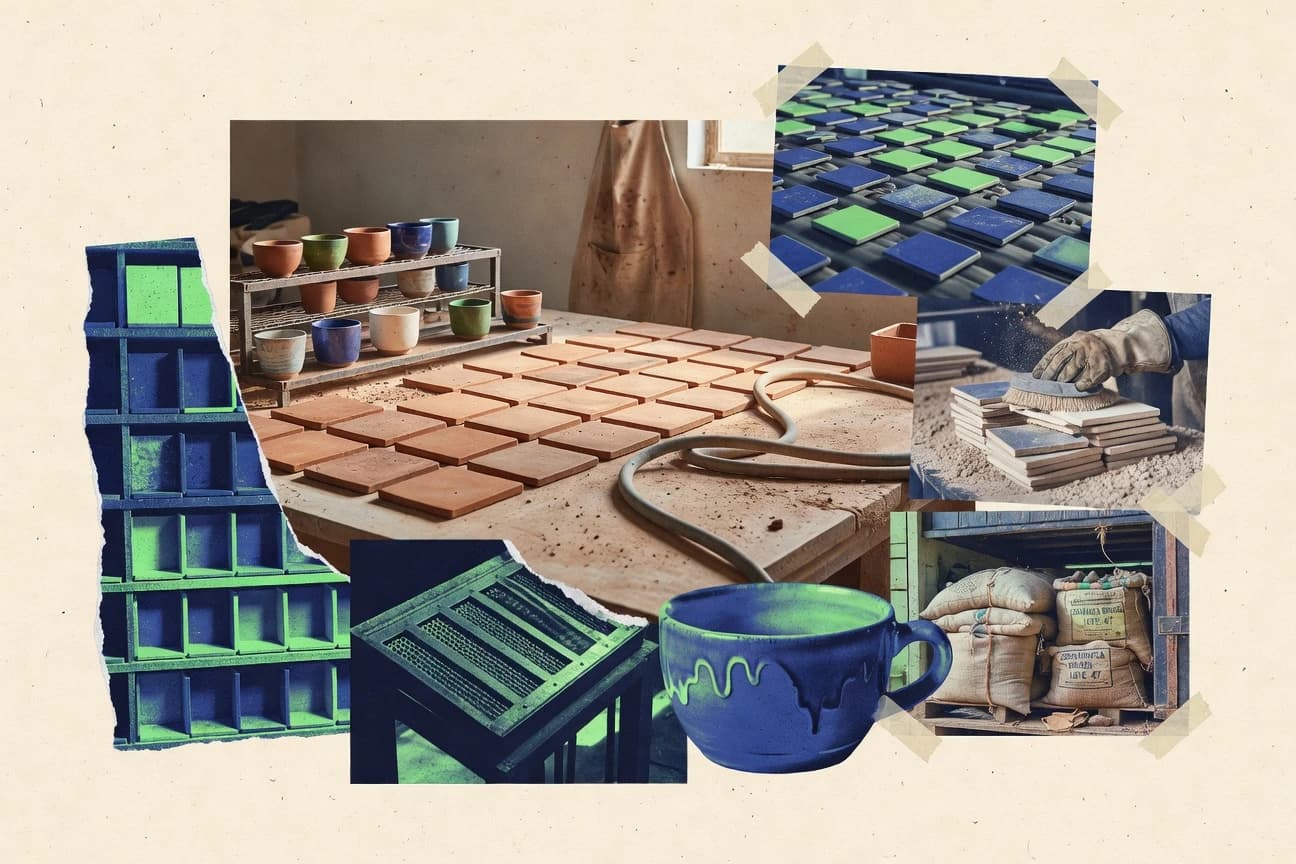
Ceramics Industry Statistics
See how the ceramics industry is reshaping itself with 2026 demand growth and 2025 shifts in capacity, pricing, and trade that don’t look like the industry’s recent playbook. This page makes the practical contrast between what manufacturers expect and what the market is actually rewarding.
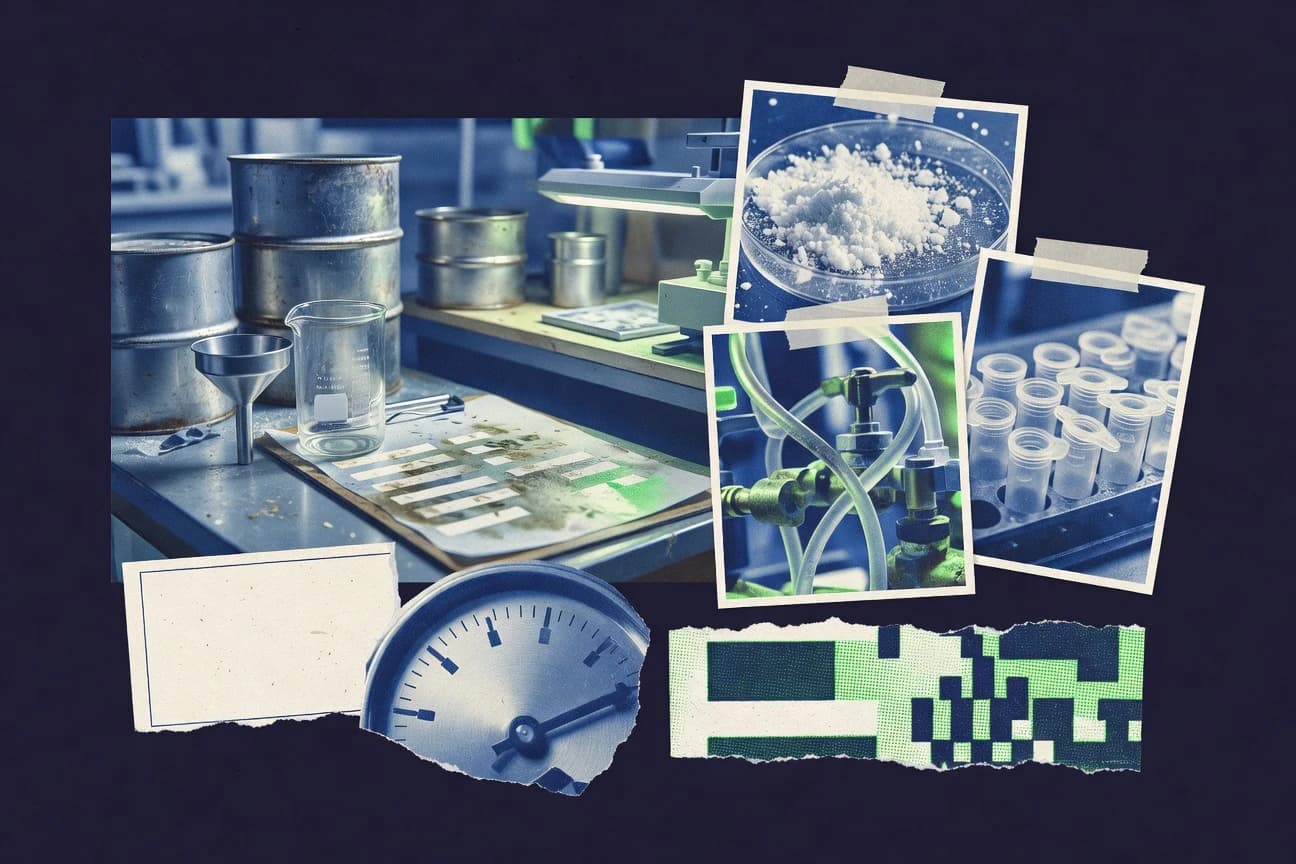
88. Chemical Industry Statistics
88. Chemical Industry’s statistics page tracks where the industry is truly moving, with 2026 figures that reveal how production and demand dynamics are shifting faster than many forecasts suggest. The standout is the contrast between what looks stable on paper and the specific indicators that point to the next pressure points for investment and planning.
Materials Industry Statistics
Steel, cement, plastics, and key metals are moving together and the gap between production scale and climate impact is stark. In 2023 global steel output is 1,874.5 million tonnes and China alone contributes 57% of global crude steel while cement production reached about 4.5 billion tonnes in 2019 and the sector still accounts for around 7% of global CO2.
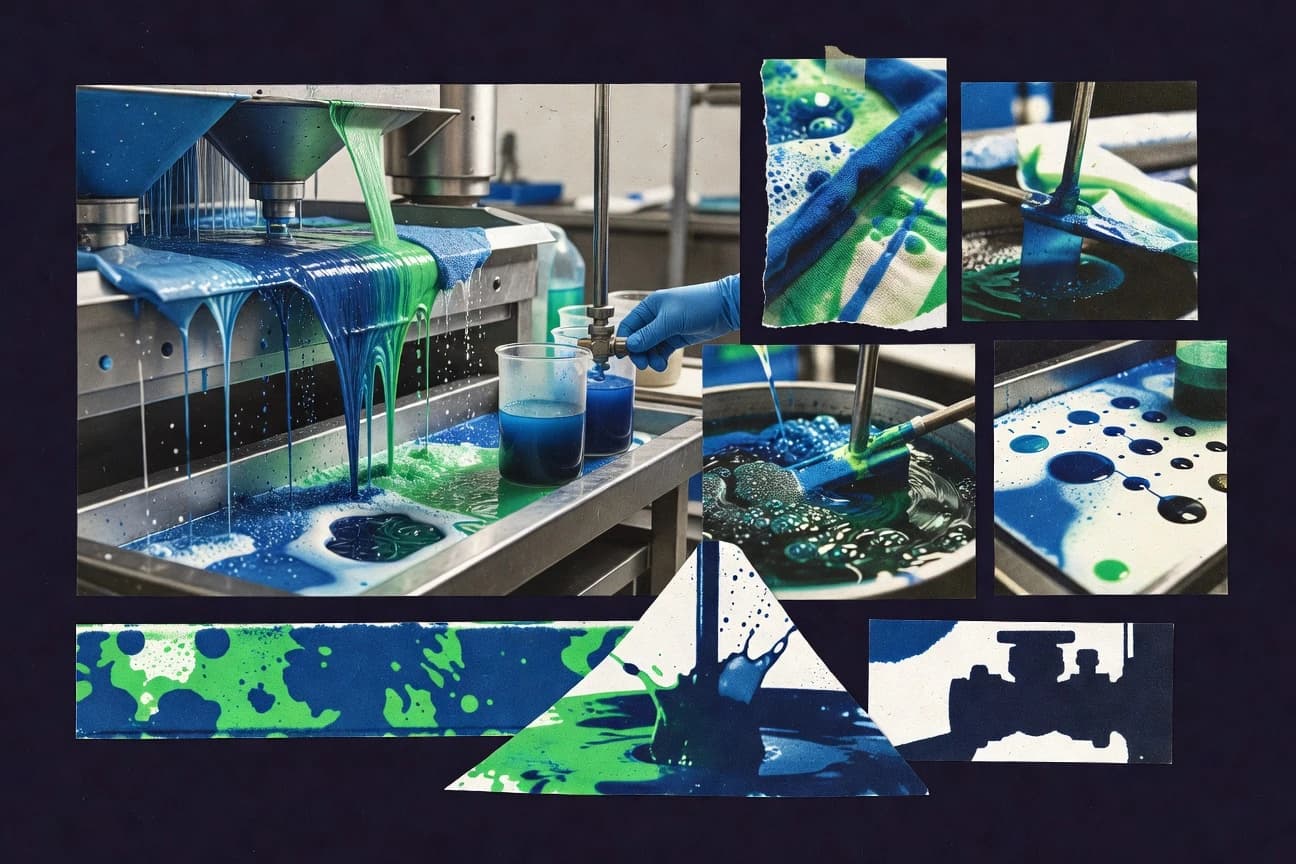
Dye Industry Statistics
Global dyes and pigments are forecast to reach USD 55.3 billion by 2033 with a 5.0% CAGR through 2033, while China alone produced 1.2 million metric tons of dye in 2022. This page pairs those scale makers with end market splits and tightening EU chemical rules, then follows through to what wastewater cleanup can realistically achieve from 90% decolorization to near complete dye rejection.
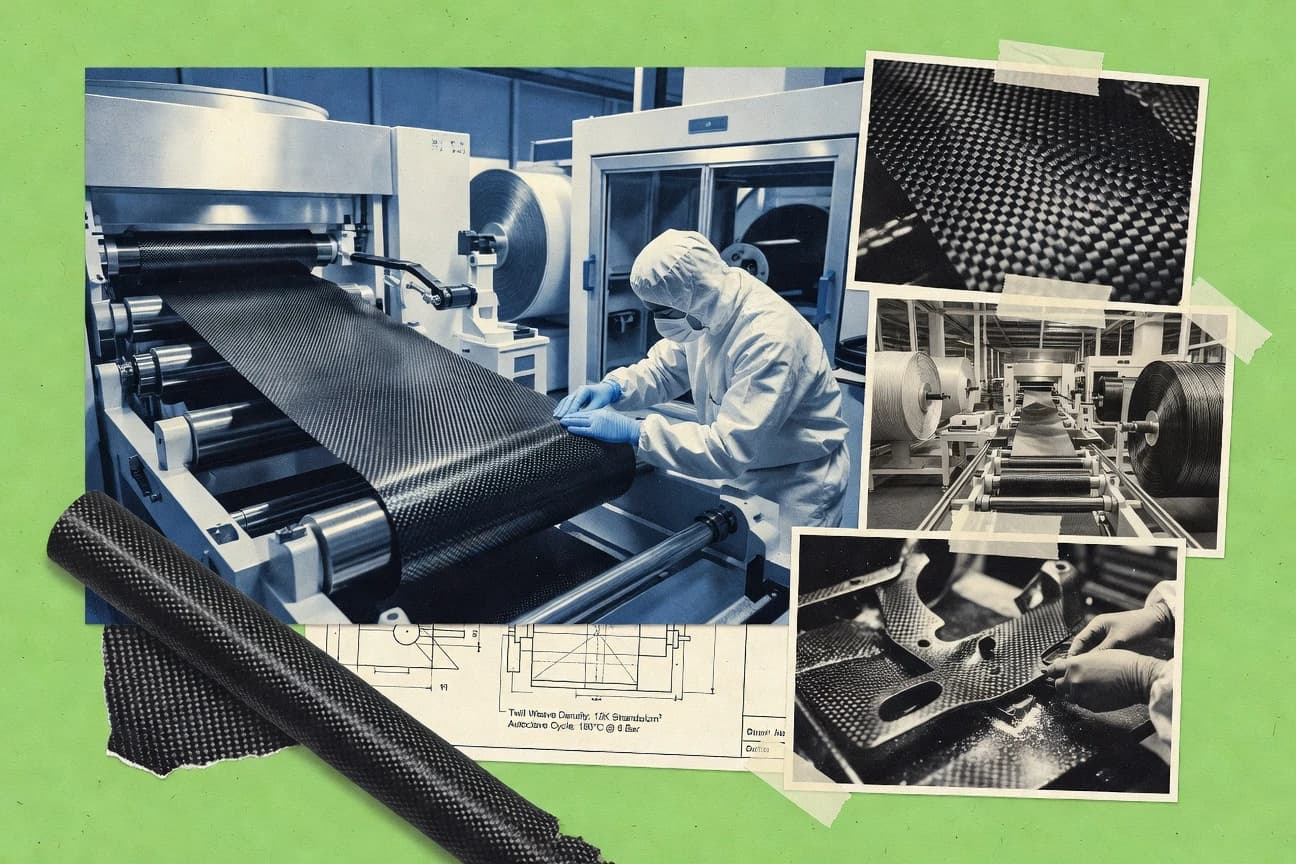
Carbon Fiber Industry Statistics
The Carbon Fiber Industry statistics page puts 2026 growth in focus with a 2.0% CAGR for global carbon fiber prepreg market (2019 to 2026) and an eye catching projected 14.4% CAGR for the carbon fiber market (2021 to 2026). You will see how millimeter scale prepreg choices, from 0.3 to 1.1 mm ply thickness, scale into multi billion market shifts like US$7.4 billion by 2027 and why wind and aerospace alone can account for at least 45% of demand.
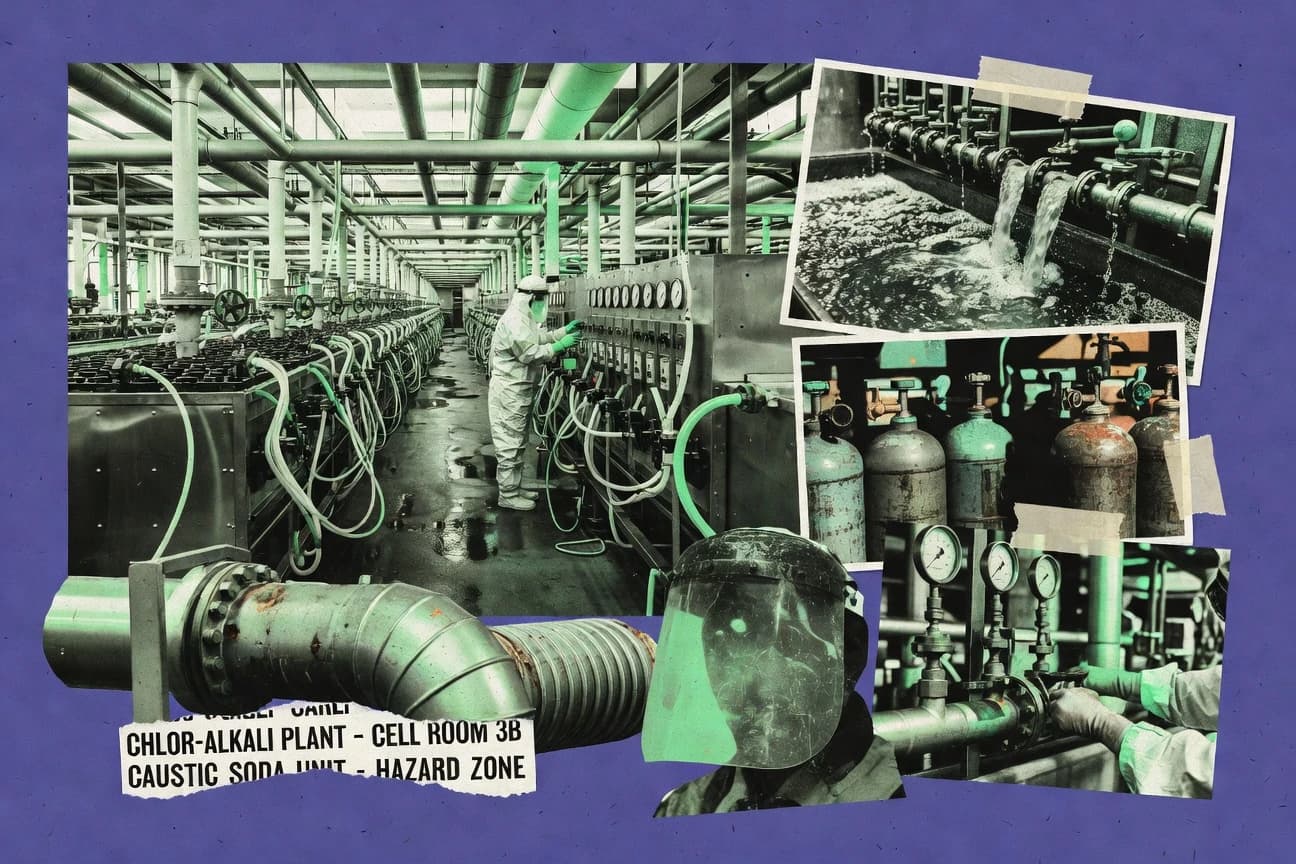
Chlor-Alkali Industry Statistics
Chlor-alkali operators can still protect caustic yield by tightening brine and mercury cell controls since best-practice documents report 1% to 3% yield impacts from brine and water losses and up to a 0.3% to 0.5% mercury use reduction from disciplined mercury cell management. The page connects that plant-floor reality to 2023 global scale, including $45.2 billion caustic soda and $31.8 billion chlor-alkali market estimates alongside China’s dominance in capacity, while also pinning down the energy benchmark of about 2.5 to 3.2 MWh per tonne of caustic soda that drives everything from spreads to emissions costs.
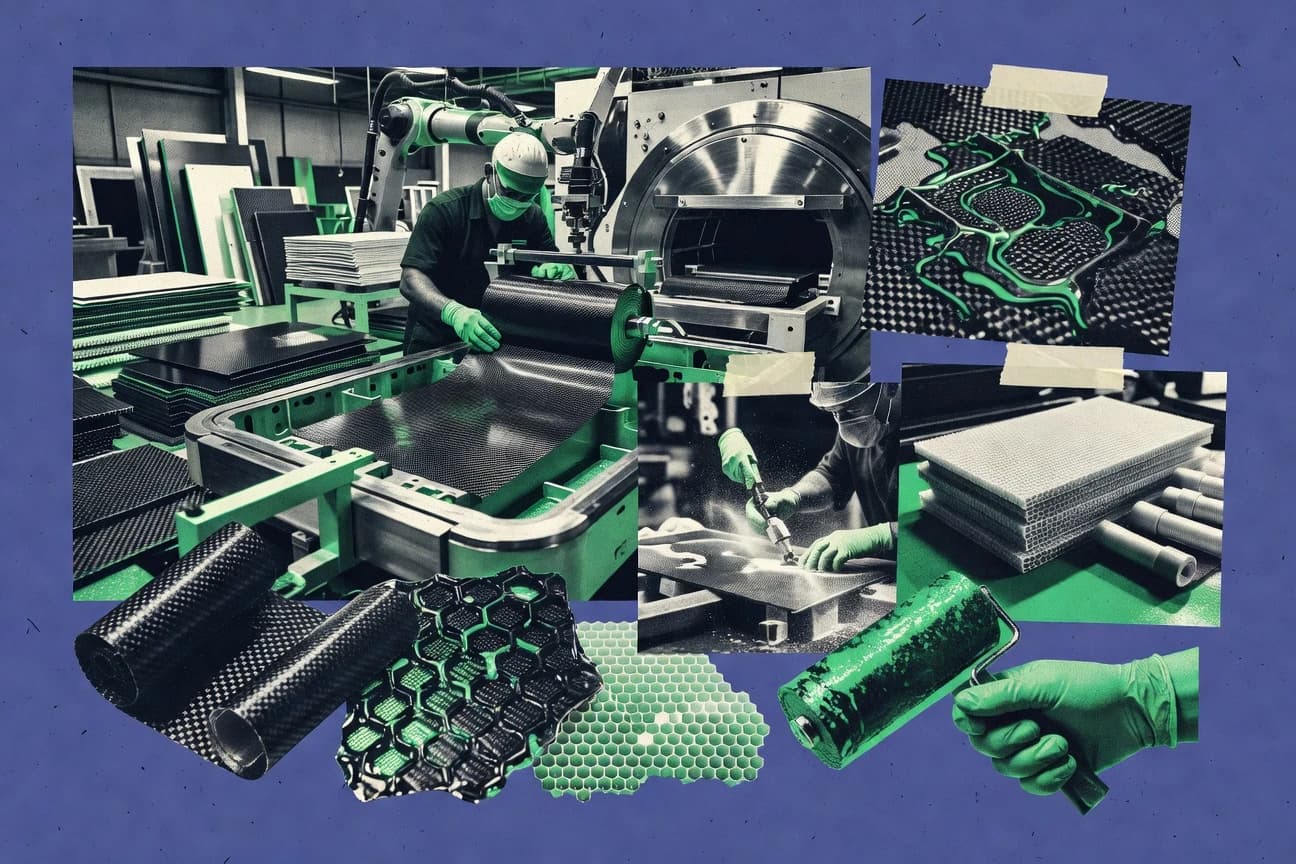
Composite Materials Industry Statistics
See why the composite materials market is projected to jump from $91.1B in 2025 to $200.4B by 2032, with a 5.0% CAGR shaping everything from aerospace demand to fast growing wind turbine blades. Then compare carbon fiber and prepreg growth, including 4.9% CAGR for carbon fiber through 2030 and 9.5% prepreg momentum toward $3.4B by 2032, alongside the real supply picture of 2.9 million metric tons of global composite capacity.
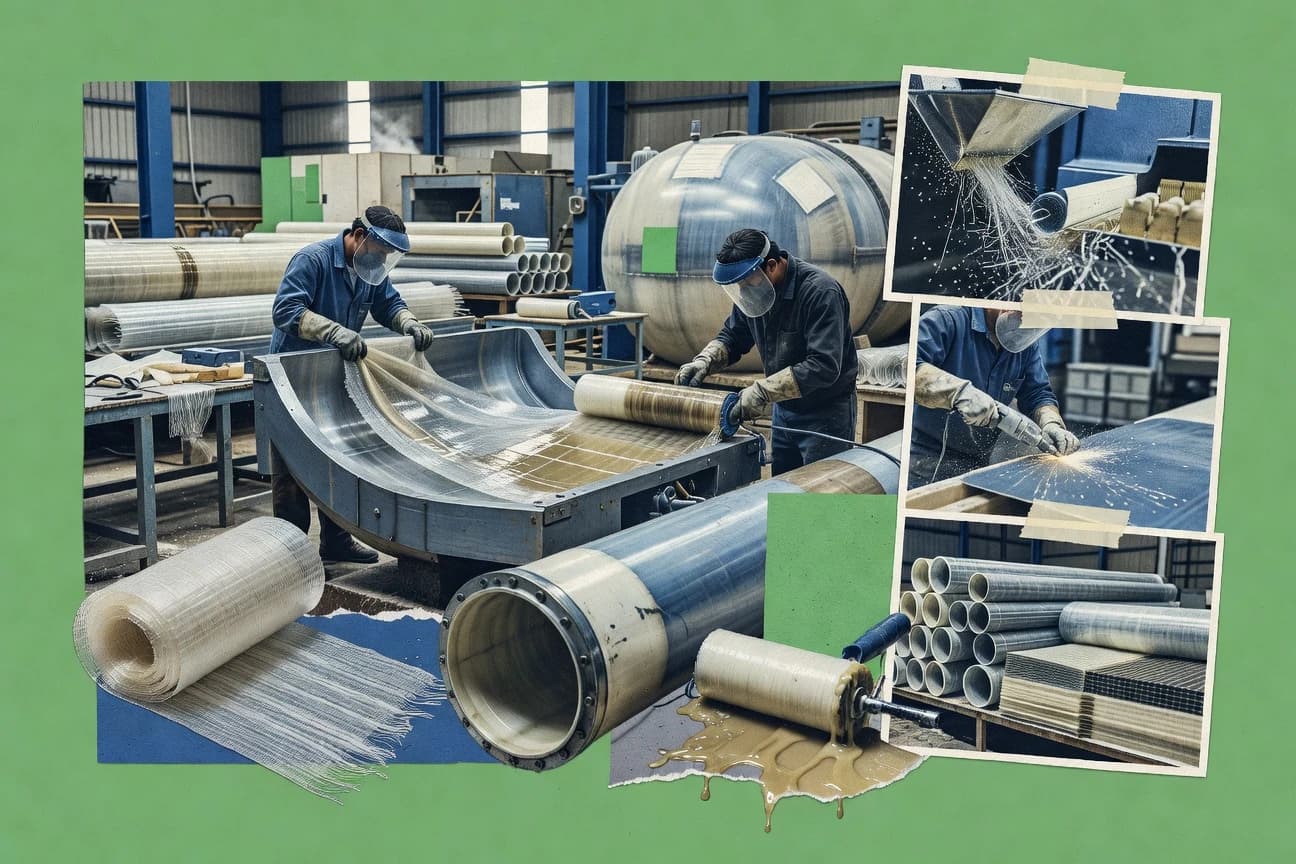
Frp Composites Industry Statistics
With the global FRP market projected to reach 66.9 billion by 2035 on a 4.25% CAGR from 2023 to 2035, the real story is how fast demand is shifting to regions and applications that value corrosion resistance and lighter weight, from Asia Pacific’s 39.2% share to transportation and wind blades ramping up. You will also see where the fiberglass reinforced plastics market is heading toward 84.7 billion by 2030 and why FRP in infrastructure, pipes, and rebar is increasingly beating steel on lifecycle cost and performance.

Paint And Coatings Industry Statistics
From VOC limits measured in g per liter to barrier performance quantified in oxygen and water transmission rates, this page connects the regulations that shape coatings formulation with the lab specs that decide corrosion, gloss, and weathering outcomes. It also tracks fresh cost and market pressure points, including a $0.11 per kWh U.S. electricity average in 2023 and a 2023 global protective coatings market rise toward $83.1 billion by 2030, so you can see exactly what is tightening, what is loosening, and why that matters for coating performance and profitability.
India Chemical Industry Statistics
India’s chemicals industry is gearing up for a faster, bigger next phase with petrochemical expansion projects worth INR 5 lakh crore already underway in 2023 and new ethylene capacity of 2.5 MMTPA planned by 2025, while total chemical exports hit USD 25 billion in FY23. The page connects this buildout to who is buying and investing, from USD 15 billion of 2014 to 2023 chemical sector FDI to specialty chemicals exports rising 25 percent to USD 5.5 billion in 2023.
Enzymes Industry Statistics
Industrial enzymes production hit 15 million metric tons in 2023 as Food and beverages alone accounted for 40 percent of total use at 6.0 million tons, while breakthroughs like PCR enzymes handling 1 billion reactions daily contrast with wastewater treatment scaling to 500 million m3. This page makes the supply chain tangible by tying sector level volumes and performance gains to the market totals and leading players shaping 2025 to 2030 growth.

Flavors Fragrance Industry Statistics
See how market leaders are reshaping flavors and fragrances with Givaudan’s share rising to 11% and the natural flavors surge to USD 5.3 billion in 2023, even as top 10 players control 65% of the market. The page also pinpoints what growth is doing elsewhere across regions and categories, from synthetic dominance to fast moving clean, plant based, and functional trends.
Bioplastics Industry Statistics
Bioplastics packaging is already the heavyweight category, commanding 65% of the market in 2022 while the sector spans everything from compostable mulch films that biodegrade in months to bio PET bottles with PlantBottle scale ambitions. This page ties those end use realities to climate and waste outcomes, including global bioplastics saving 4.5 million tonnes of CO2 equivalent every year and a PLA shift that can cut landfill persistence fast, so you can see where adoption is moving fastest and why.
Turkey Chemicals Industry Statistics
Turkey’s chemical industry totals $28.5 billion in market value in 2022 and still drives 2.1 million tons of polymers imports and a $9.8 billion trade deficit in the latest trade snapshot. See how 320,000 direct jobs connect to a sprawling network from the Mersin cluster to specialty chemicals, plus sustainability investments and plant buildouts pushing emissions, recycling, and energy use in the same direction.
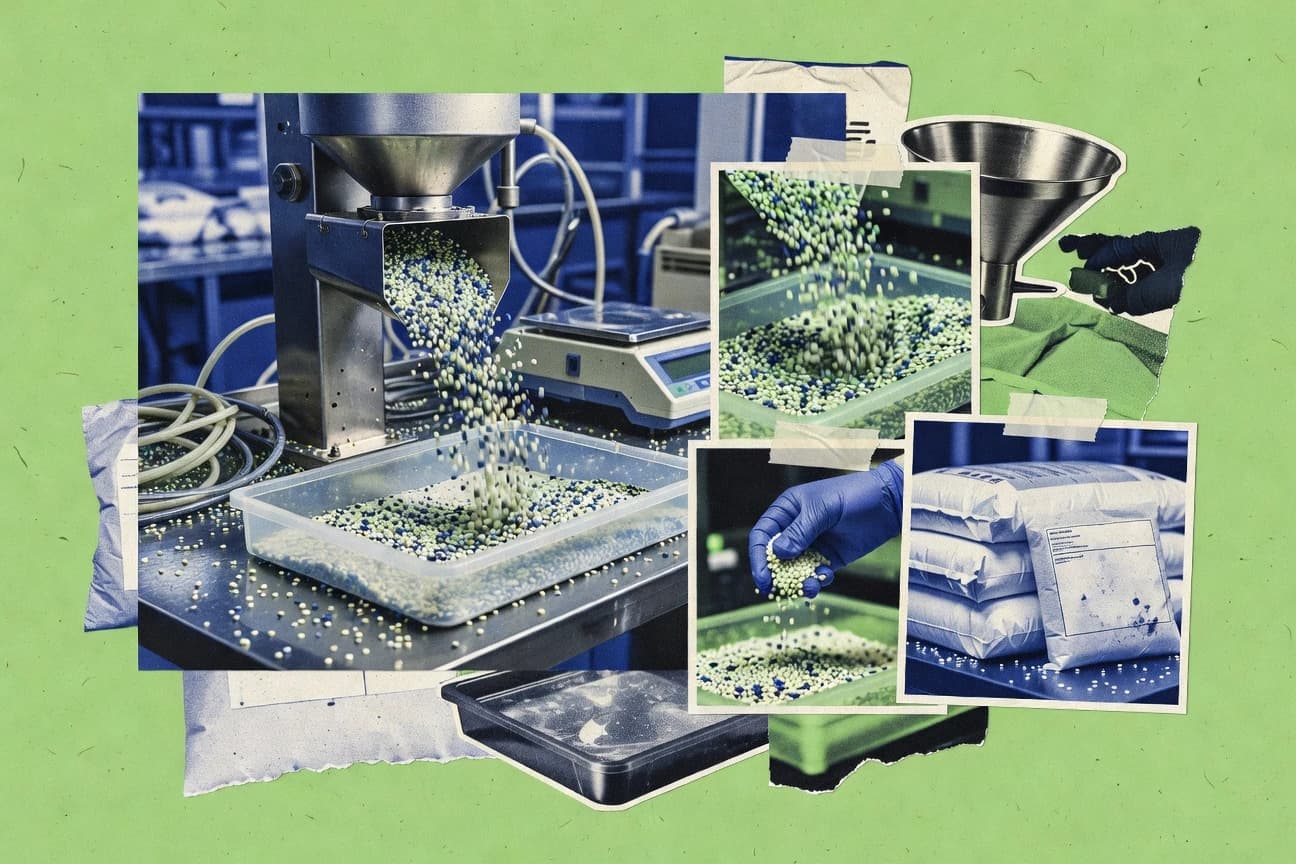
Masterbatch Industry Statistics
Global masterbatch demand is building momentum with 2023 market size at USD 13.2 billion and Asia Pacific owning 52% of global demand, while application use is split in strikingly different ways from flame retardant masterbatch at 90% for electronic enclosures to recycled masterbatch reaching 28% of European shopping bag production. If you want to understand where masterbatch chemistry is actually landing, these 2025 to 2026-ready figures connect what drives packaging, automotive, films, and performance additives to the production and market shifts behind them.
Materials Chemicals Industry Statistics
Green and bio based chemicals are set to more than double from 142 billion USD in 2023 to 285 billion USD by 2032, with an 8.1% CAGR driven by sustainability rules. Meanwhile, the specialty chemicals market is projected to climb from 1,100 billion USD in 2023 at a 5.8% CAGR through 2030 as demand from electronics and pharmaceuticals pushes growth, even as global chemical R and D and emissions pressure force faster, cleaner scale up.
Brazil Ceramics Industry Statistics
Brazil’s ceramics industry shows how scale and modernization are moving at different speeds, with total formal jobs at 220,000 in 2022 alongside a 2025-ready production mix that is increasingly efficient, cleaner, and export driven. From 950 million m² of tiles manufactured for export in 2023 to major job pockets across roof tiles, sanitary ware, and clay processing, the page connects workforce figures, output, and trade shocks to reveal where growth and pressure are actually landing across Brazil.
Dyes Industry Statistics
Global dyes market revenue is set to grow from USD 12.4 billion in 2023 to a projected USD 18.2 billion by 2030, but the real pressure point is cleaner production where 5 million tons of CO2 eq and 1.2 million tons of dyes wastewater still weigh on 2022 impacts. From China’s 1.2 million tons of dyes capacity to the EU ban of 40 azo dyes under REACH in 2023 and a surge of low impact dyes to USD 1.2 billion in 2023, this page connects demand swings with the rules shaping what gets produced next.
Vietnam Plastics Industry Statistics
Vietnam plastics demand is massive and still shifting fast, reaching 8.5 million tons in 2023 with packaging taking 49% at 4.2 million tons, while recycling rose 25% to 650,000 tons and single use plastics fell 12% to 1.8 million tons. Use these figures to understand where Vietnam’s growth is coming from, how imports are reshaping resin supply, and why plastics trade was valued at USD 5.2 billion for exports against USD 6.8 billion in imports in 2023.