GITNUX MARKETDATA
Browse Our Category
Chemicals Industrial Materials
Latest update:

Chemistry Industry Statistics
See why chemistry industry decision makers are watching 2026 numbers closely as demand shifts and costs tighten across the supply chain. The page puts current, headlining metrics side by side so you can spot where growth is accelerating and where margin pressure is turning into a real operating constraint.

Bopp Film Industry Statistics
Bopp Film Industry’s latest numbers lay bare a sharp swing in production momentum, with the biggest change showing up where you would least expect it in the same year the page was updated. If you want to see how the market shifted in time to affect what gets funded and released, this is the statistics stop you cannot skip.

Epoxy Coatings Industry Statistics
With a 3.5% projected CAGR for the epoxy resins market from 2024 to 2029 and epoxy-based coatings stakes embedded across a USD 7.6 billion global epoxy resins market and a USD 5.8 billion epoxy coating market, this page connects growth with the corrosion and floor performance demands that keep epoxy systems in play. It also pairs application reality with compliance and testing pressure, from ISO 12944 durability expectations and ASTM pull off and abrasion checks to VOC and hazard regulations that are reshaping what formulators can ship.

Silicone Industry Statistics
Global silicone revenue is set to rise from USD 21.2 billion in 2023 to USD 31.7 billion by 2032 at a 4.3% CAGR, while silicone elastomers climb to USD 7.9 billion by 2030 and sealants expand to USD 11.3 billion by 2032. Asia Pacific leads the market in 2023, but the growth rates across gels, fluids, and rubbers hint at a fast changing demand map worth tracking.
Grease Industry Statistics
Grease demand is projected to keep climbing even as vehicles electrify, with the global greases market expected to rise from USD 16.0 billion in 2022 to USD 21.1 billion by 2030 at a 3.5% CAGR from 2023 to 2030. You will also see how tighter specs and safety standards, from NLGI grade testing to used oil rules, collide with real world growth across rail, wind, mining, and aerospace.

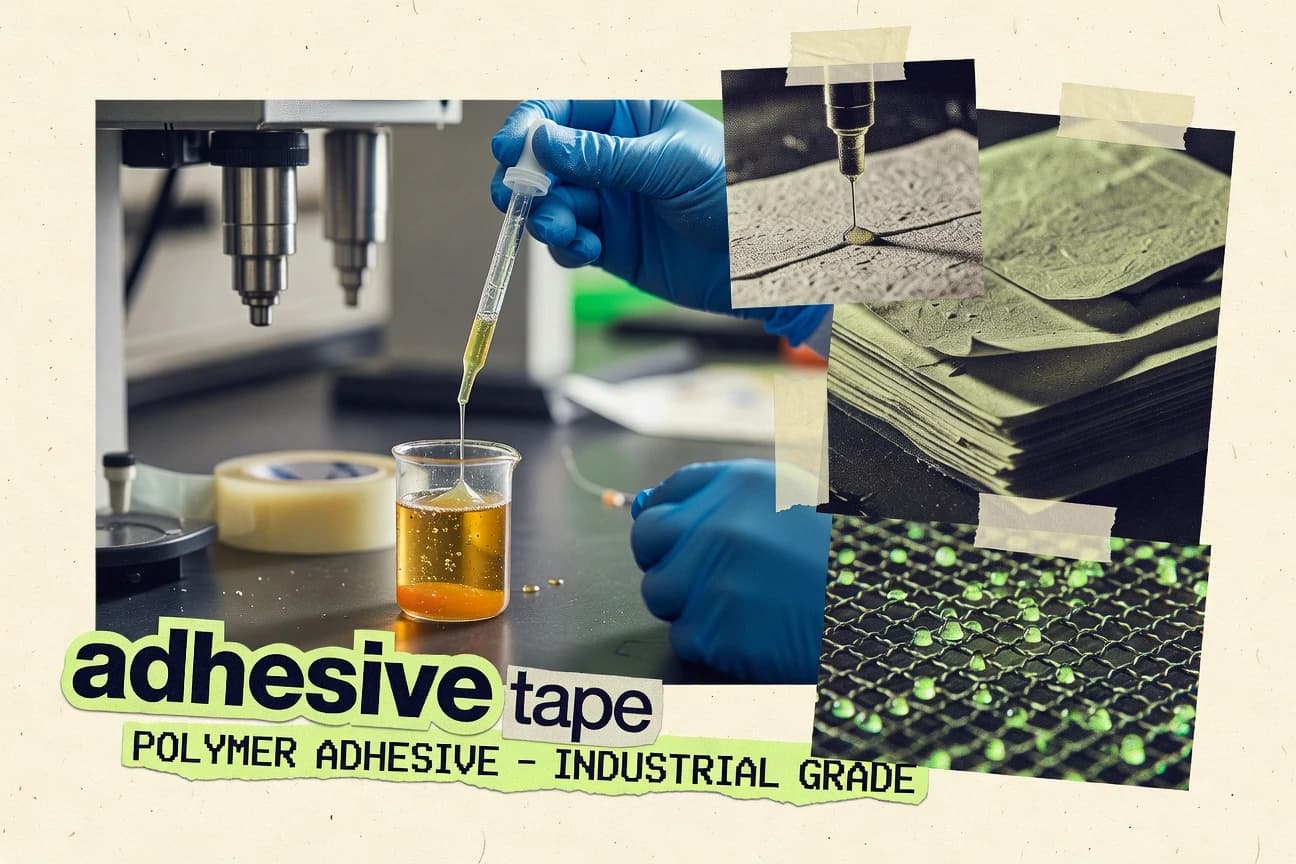
Adhesive Tape Industry Statistics
The global adhesive tape market is already climbing from $65.17 billion in 2022 to a forecast $99.76 billion by 2030, and Precedence Research projects a 5.60% CAGR from 2023 to 2030, with North America holding a 32% share. Masking, duct, packaging, cloth, double sided, and electrical tape each carve out their own growth rates, while regional momentum and pressure sensitive label demand help explain why these materials keep reappearing in packaging, construction, electronics, and logistics.

Japanese Chemical Industry Statistics
See how Japan’s chemical industry is reshaping its numbers in 2025, from production and shipments to the balance between domestic demand and exports. The latest figures reveal where momentum is building and where costs and output are coming unstuck.
Terpene Industry Statistics
What’s happening to terpene demand and pricing right now looks very different from last year, and the page lays it out with the latest 2026 and 2025 signals. If you track formulation costs, market momentum, or compliance risk, these statistics help you spot the shift before it becomes the new normal.

Composites Industry Statistics
See how 2026 demand forecasts and the latest production and trade shifts are reshaping composites priorities from tooling to components, not just for today’s supply chains but for the next investment cycle. It’s a sharp reality check on where growth is accelerating and where bottlenecks are tightening, using the most current figures available.
Russia Chemical Industry Statistics
Russia’s chemicals story comes into sharper focus with 0.73 tCO2 per tonne of output in 2022 alongside a $0.08 per kWh industrial electricity benchmark for 2023 and $6.6B in 2022 chemical imports, highlighting how cost and emissions realities travel together. At the same time, 3.8% contraction in production volume and a 1% net slowdown in polyethylene capacity additions contrast with Russia’s export relevance and ammonia trade weight, making the balance between resilience and constraint impossible to miss.
Adhesives Industry Statistics
Adhesives Industry is heading into 2025 with procurement, performance claims, and sustainability targets tightening at the same time, pushing suppliers to explain more than ever. These key statistics map the shift in demand and cost pressure that could decide which manufacturers win major orders next.

Coatings Paint Industry Statistics
Track how 2026 distribution and demand signals are reshaping coatings and paint buying decisions, from what customers expect on delivery to what producers must plan for next. The page spotlights the sharp shifts behind price, volume, and capacity so you can separate short term noise from the trends that actually move the market.
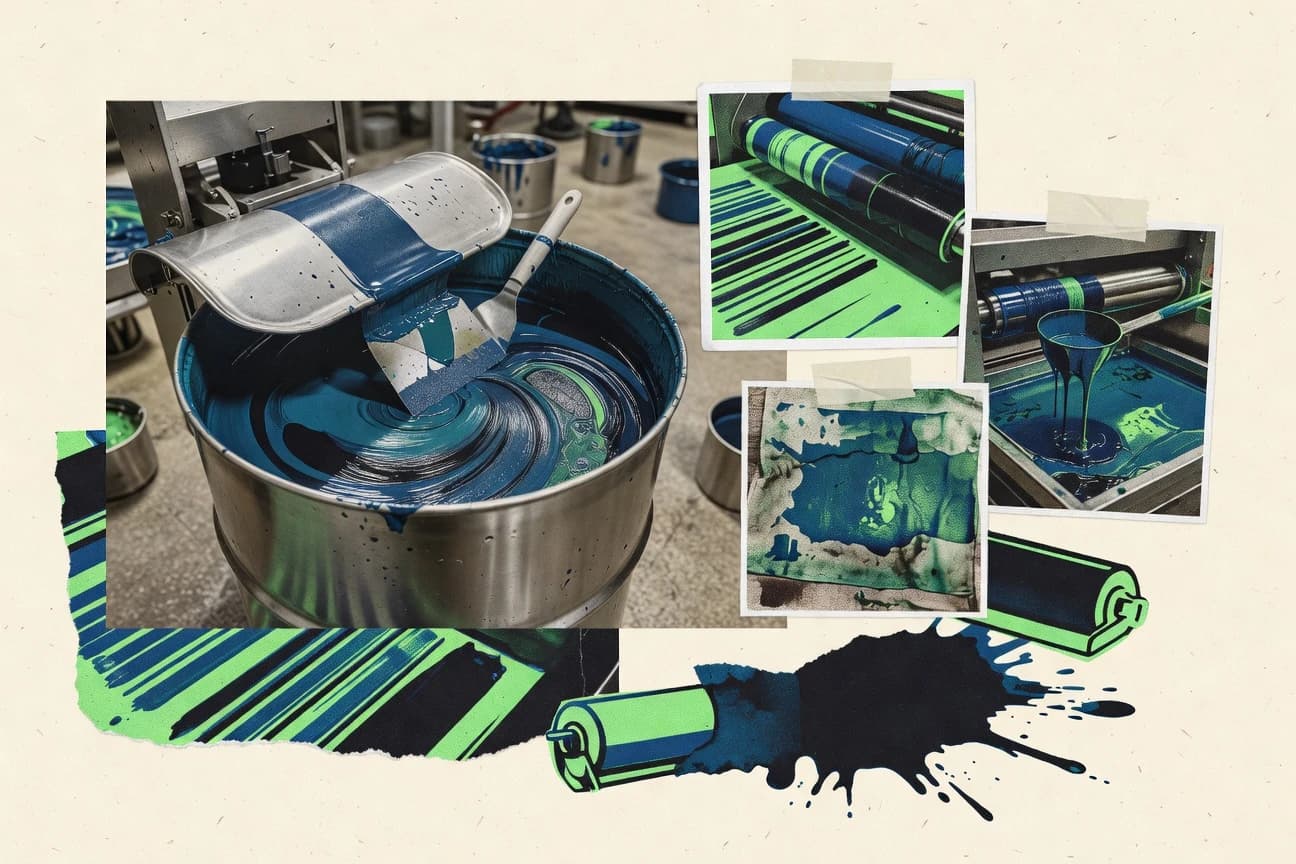
Ink Industry Statistics
Ink Industry’s latest statistics capture a striking shift in how ink demand is moving and where growth is being rerouted, with 2026 figures setting the tone. If you want to understand what is changing right now and what it means for sourcing, costs, and production decisions, this page gives you the key numbers in one place.

Frp Industry Statistics
FRP Industry’s latest statistics track how production, applications, and market demand are shifting in 2025, with the clearest tell coming from the jump in key end use categories. See which segments are accelerating and which are slipping so you can spot where budgets and projects are moving next.
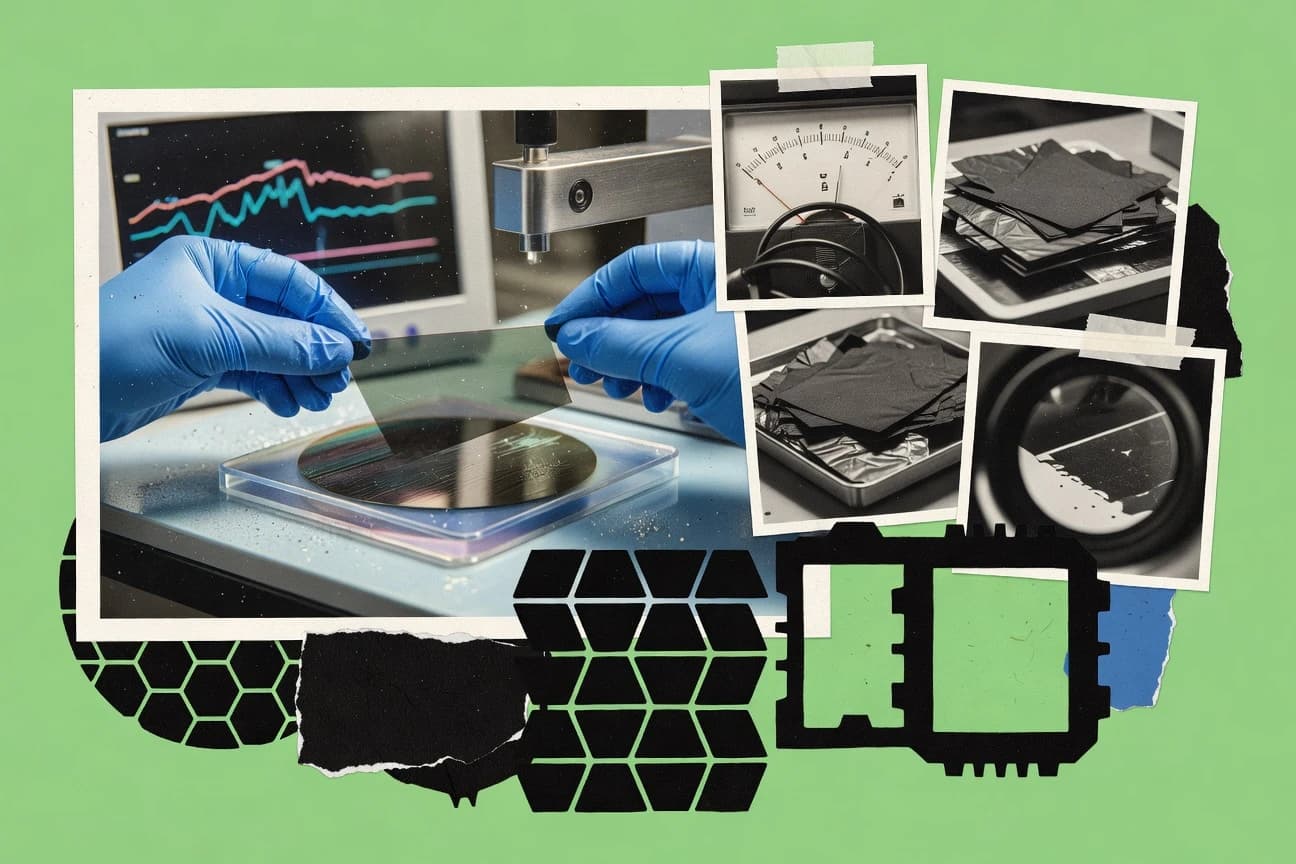
Graphene Industry Statistics
From 2.1 W/mK room temperature in plane thermal conductivity to 20–50% thermal gains in polymer composites and anticorrosion coatings up to about 90% inhibition efficiency, the page connects lab benchmarks with market momentum that keeps accelerating. You will also see how batteries became the fastest growing end use, the EU’s roughly 25% share of demand, and flagship scale funding totaling €1.8 billion alongside growing production capacity cited at 2,000+ tons per year and publication output rising more than 10% annually.

Vinyl Industry Statistics
The vinyl industry is booming globally with sales growing for seventeen consecutive years.
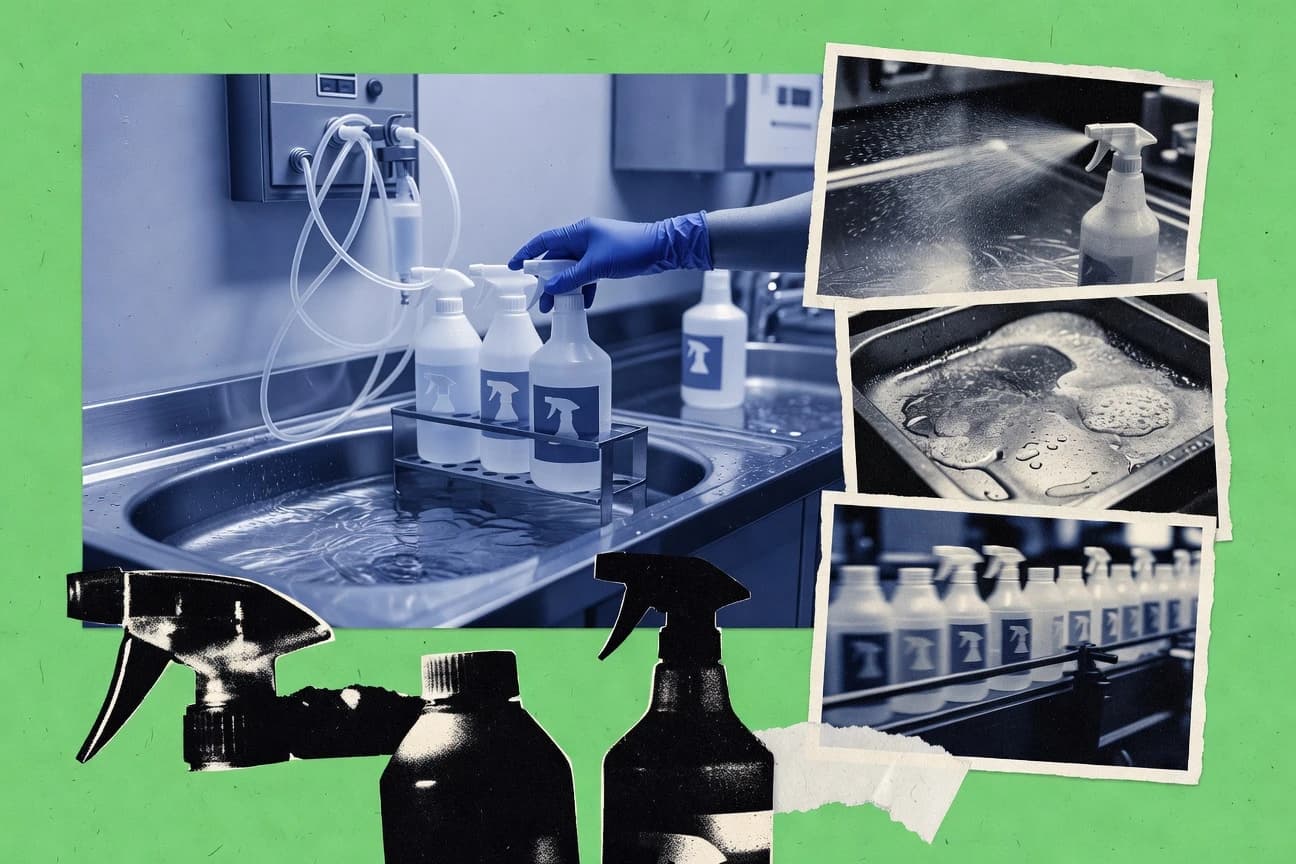
Disinfectant Industry Statistics
With the disinfectants market projected to reach $18.7 billion globally by 2032 and a 6.2% CAGR through then, the page also spotlights the real-world compliance and performance tensions behind those forecasts, from FIFRA and OSHA SDS rules to why hydrogen peroxide vapor can hit 6 log reductions while many UV C and quaternary ammonium outcomes hinge on correct setup and dwell time. It balances adoption and spending pressures too, including $1.5 million average annual U.S. infection prevention spend and survey signals like 27% of infection prevention pros citing lack of staff time as a barrier.
Surfactant Industry Statistics
With the European industrial surfactants market still dominated by detergents and cleaning at 64.6% and the global market projected to climb from $34.4 billion in 2023 to $59.1 billion by 2030, this page connects demand with pressure from sustainability rules and PFAS limits. You will also see why biosurfactants, APGs growth and wastewater and marine use cases matter side by side, alongside the cost swings behind key raw materials.
Nonwoven Industry Statistics
U.S. nonwovens demand is forecast to jump from $28.0 billion in 2024 to $38.1 billion by 2026, a faster climb than many suppliers planned for. See how production capacity, pricing pressure, and the reshaping of key end markets are lining up for 2025 and beyond.

Sealant Industry Statistics
See how 2026 projections upend the usual sealant demand assumptions, with key figures pointing to faster growth, shifting application priorities, and a market that is moving sooner than many buyers expect. If you specify, source, or invest, these Sealant Industry statistics cut through the noise and show exactly where the demand pressure is headed next.