GITNUX MARKETDATA
Browse Our Category
Chemicals Industrial Materials
Latest update:


Cork Industry Statistics
From 15,000 tons of cork used for HVAC sealing to 2.3 billion USD in global market value in 2023, this page maps how cork moves from vineyards to floors, insulation, and high performance composites. It also pairs sustainability benchmarks like 85% cork waste recycled and 0.1 kg CO2 eq per stopper with Portugal’s economic weight and growth outlook to explain why cork is both a climate tool and a serious industrial material.
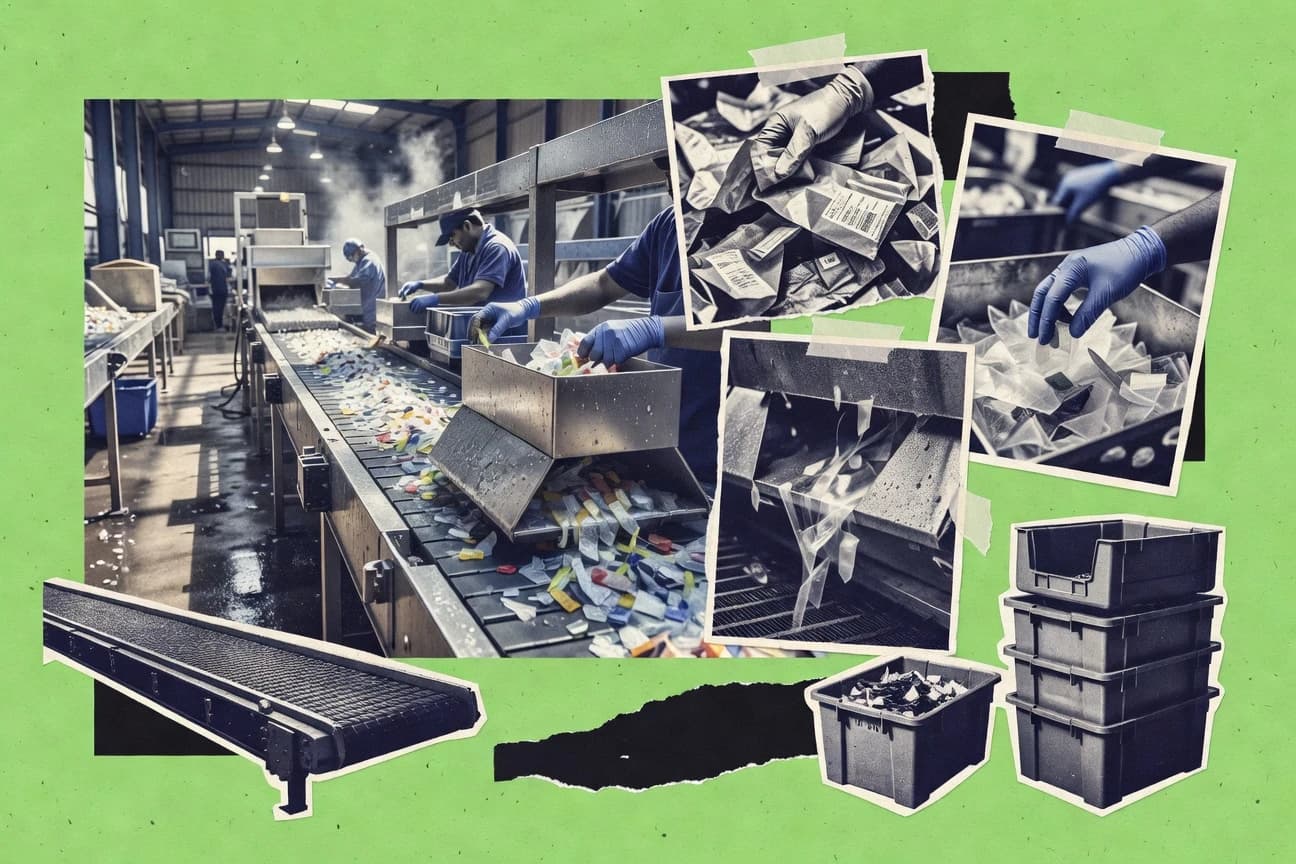
Mexico Plastics Industry Statistics
Mexico’s plastics industry is generating momentum with 450,000 direct jobs in 2023 and a nearshoring driven gain of 120,000 roles that pulls the whole supply chain to 1.2 million indirect jobs. At the same time, wages sit at MXN 12,500 a month and recycling is rising to 25 percent of total waste, so the page shows how Mexico is balancing growth with productivity, training, and circular economy pressure.
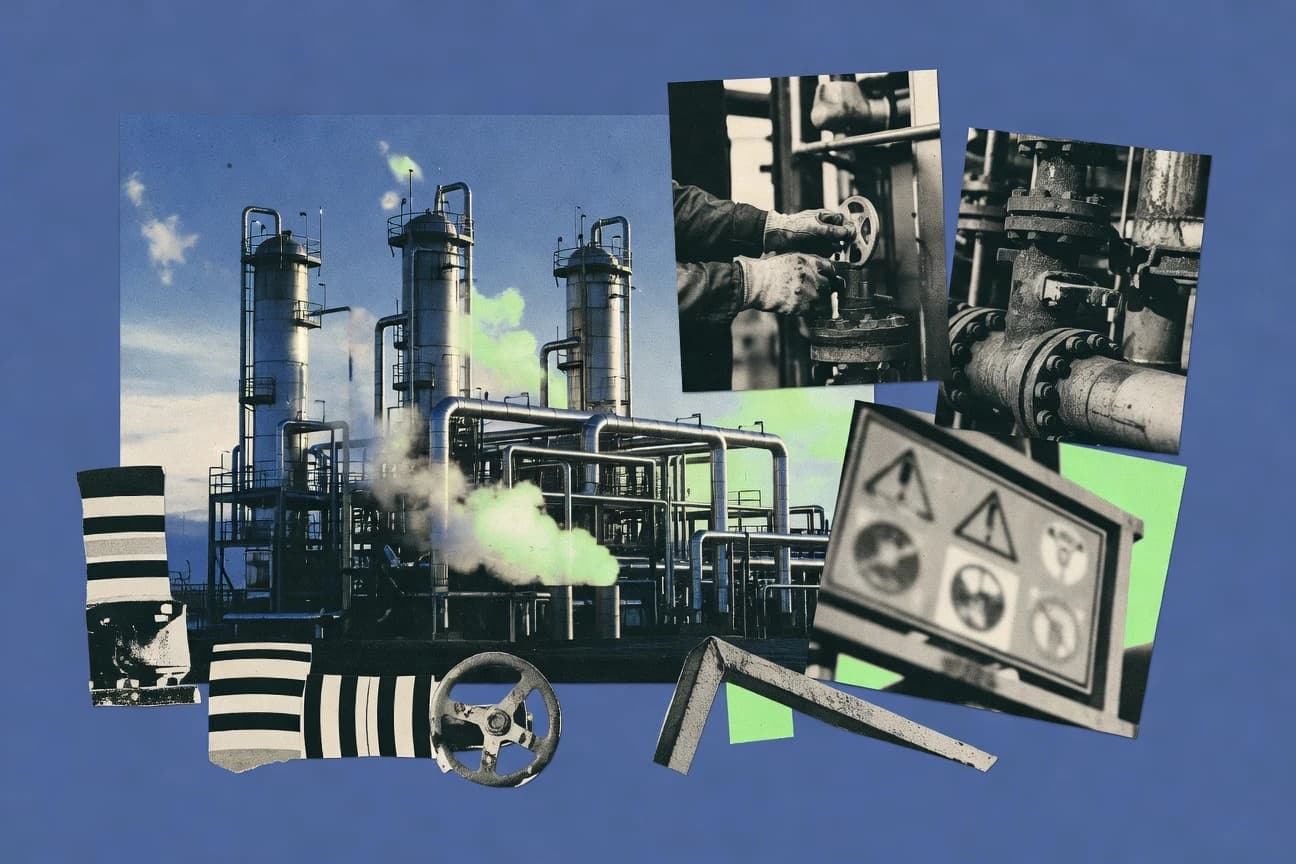
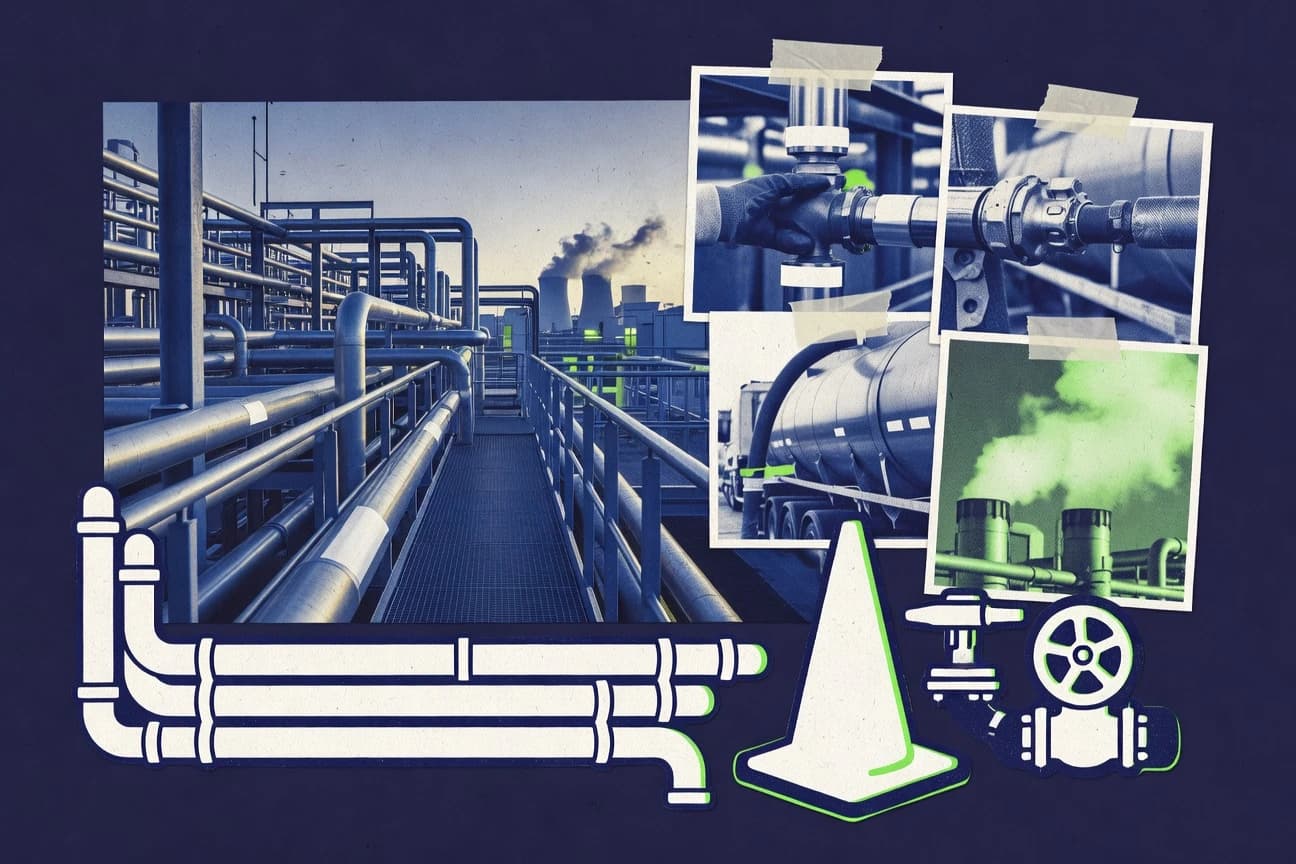
Petrochemicals Industry Statistics
See how petrochemical momentum is reshaping feedstock costs and emissions at once, from 3.3% projected global market growth for 2024 to 2030 to plastics value chain GHG targets of 1.34 gigatonnes CO2e per year by 2030. You will also find the operational pressure points behind the chemistry, like 4% of refining capacity being offline on average and how policy guardrails from EU ETS and CBAM to OSH fatality stats are influencing where new capacity can realistically land.
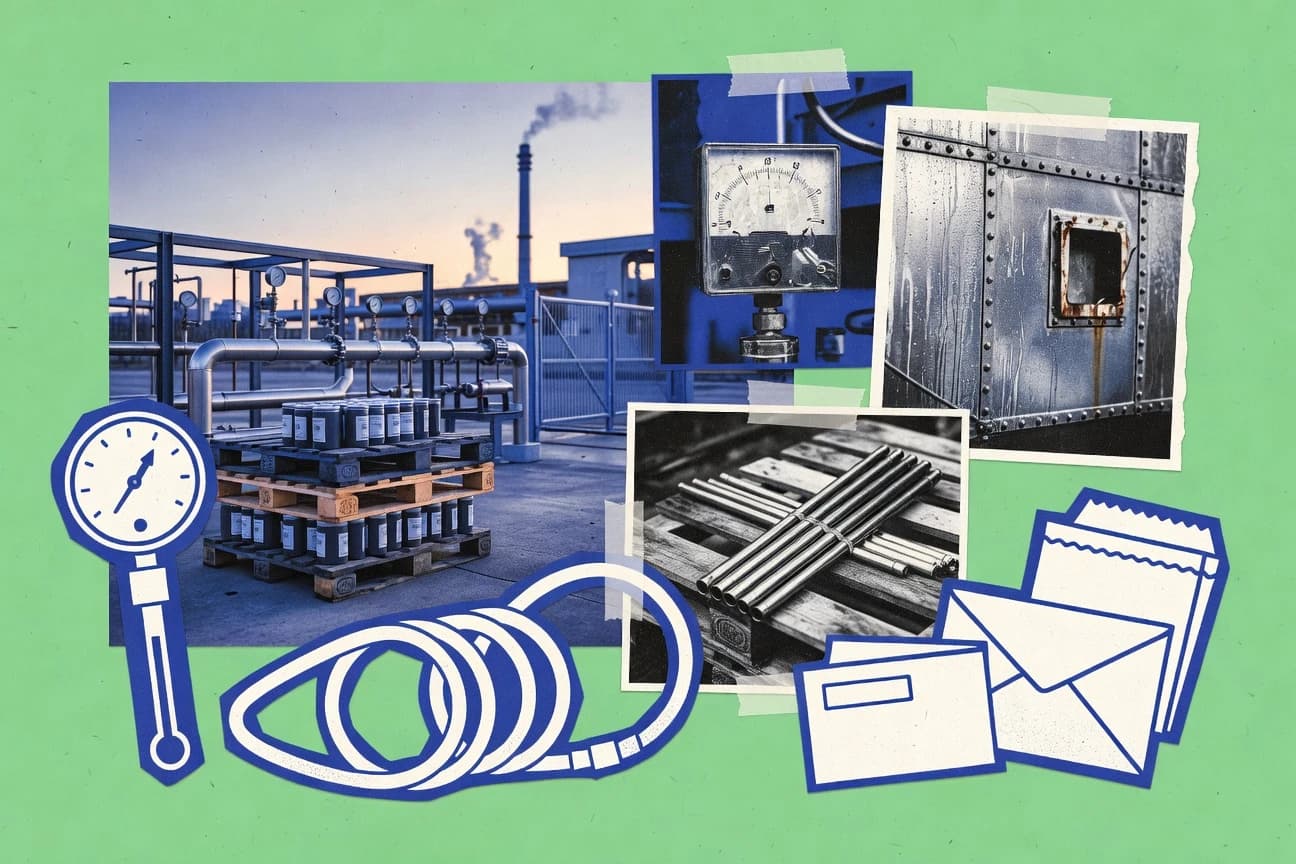
China Chemical Industry Statistics
China’s chemicals sector is tightening its grip on global supply chains while cutting energy use, with chemical industry energy intensity down 4.5% since 2016 through 2022 and the sector using 8.0% of national industrial natural gas in 2022. From 2025 linked capacity momentum to the -US$11.4 billion chemicals trade deficit in 2023, the page connects demand, capacity builds, and policy pressures like ultra-low emission retrofits to show what will shape output and costs next.
Catalyst Industry Statistics
Catalyst Industry’s stats map how regulation, metal prices, and performance science collide, with the global catalyst market topping about $15.5 billion in 2022 and automotive catalysts set to rise from $19.8 billion in 2023 to about $29.2 billion by 2028. You also get the practical constraints behind the growth, from SCR expansion (about $8.3 billion in 2022 to $14.5 billion by 2032) and FCC catalyst turnover and deactivation cycles to the surprising volatility of PGM supply costs that can swing with rhodium near $4,700 per ounce in 2023.
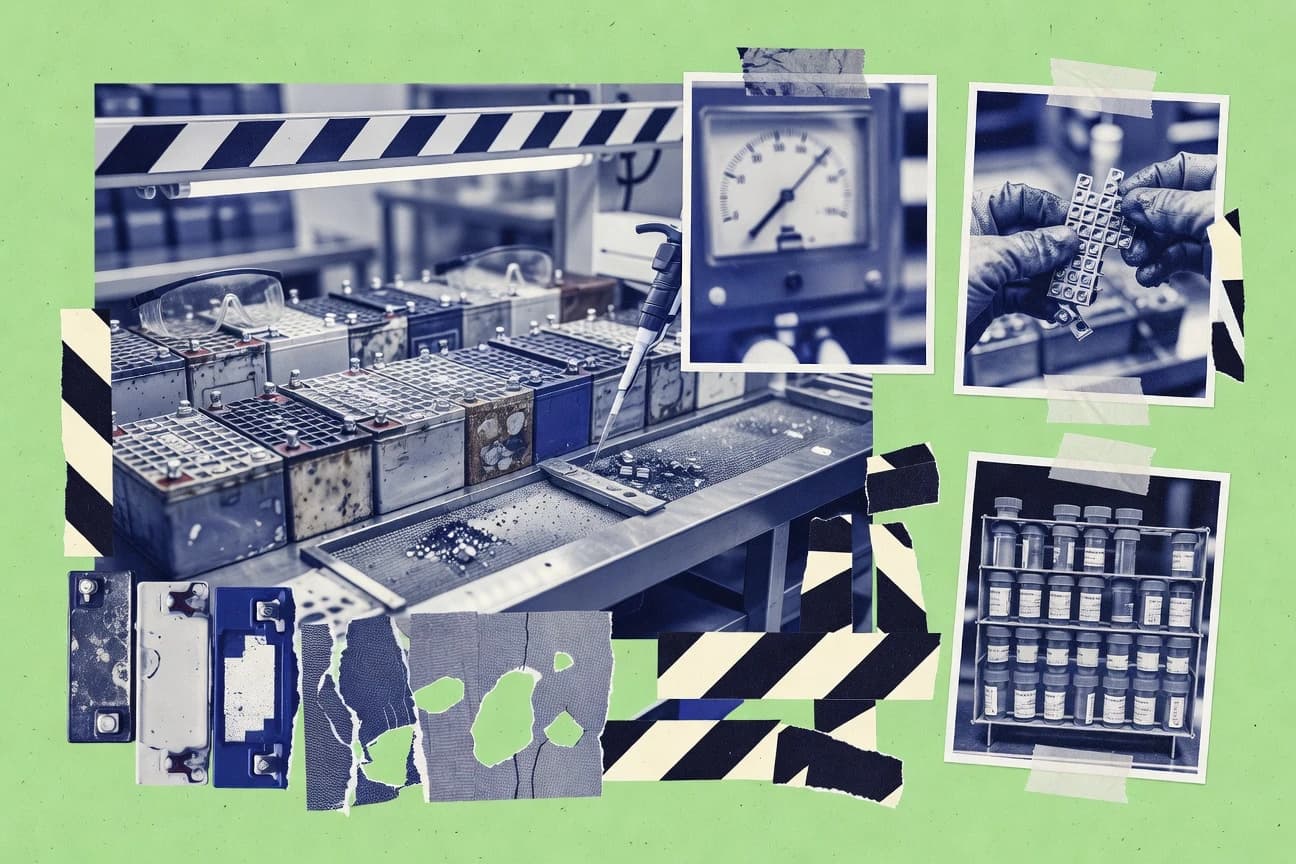
Exide Industry Statistics
Collections efficiency climbed to 6.0x in FY2023 while Exide’s network moves 1.2 million vehicles a day, even as lead volatility and recycling rules keep the supply chain under pressure. You will see how 42% recycled lead, a $11.4 billion recycling market growing to $29.7 billion by 2032, and EU recovery targets reshape costs and demand across UPS, passenger vehicles, and off grid solar.
Germany Chemicals Industry Statistics
Germany’s chemicals industry is starting to look different fast as 2025 figures point to sharper shifts in production activity, trade flows, and investment than the years before. Get the exact contrasts behind the headline totals so you can see where momentum is building and where it is stalling.
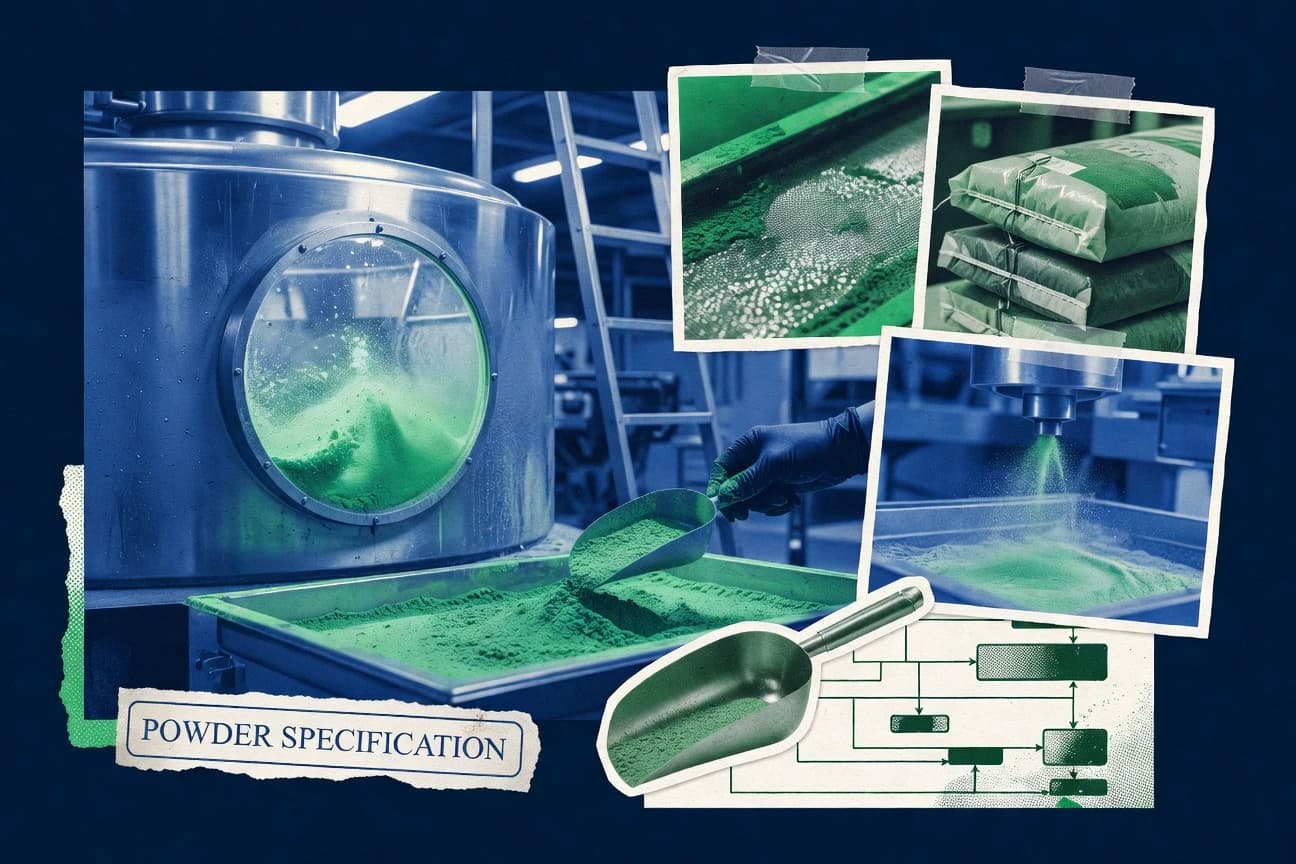
Pigment Industry Statistics
Pigment Industry’s latest statistics surface the shift that matters most right now, from accelerating production and demand to the pressures of pricing and supply. The 2025 figures make it clear where growth is coming from and which constraints are starting to bite harder.
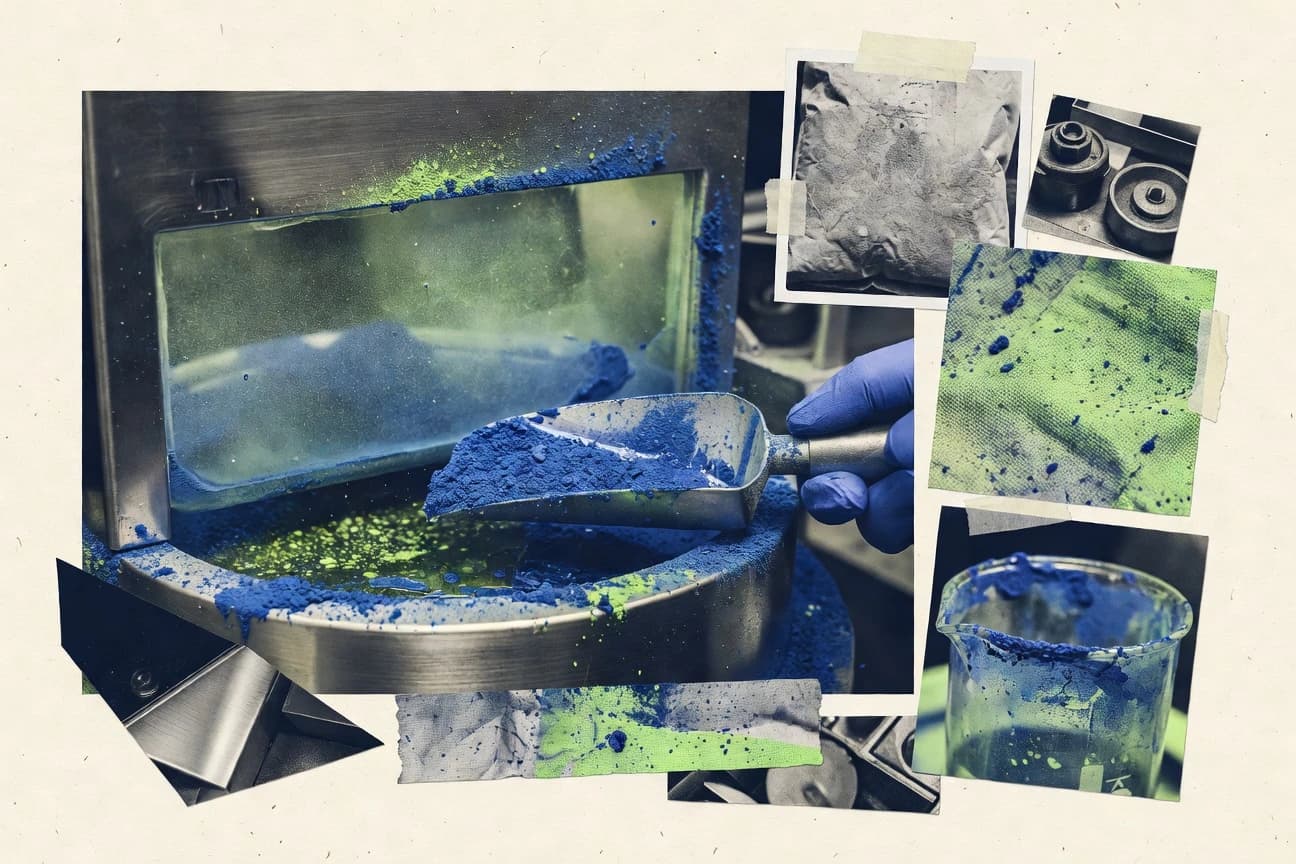
Pigments Industry Statistics
Pigments Industry’s latest statistics show a sharp shift as the market moves toward higher value color performance and greener feedstocks, with 2025 figures highlighting where demand is tightening and where expansion is accelerating. It’s a quick read for anyone tracking pricing pressure, supply reliability, and the momentum behind pigment innovation right now.

Adhesives Sealants Industry Statistics
With the global sealants market still scaling to US$1.6 billion in 2023, this page maps how hot melt and water based adhesives are meeting packaging demand while regulation keeps tightening, from REACH SVHC authorization and CLP hazard labeling to RoHS and the EU packaging waste rules. It also connects cost and compliance pressure to real inputs like energy and butadiene volatility and shows how performance standards such as ASTM C920, plus analytics adoption, are reshaping manufacturing yields and life cycle emissions.
Pvc Industry Statistics
See how the PVC industry’s momentum is reshaping the market, with 2026 production forecasts and trade shifts pointing to a notable swing in demand and sourcing priorities. If you track pricing pressure and supply reliability, these near term indicators will help you separate short term noise from the changes likely to stick.
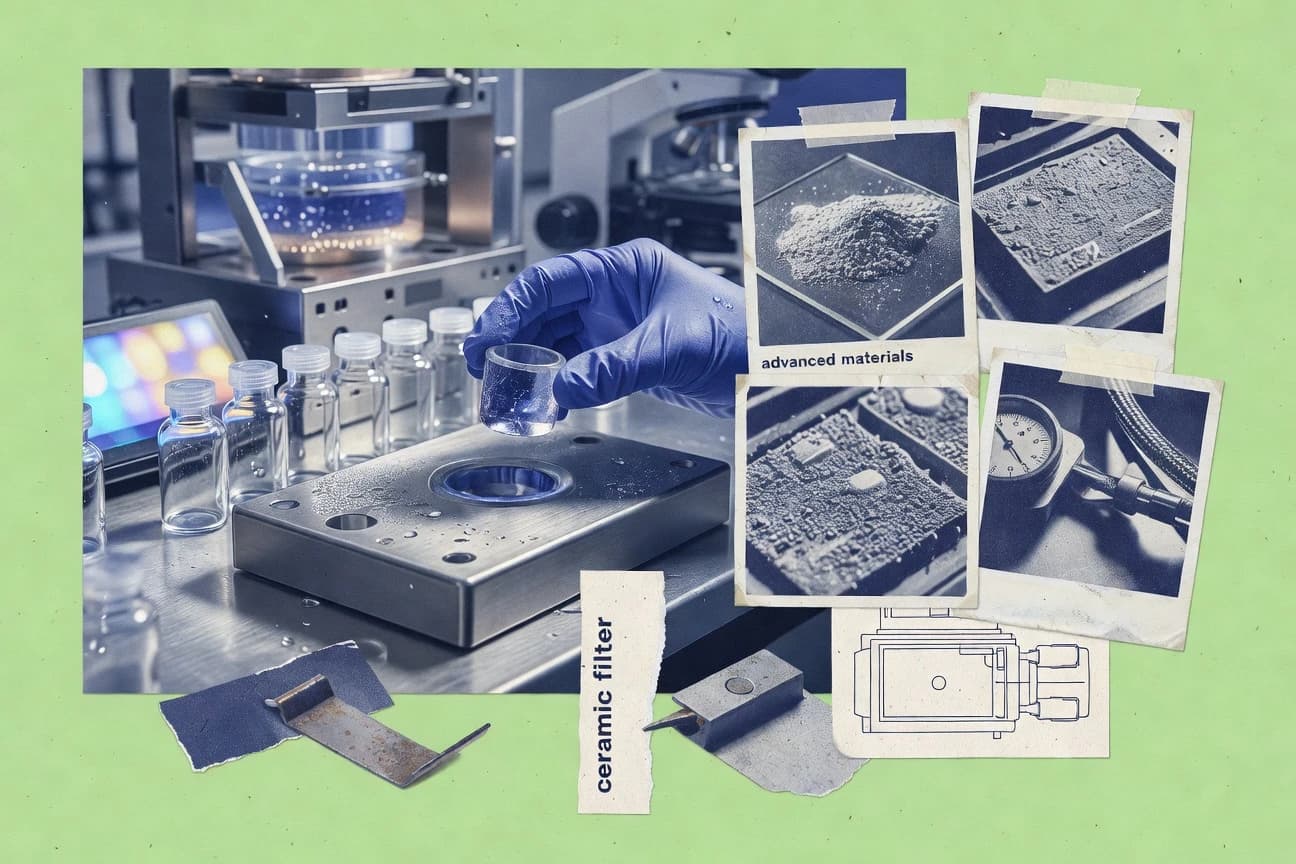
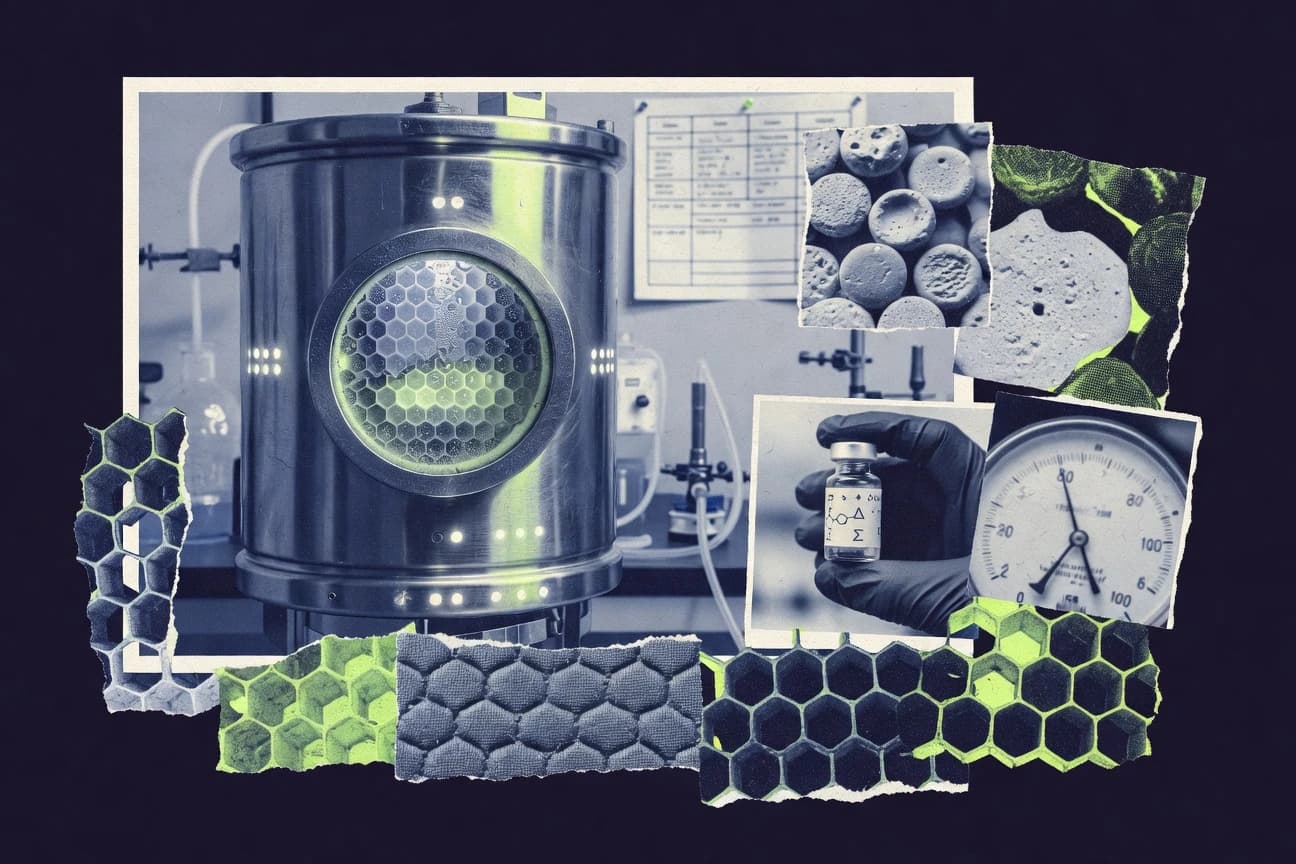
Advanced Materials Industry Statistics
Advanced materials are climbing fast, with the global advanced ceramics market forecast to grow at a 13.8% CAGR to about $65.5B by 2030, while specialty chemicals are set to nearly double to $1,014.0B and lithium-ion batteries rise from $41.5B in 2021 to $124.0B by 2030. But the real tension for manufacturers is supply and cost pressure, from a 3.2x jump in critical raw material demand to battery and clean energy regulations that force carbon footprint transparency and reshape where materials can be sourced and scaled.

Charcoal Industry Statistics
As charcoal producers push for cleaner output, the latest 2026 figures show how quickly production patterns and demand are shifting, not just rising in a straight line. This page distills the most telling numbers into one snapshot so you can see where charcoal’s growth is being pulled forward and where it is quietly stalling.

Aluminum Industry Statistics
Track how aluminum’s supply chain is shifting fast as 2026 production trends, recycling rates, and market demand collide, turning familiar assumptions into something more complicated. Get the key figures behind the momentum so you can spot where capacity, scrap supply, and pricing pressure are likely to land next.
Global Chemical Industry Statistics
Global Chemical Industry forecasts point to $5.4T in chemicals by 2029 alongside a fast rise in adjacent markets such as $265B chemical distribution and $122B chemical logistics by 2032, with China driving 11.0% of global chemical revenue in 2023. Expect the same page to pair big demand and transition signals like recycled plastics reaching 10 Mt by 2030 and hydrogen demand of 90 to 130 Mt by 2050 with practical pressure points from energy use, feedstock demand, and AI uptake in industrial analytics.