GITNUX MARKETDATA
Browse Our Category
Chemicals Industrial Materials
Latest update:

Turkey Plastics Industry Statistics
With Turkey’s plastics sector turning to 1.2% of GDP in 2022 and a 73% average line utilization in Q4 2022, the page puts production, demand, and capacity side by side with cost pressures and policy realities. You will see how plastics exports total 0.9 million tonnes in 2022 while the plastics trade balance lands at minus $2.1 billion, alongside 2023 unit price swings for key resins and machinery that help explain why capacity and employment do not always move together.

European Chemical Industry Statistics
Germany, France and Italy together exported €135.0 billion of chemicals in 2023 while EU state aid and funding for industrial decarbonisation reached €14.0 billion, and production momentum continues with the chemical industry index up 0.5% in 2024. The page also tracks the regulatory and operational squeeze behind the figures from REACH compliance checks and CLP classifications to MES driven OEE gains and heat integration retrofits that promise up to 20% less energy use.
Advanced Ceramics Industry Statistics
From power switches where SiC MOSFET share is projected to reach about 50% by 2030 to thermal insulation and data center heat loads that are forecast to push electricity use to around 1,000 TWh by 2026, this page connects demand, materials, and performance benchmarks across advanced ceramics. It also pairs production scale and cost pressure signals like a US electricity price of 11.6 cents per kWh in 2023 and a US annual import of $1.3 billion in rare earth materials in 2022, showing exactly what is accelerating growth and what is tightening margins for ceramic makers.

India Chemicals Industry Statistics
See how India’s chemicals sector balances growth with cost swings, from 97.9 MtCO2e greenhouse gas estimates tied to industrial processes to fertilizer and basic chemical output pressure that depends on volatile naphtha and LPG economics. With chemicals capacity, demand drivers, and labor and inflation inputs mapped together, the page puts 2023 signals like 7.0 percent GDP growth and 52.8 PMI expansion into one view to show where margin resilience is being tested.
Lubricant Industry Statistics
The global lubricants market is projected to top US$180.0 billion by 2032 while use phase losses waste up to 29% of the environmental impact, so the page connects growth in base oils and specialty segments with the hard tradeoffs of real operating conditions. You will also find the standards and regulations that shape every spec from ISO 9001 adoption to ASTM D445 test results, plus a practical contrast between rising demand drivers like shipping and machinery and the scale of evaporation and contamination.

Paints And Coatings Industry Statistics
At USD 1.02 trillion, the global coatings market is forecast to balloon by 2032 while growth rates keep accelerating across protective, marine, and powder segments, including a 6.0% CAGR for industrial coatings through 2030. You will also see how VOC rules, salt spray and adhesion test standards, and shifting HS 3208 trade values are shaping demand, supply, and compliance from the EU Ecolabel to US EPA Safer Choice.
Synthetic Rubber Industry Statistics
With the synthetic rubber market projected to reach US$5.0 billion by 2030 and synthetic rubber covering about 43% of global rubber consumption by volume, this page connects demand growth to the supply chain constraints that actually move prices. You get the full feedstock and trade pressure picture, from ethylene and butadiene supply drivers to 2023 EV and tire trends, plus the chemistry and compliance factors that reshape production costs and end market performance.
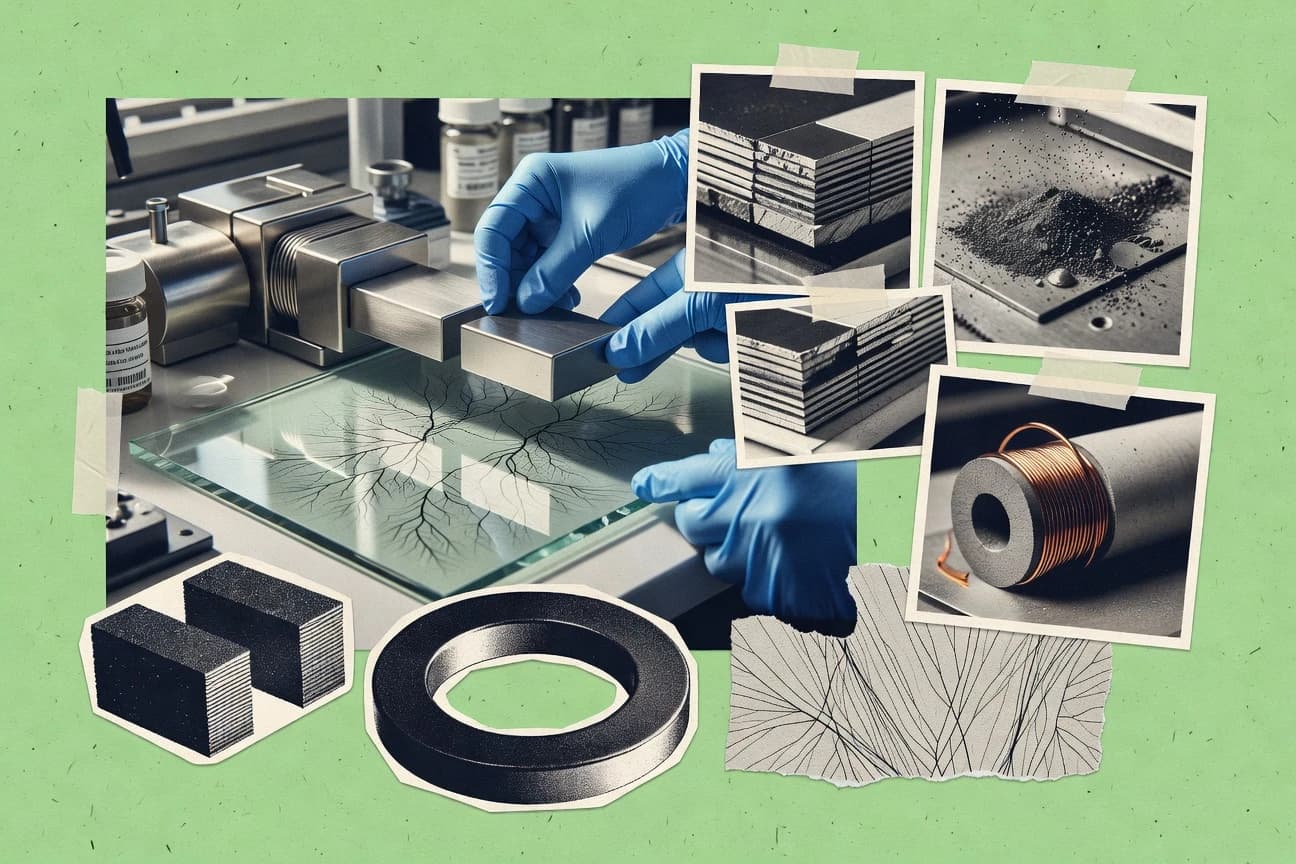
Magnetic Materials Industry Statistics
Permanent magnets are riding electrification with 3.0% year over year growth in the global permanent magnets market from 2022 to 2023, while the IEA says recycling could cut primary critical mineral demand by 15% to 25% by 2040. This page connects those macro shifts to the real magnet shop, from rare earth recovery rates above 90% to cost and performance tradeoffs that decide when dysprosium can be reduced and when NdFeB recycling becomes cost competitive.
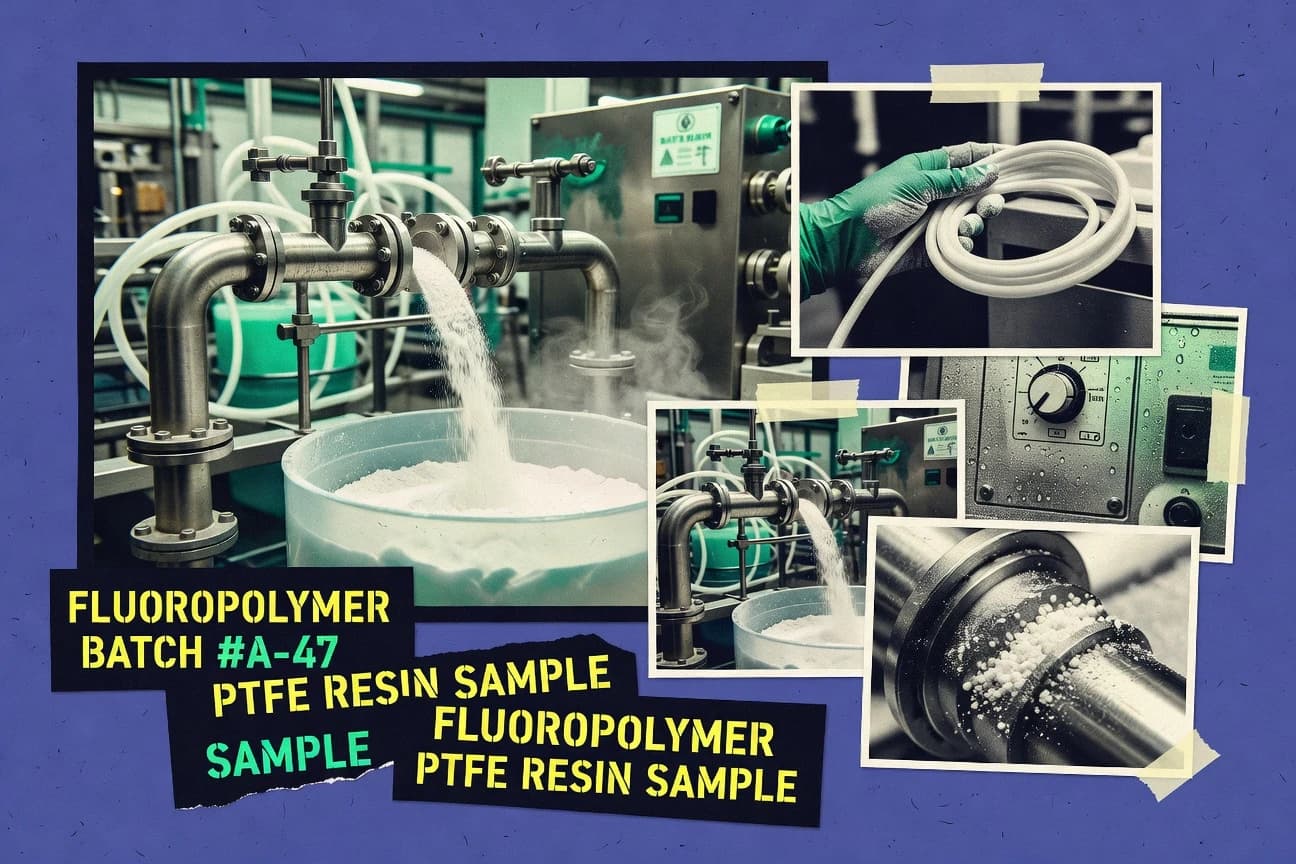
Fluoropolymer Industry Statistics
Asia Pacific is forecast to be the fastest growing region for fluoropolymers as the U.S. market sits at about 0.7 billion kg in 2023, while PVDF grows at 5.5% CAGR to 2032 and PTFE, FEP, and PVDF forecasts diverge sharply enough to reshape supply planning. Property and compliance pressure meet there too, with PTFE nearly chemically inert and hydrophobic at about 110°–120° water contact angle, yet energy intensive production and EU fluorinated gas regulation make cost and sustainability tradeoffs impossible to ignore.
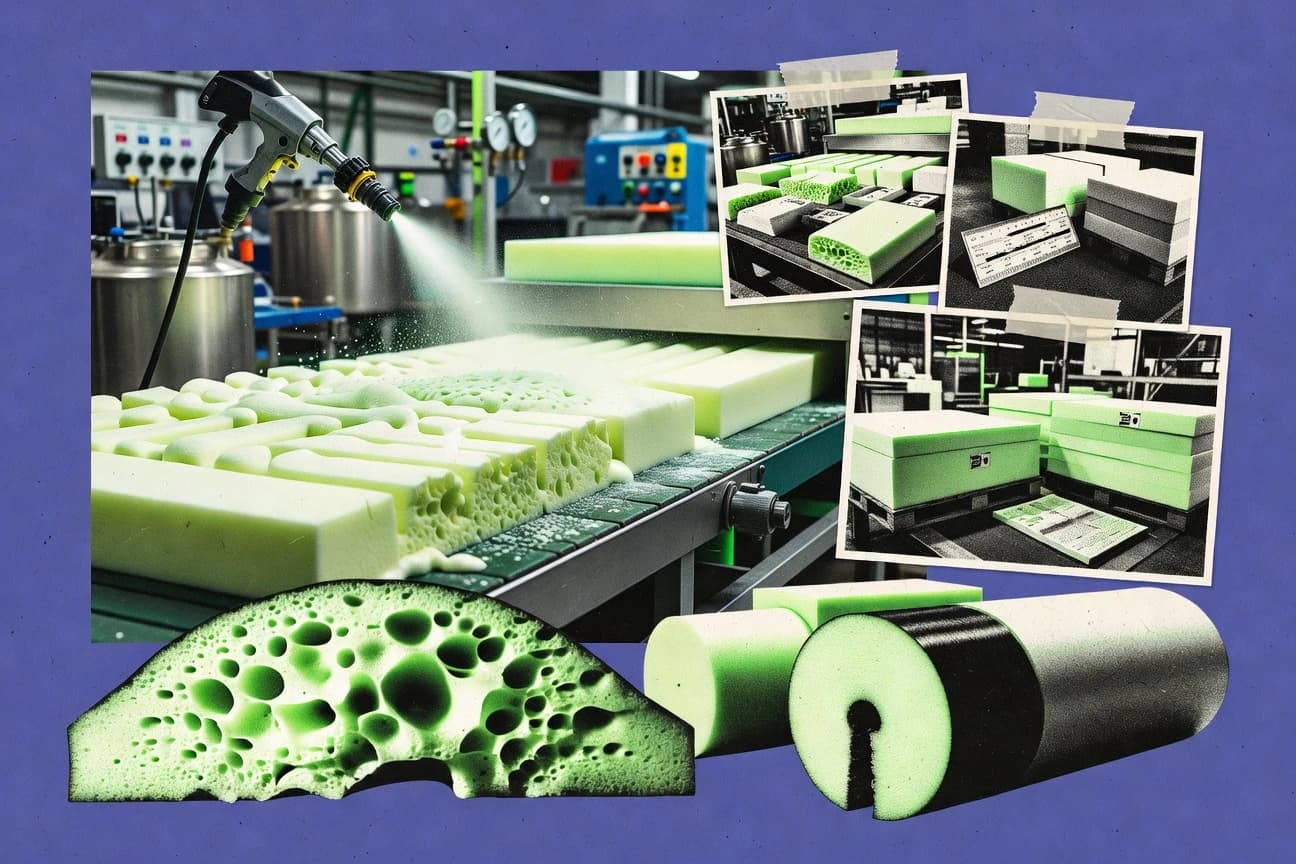
Polyurethane Foam Industry Statistics
Rigid polyurethane foam’s role is bigger than insulation alone since it anchors about 60% of rigid PU demand for building insulation while forecast growth lifts spray polyurethane foam CAGR to 5.4% for 2024 to 2032. What makes the page worth your time is the tight regulatory and performance tradeoffs behind everyday specs like thermal conductivity near 0.020 to 0.028 W/m K and exposure limits for TDI and MDI at 0.005 ppm, plus how compliance from EU REACH and U.S. TSCA shapes what can be produced and installed.

Fiberglass Industry Statistics
With the US producing 2.7 billion pounds of fiberglass in 2023 and the global fiberglass market reaching $20.1 billion for FRP in 2023, this page puts upstream scale and downstream demand side by side. It also flags what is changing fastest through 2030, from wind and EV lightweighting to recycled feedstock and corrosion driven infrastructure repair, alongside practical performance benchmarks like E glass thermal conductivity, strength retention, and insulation R value targets.

Fiberglass Composites Industry Statistics
Transportation still takes the largest share at 35% while wind blades are locking in 70% fiberglass by volume in 15 MW turbines, pushing demand toward 1.2 million tons a year by 2030. From 95% fiberglass dominance in asphalt roofing to 85% of boat hull production and 500 kV+ electrical insulators climbing 20% YoY, this page connects end use to production realities so you can see where growth is coming from right now.

Abrasives Industry Statistics
Global abrasives are projected to climb from $28.3 billion in 2023 to $40.2 billion by 2030, with 5.3% CAGR, but the real pull for operators is how process tuning and smarter grits can reshape outcomes from surface roughness to grinding energy demand. You will also see why advanced dust control, grit recycling, and coated abrasive formulation choices are turning costs, emissions, and wear rates into measurable levers rather than fixed overhead.
Hydrogen Peroxide Industry Statistics
Hydrogen peroxide demand is set to rise at a 6.0% CAGR over 2024 to 2032, even as its hazard driven handling rules force tighter controls from storage to transport. Trade flows also reveal the scale, with global HS 284700 imports reaching about 1.1 million tonnes in 2022 and wastewater and AOP use pushing oxidant value growth alongside major industrial consumption.
Japan Chemicals Industry Statistics
Japan Chemicals Industry, still employing 412,000 workers in FY2022 while output climbs to 112.4 million tons, shows a surprising split between growing petrochemical demand and thinner headcounts across several specialty segments. A single page brings together production by major feedstocks and end markets, 12.8 trillion yen of chemical exports with China as the top pull, and the R&D race, including 12,500 chemical patents filed FY2022 and 1.42 trillion yen in total industry research spending.
South Korea Chemical Industry Statistics
South Korea’s chemical industry spans 180 trillion won in sales and 57.2 million tons of petrochemical output, but the real tension is how 8.2 percent of manufacturing employment share sits alongside rising R and D intensity that reached 15.2 trillion won in 2022. You will also see where the money goes from basic chemicals at 81 trillion won to specialty chemical growth, plus the production and export shifts that keep batteries and OLED materials pushing the frontier.

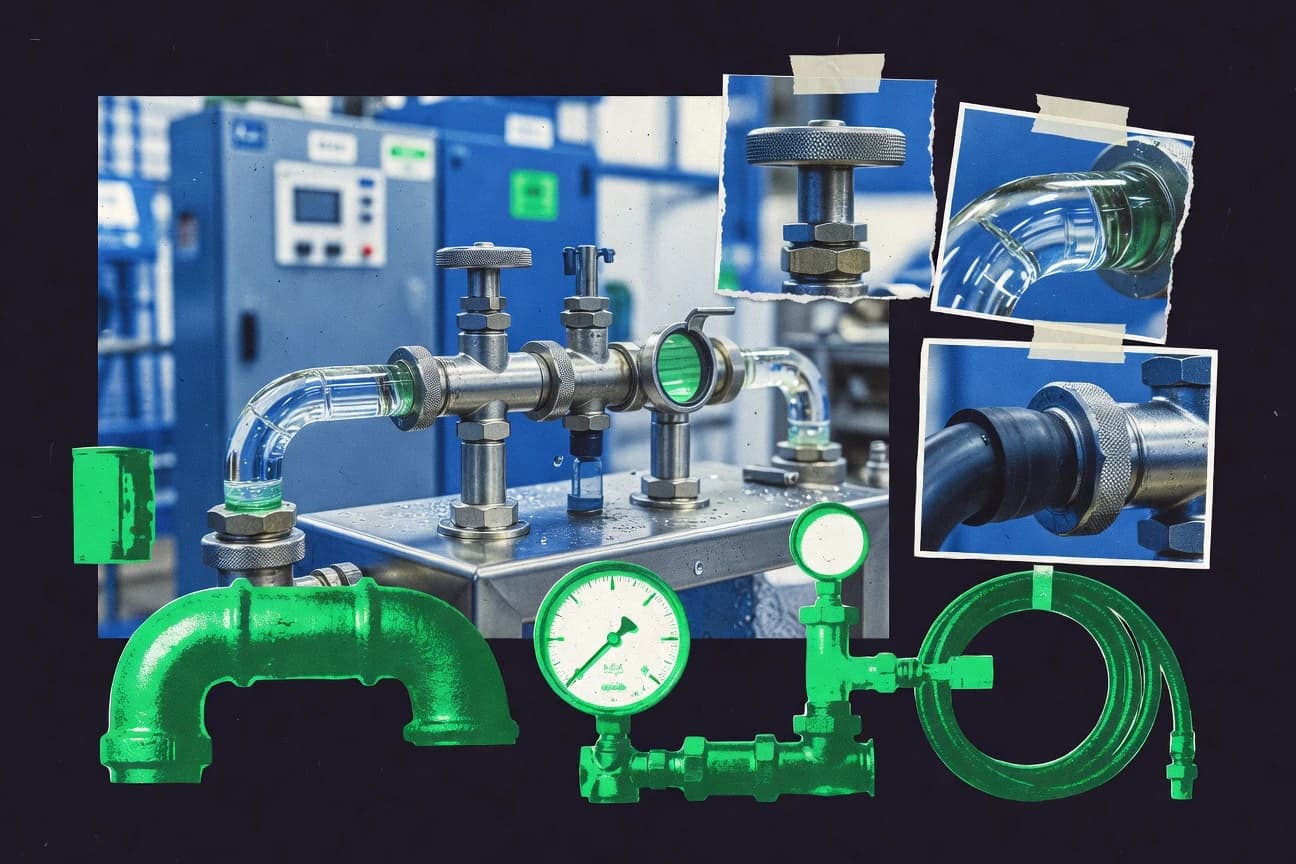
Power Cable Industry Statistics
Power Cable Industry’s statistics page maps how the market is accelerating toward USD 250 billion by 2032, with sustainability moving from promise to practice like EU tenders demanding recycled content and recycling rates hitting 75% in Scandinavia in 2023. Track what is actually changing on the ground too, from underground cables taking 58% share and XLPE dominating high voltage to factory automation lifting output by 18% and smart grid investments reaching USD 10.2 billion in 2023.

Polycarbonate Industry Statistics
Even as the global polycarbonate market is forecast to climb from $10.7 billion in 2030, the pressure is shifting from raw resin growth to end of life outcomes, with EU recycling targets like 45% of plastic packaging waste recycled in 2021 shaping what happens to PC after use. The page ties production, feedstock and optical performance facts to the real constraint operators now face, including how recycling routes can cut molecular weight or better restore properties, and why regulation around BPA and producer responsibility is starting to steer material choices.
Chemical Industry Statistics
The chemical business is billed at a massive $1,114.4 billion global market size for 2024, yet its pressure points are just as stark. Expect the page to connect plastics demand, energy use and CO2 responsibility, volatile producer margins, and the regulatory burden from REACH to CBAM, alongside the sustainability reality that only 9% of plastic waste is recycled worldwide.

Flavors Fragrances Industry Statistics
The flavors and fragrances supply chain is heading toward a $66.6 billion global market by 2032 while fragrance ingredient demand still wrestles with raw material volatility, compliance pressure, and end use concentration. One of the most telling contrasts is how sustainability and safety rules are tightening selection at every step, from ECHA restrictions and harmonized hazard classifications to EU allergen labeling thresholds and REACH registration, even as buyers chase faster, more naturally derived growth at 7 percent plus for natural flavors.