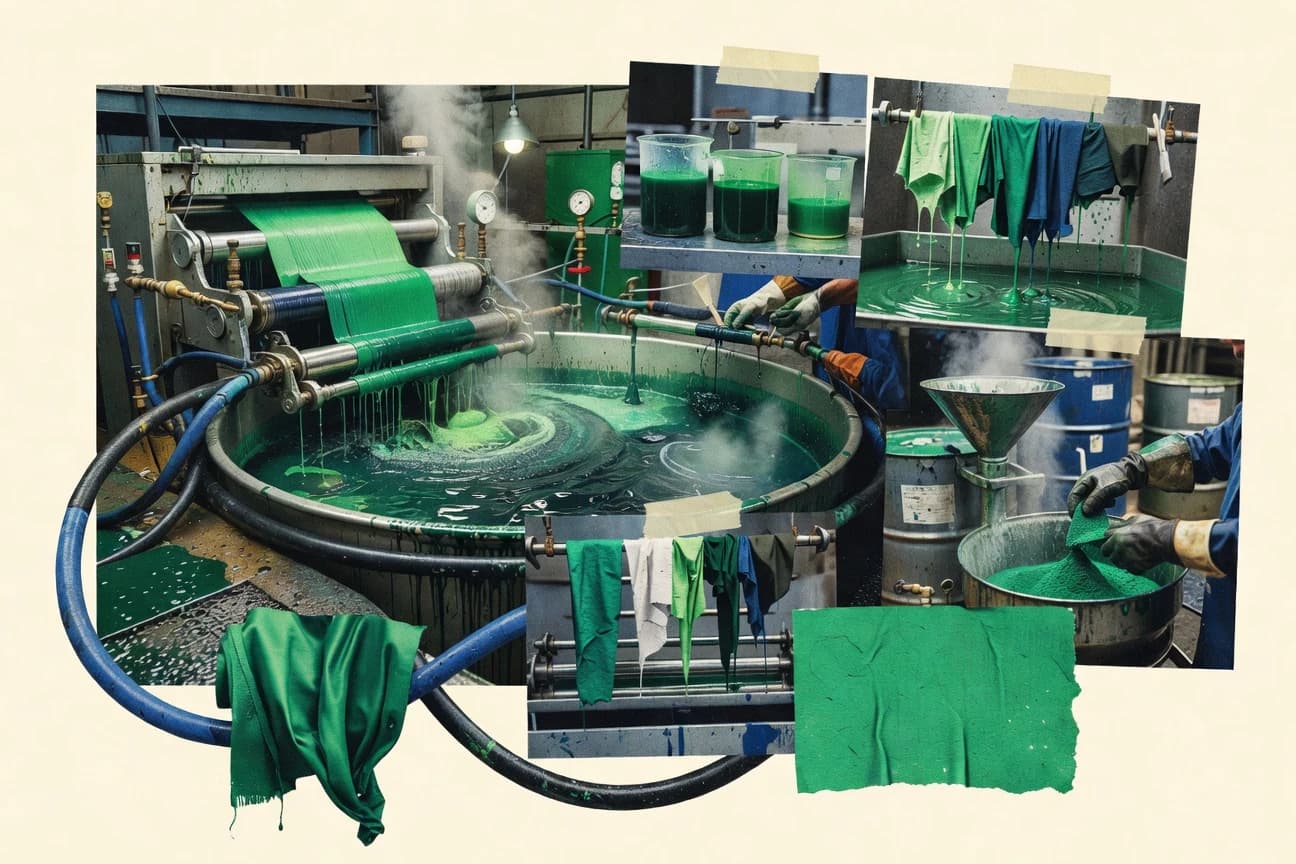

The dye industry supports clothing, packaging, and household textiles across major manufacturing hubs. Yet the biggest environmental and health concerns often emerge where textile wastewater is discharged and treatment capacity varies. This page connects regulatory pressure—such as EU REACH SVHC and priority substances in the Water Framework Directive—to measurable improvements in effluent quality. You’ll also see how advanced oxidation, membrane bioreactors, and activated-carbon adsorption reduce color and chemical load.
Key Takeaways
- 1.2 million metric tons of dye produced in China in 2022
- 3.9 million metric tons of dyes were produced globally in 2022 (industry estimate reported by ChemicalBook based on published production data)
- The global dyes and pigments market was valued at USD 34.1 billion in 2023
- The EU REACH regulation identifies substances of very high concern (SVHC) and requires authorization; the number of SVHC on the candidate list exceeded 240 (as of 2024 candidate list count)
- ECHA’s candidate list has included 241 substances as of the latest table update shown
- The EU Ecolabel for textile products includes requirements covering use of dangerous substances and limit values for certain dyeing agents (numeric limit values stated in the criteria set)
- Dye pollution in wastewater is commonly measured by color in Pt-Co units; an educational reference cites typical raw wastewater color values in the hundreds to thousands of Pt-Co units (numeric measurement context)
- Advanced oxidation processes can achieve >90% decolorization of textile dyes under optimized conditions (numeric decolorization performance stated in review literature)
- Membrane bioreactors have been reported to achieve COD removal efficiencies of 60–90% for textile wastewater in multiple studies (numeric performance range)
In 2022 China led with 1.2 million tons of dye output as markets grow, while cleaner technologies and tighter EU rules reduce pollution.
Related reading
01 · Category
Market Size30 stats
01
1.2 million metric tons of dye produced in China in 2022https://www.chemicalbook.com/ChemicalProductProperty_EN_CB448131.htm
02
3.9 million metric tons of dyes were produced globally in 2022 (industry estimate reported by ChemicalBook based on published production data)https://www.chemicalbook.com/Article/Dye-Production-Industry-Report.htm
03
The global dyes and pigments market was valued at USD 34.1 billion in 2023https://www.precedenceresearch.com/dyes-and-pigments-market
04
The dyes and pigments market is projected to reach USD 55.3 billion by 2033https://www.precedenceresearch.com/dyes-and-pigments-market
05
The dyes and pigments market forecast implies a 5.0% CAGR for 2024–2033https://www.precedenceresearch.com/dyes-and-pigments-market
06
The global textile dyeing and finishing chemicals market was valued at USD 15.3 billion in 2023https://www.precedenceresearch.com/textile-dyeing-and-finishing-chemicals-market
07
The textile dyeing and finishing chemicals market is projected to reach USD 24.6 billion by 2033https://www.precedenceresearch.com/textile-dyeing-and-finishing-chemicals-market
08
The textile dyeing and finishing chemicals market forecast implies a 5.0% CAGR for 2024–2033https://www.precedenceresearch.com/textile-dyeing-and-finishing-chemicals-market
09
The global vat dyes market was valued at about USD 2.2 billion in 2023https://www.precedenceresearch.com/vat-dyes-market
10
The vat dyes market is projected to reach USD 3.5 billion by 2033https://www.precedenceresearch.com/vat-dyes-market
11
The vat dyes market forecast implies a 4.8% CAGR for 2024–2033https://www.precedenceresearch.com/vat-dyes-market
12
The global disperse dyes market was valued at about USD 5.4 billion in 2023https://www.precedenceresearch.com/disperse-dyes-market
13
The disperse dyes market is projected to reach USD 8.6 billion by 2033https://www.precedenceresearch.com/disperse-dyes-market
14
The disperse dyes market forecast implies a 5.0% CAGR for 2024–2033https://www.precedenceresearch.com/disperse-dyes-market
15
The global reactive dyes market was valued at about USD 6.7 billion in 2023https://www.precedenceresearch.com/reactive-dyes-market
16
The reactive dyes market is projected to reach USD 10.8 billion by 2033https://www.precedenceresearch.com/reactive-dyes-market
17
The reactive dyes market forecast implies a 5.1% CAGR for 2024–2033https://www.precedenceresearch.com/reactive-dyes-market
18
The global sulfur dyes market was valued at about USD 1.6 billion in 2023https://www.precedenceresearch.com/sulfur-dyes-market
19
The sulfur dyes market is projected to reach USD 2.5 billion by 2033https://www.precedenceresearch.com/sulfur-dyes-market
20
The sulfur dyes market forecast implies a 4.9% CAGR for 2024–2033https://www.precedenceresearch.com/sulfur-dyes-market
21
The global pigments and dyes market in the printing sector was valued at USD 2.9 billion in 2022https://www.globenewswire.com/news-release/2024/02/13/2823616/0/en/Ink-Printing-Dyes-Pigments-Market-Size-to-Reach-USD-5-4-Billion-by-2032-Allied-Market-Research.html
22
The same printing-sector inks dyes and pigments market is projected to reach USD 5.4 billion by 2032https://www.globenewswire.com/news-release/2024/02/13/2823616/0/en/Ink-Printing-Dyes-Pigments-Market-Size-to-Reach-USD-5-4-Billion-by-2032-Allied-Market-Research.html
23
Reactive dyes represented a 2022 market size of USD 3.2 billion in one segmental forecast (reactive dyes, by application)https://www.globenewswire.com/news-release/2024/02/13/2823616/0/en/Ink-Printing-Dyes-Pigments-Market-Size-to-Reach-USD-5-4-Billion-by-2032-Allied-Market-Research.html
24
Textiles were the largest end-use of dyes (share reported as 60% in 2023 by a market study summary)https://www.fortunebusinessinsights.com/industry-reports/dyes-market-100547
25
North America held about 20% share of the dyes market in 2023 (market study summary)https://www.fortunebusinessinsights.com/industry-reports/dyes-market-100547
26
Europe held about 25% share of the dyes market in 2023 (market study summary)https://www.fortunebusinessinsights.com/industry-reports/dyes-market-100547
27
Asia Pacific held about 45% share of the dyes market in 2023 (market study summary)https://www.fortunebusinessinsights.com/industry-reports/dyes-market-100547
28
The dyes market was estimated at USD 20.8 billion in 2022 (industry estimate page)https://www.fortunebusinessinsights.com/industry-reports/dyes-market-100547
29
The dyes market is projected to reach USD 28.6 billion by 2032 (industry estimate page)https://www.fortunebusinessinsights.com/industry-reports/dyes-market-100547
30
The dyes market forecast implies a 3.2% CAGR over 2024–2032 (industry estimate page)https://www.fortunebusinessinsights.com/industry-reports/dyes-market-100547
Interpretation
Market Size Interpretation
The market size data shows strong growth potential, with the global dyes and pigments market rising from USD 34.1 billion in 2023 to a projected USD 55.3 billion by 2033 at a 5.0% CAGR, while production is already substantial at 3.9 million metric tons globally in 2022.
report visual · Comparison
Global dyes & pigments market size (2023 vs. 2033)
The global dyes and pigments market is forecast to grow from the 2023 base of $34.1B to a 2033 value of $55.3B—an upward shift led by the overall market’s expansion over the decade
$55.3 billion — global dyes and pigments market forecast value in 2033$55.3 billion
$34.1 billion — global dyes and pigments market value in 2023
$34.1 billion
$2.2 billion — global vat dyes market value in 2023
$2.2 billion
source-verifiedfortunebusinessinsights.com2033
02 · Category
Industry Trends17 stats
01
The EU REACH regulation identifies substances of very high concern (SVHC) and requires authorization; the number of SVHC on the candidate list exceeded 240 (as of 2024 candidate list count)https://echa.europa.eu/candidate-list-table
02
ECHA’s candidate list has included 241 substances as of the latest table update shownhttps://echa.europa.eu/candidate-list-table
03
The EU Ecolabel for textile products includes requirements covering use of dangerous substances and limit values for certain dyeing agents (numeric limit values stated in the criteria set)https://eur-lex.europa.eu/legal-content/EN/TXT/?uri=uriserv:OJ.L_.2022.035.01.0001.01.ENG&toc=OJ:L:2022:035:TOC
04
The EU Water Framework Directive uses priority substances; the number of priority substances listed is 45 (list as per Directive 2013/39/EU)https://eur-lex.europa.eu/eli/dir/2013/39/oj
05
Directive 2010/75/EU (Industrial Emissions Directive) sets an EU-wide framework for controlling industrial pollution from listed activities, including chemical manufacturing and surface treatment (the directive is numbered as 2010/75/EU)https://eur-lex.europa.eu/eli/dir/2010/75/oj
06
RoHS 2 (Directive 2011/65/EU) restricts hazardous substances and includes a limit of 0.1% by weight for certain restricted substances (general restriction threshold in directive)https://eur-lex.europa.eu/eli/dir/2011/65/2019-07-22
07
The EU’s Annex XVII under REACH contains entries that set specific concentration thresholds (e.g., 0.1% for certain CMR substances) for restriction implementationhttps://echa.europa.eu/substances-restricted-under-reach
08
UN GHS has 6 hazard categories for health and 2 categories for physical hazards (numeric count of hazard classes in GHS framework)https://unece.org/transport/dangerous-goods/ghs-revised-6th-edition
09
The Basel Convention includes 9 categories for wastes and sets control procedures for hazardous waste transboundary movement (numeric reference: Annex I categories)https://www.basel.int/TheConvention/Overview/tabid/1279/Default.aspx
10
The Stockholm Convention lists 26 persistent organic pollutants (numeric count as listed on convention page)https://www.pops.int/TheConvention/ThePOPs/tabid/2512/Default.aspx
11
The EU ECHA SVHC authorization applies to substances on the candidate list; the numeric threshold for REACH authorization triggers is listing status rather than concentration (authorization requirement begins upon inclusion in the candidate list and specific thresholds for duty to communicate apply per REACH Article 33)https://echa.europa.eu/regulations/reach/svhc-identification-explained
12
REACH Article 7 requires registration for substances manufactured/imported at or above 1 tonne per year (numeric threshold)https://eur-lex.europa.eu/eli/reg/2006/1907/oj
13
REACH Article 14/15 includes 0.1% w/w as a threshold for certain communication requirements for SVHC in articles (numeric threshold)https://eur-lex.europa.eu/eli/reg/2006/1907/oj
14
The EU REACH registration requires higher data richness at ≥10 tonnes/year of substance (numeric threshold for dossier update)https://echa.europa.eu/registration/registration-process/information-requirements
15
In dye-sensitized solar cells, the use of ruthenium-based dyes reached certified efficiencies of about 11–12% (numeric benchmark for dye compounds, comparable performance context)https://www.nrel.gov/pv/cell-efficiency.html
16
The NREL best research-cell efficiency chart lists dye-sensitized cells at around 13% (latest chart value shown for DSSCs)https://www.nrel.gov/pv/cell-efficiency.html
17
The EU Ecolabel criteria for textiles specify that the minimum requirements cover chemical parameters with numeric limit values for hazardous substances in treated articles (numeric limit values stated in the legal criteria text)https://eur-lex.europa.eu/legal-content/EN/TXT/?uri=uriserv:OJ.L_.2022.035.01.0001.01.ENG&toc=OJ:L:2022:035:TOC
Interpretation
Industry Trends Interpretation
Under the Industry Trends lens, tightening EU regulation is clearly accelerating for the dye sector, with ECHA’s candidate list growing to 241 SVHC substances and the EU also maintaining 45 priority water pollutants alongside broader controls like the Industrial Emissions Directive and substance limits under RoHS 2.
More related reading
03 · Category
Performance Metrics24 stats
01
Dye pollution in wastewater is commonly measured by color in Pt-Co units; an educational reference cites typical raw wastewater color values in the hundreds to thousands of Pt-Co units (numeric measurement context)https://www.sciencedirect.com/topics/engineering/dye-wastewater-treatment
02
Advanced oxidation processes can achieve >90% decolorization of textile dyes under optimized conditions (numeric decolorization performance stated in review literature)https://www.sciencedirect.com/science/article/pii/S0045653520304566
03
Membrane bioreactors have been reported to achieve COD removal efficiencies of 60–90% for textile wastewater in multiple studies (numeric performance range)https://www.sciencedirect.com/science/article/pii/S0045653520304566
04
Adsorption using activated carbon can remove reactive dyes with reported efficiencies typically between 70% and 99% (numeric range in review literature)https://www.sciencedirect.com/topics/engineering/adsorption-of-dyes-activated-carbon
05
Coagulation/flocculation processes have been reported to remove 50–90% of color from dye wastewater depending on coagulant dosage and pH (numeric range)https://www.sciencedirect.com/topics/engineering/dye-wastewater-treatment
06
Ozonation has been reported to achieve 80–99% decolorization of textile dyes in laboratory/bench studies (numeric range)https://www.sciencedirect.com/topics/engineering/dye-wastewater-treatment
07
Photocatalysis with TiO2 can achieve around 60–95% dye degradation under UV/visible conditions (numeric range reported in reviews)https://www.sciencedirect.com/topics/engineering/photocatalytic-degradation
08
Fenton oxidation has been reported to degrade textile dyes with efficiencies often in the 70–98% range for color removal (numeric range)https://www.sciencedirect.com/topics/chemistry/fenton-process
09
Reverse osmosis can achieve near-complete removal of dissolved dyes, often reported as 95–99% rejection for dye molecules in textile effluent (numeric rejection range)https://www.sciencedirect.com/topics/engineering/reverse-osmosis
10
Electrocoagulation studies report color removal efficiencies typically between 60% and 98% for dye-laden water (numeric range)https://www.sciencedirect.com/topics/engineering/electrocoagulation
11
Electrooxidation can reduce COD by 40–90% depending on current density and supporting electrolyte concentration (numeric range)https://www.sciencedirect.com/topics/engineering/electrooxidation
12
Biological treatment alone often achieves only 20–60% decolorization for many dye classes without pretreatment (numeric range)https://www.sciencedirect.com/topics/engineering/dye-wastewater-treatment
13
Enzyme-based decolorization (e.g., laccase) has been reported to achieve 70–95% decolorization for certain dyes under optimized conditions (numeric range)https://www.sciencedirect.com/topics/engineering/laccase
14
Biosorption of dyes by microorganisms or biomass has been reported with 50–95% removal efficiencies (numeric range)https://www.sciencedirect.com/topics/engineering/biosorption-of-dyes
15
Thermally activated persulfate oxidation can report >90% removal of dyes in lab studies at sufficiently high persulfate doses (numeric performance threshold)https://www.sciencedirect.com/science/article/pii/S0045653520304566
16
Ultrafiltration typically achieves high removal of colorants at >90% rejection for larger dye-associate species depending on membrane cut-off (numeric rejection threshold)https://www.sciencedirect.com/topics/engineering/ultrafiltration
17
Dye application efficiencies (fraction of dye fixed on fiber) are often in the range of 60–90% depending on dye-fiber affinity and process control (numeric range reported in textiles literature)https://www.tandfonline.com/doi/abs/10.1080/03602559.2014.882784
18
High-temperature exhaust dyeing processes use dye bath temperatures typically around 80–130°C depending on fiber (numeric process parameter)https://www.sciencedirect.com/topics/engineering/exhaust-dyeing
19
Batch dyeing typically uses dye liquor ratios between 1:5 and 1:20 (numeric liquor ratio range described in textile processing references)https://www.sciencedirect.com/topics/engineering/dyeing
20
Reactive dyeing processes often require salt dosing; typical NaCl addition is around 20–80 g/L depending on dye and shade (numeric dosing range in textile dyeing references)https://www.sciencedirect.com/topics/engineering/reactive-dyes
21
Textile wastewater color can be measured as absorbance; studies report absorbance (e.g., 465 nm) values in the order of 0.5–5 AU for raw dye wastewater (numeric measurement range in studies)https://www.sciencedirect.com/science/article/pii/S0045653517302609
22
Textile wastewater COD values commonly range from 1000 to 5000 mg/L in untreated dyeing effluents (numeric range reported in environmental engineering literature)https://www.sciencedirect.com/topics/engineering/textile-wastewater
23
Textile wastewater BOD5 values commonly range from 200 to 2000 mg/L (numeric range reported in wastewater references)https://www.sciencedirect.com/topics/engineering/textile-wastewater
24
AOX (adsorbable organic halides) levels in textile effluent can reach tens to hundreds of µg/L depending on dyeing chemistry (numeric range reported in literature summaries)https://www.sciencedirect.com/topics/engineering/aox
Interpretation
Performance Metrics Interpretation
Across key performance metrics for dye wastewater treatment, decolorization and pollutant removal consistently show high effectiveness, with many advanced methods reaching roughly 80% to 99% decolorization and adsorption or oxidation commonly hitting in the 70% to over 90% range while membrane bioreactors report about 60% to 90% COD removal.
Reference
Cite This Report
This report is designed to be cited. We maintain stable URLs and versioned verification dates. Copy the format appropriate for your publication below.
APA
Julian Richter. (2026, February 13). Dye Industry Statistics. Gitnux. https://gitnux.org/dye-industry-statistics
MLA
Julian Richter. "Dye Industry Statistics." Gitnux, 13 Feb 2026, https://gitnux.org/dye-industry-statistics.
Chicago
Julian Richter. 2026. "Dye Industry Statistics." Gitnux. https://gitnux.org/dye-industry-statistics.
Sources & references
41 datasets cited across this report
+27 additional datasets cited (not shown individually)