GITNUX MARKETDATA
Browse Our Category
Chemicals Industrial Materials
Latest update:

Germany Chemical Industry Statistics
Germany’s chemical industry delivers 6.5% of GDP strength in 2022, yet its ripple effects are even bigger, supporting 2.5 million jobs indirectly and generating a 21 billion euro trade surplus. From sustainability and R and D momentum that backs 9.1 billion euros of R and D spending in 2023 to energy use that still takes 7% of Germany’s total, this page connects competitiveness, production realities, and downstream value in a way that is hard to ignore.

Adhesive Industry Statistics
From 7.4 million tons of waterborne adhesives in 2023 and a 45% plus share of global revenue, to PSAs climbing toward 22.6 billion USD and hybrid MS polymer growth at 15% for facades, this Adhesive Industry statistics page tracks where value is shifting. Construction still leads demand at 28% volume, yet the real tension is in sectors like aerospace structural bonding and solar encapsulation where tiny shares move fast.
Specialty Chemicals Industry Statistics
With the global specialty chemicals market projected to reach USD 1,460.8 billion by 2030 on a 5.1% CAGR, this page maps where that growth actually lands, from automotive taking 25% of demand to water treatment growing at a 6% CAGR. It also surfaces the counterintuitive split across end uses and regions, including Asia Pacific’s 42% share in 2023 and a fast moving electronic chemicals segment set to grow at 6.8% CAGR to 2028.
India Plastics Industry Statistics
India’s plastic story looks sharper than you’d expect in 2023 and it starts with the gap between consumption and performance, with per capita use rising to 12 kg from 10 kg in 2020 while the global average sits far higher at 45 kg. Packaging and automotive demand are climbing fast, yet recycling, exports and policy outcomes are forcing a real reckoning with waste, as recycling capacity scales to 60 percent and India’s plastic trade balance moves to USD 2.3 billion.

Metal Statistics
Steel and copper are only the headline while the real plot is corrosion and chemistry in motion, from iron rusting to gold surviving acids and silver turning to Ag2S in sulfur, then jumping to production totals like 69.1 million metric tons of aluminum in 2022 and 52% US aluminum can recycling for a sharp reality check. Track the shift from passive oxide layers like Al2O3 and TiO2 to industrial drivers and reserves, so you can see why chemistry and supply sit on the same spreadsheet.
Polyurethane Industry Statistics
From 95 percent of refrigeration units built with PU insulation to 500 kg CO2 eq saved per m3 over a polyurethane lifecycle, this Polyurethane Industry statistics page connects material demand with real climate impact. See why block versus flexible applications define markets such as bedding at 90 percent PU foam use and automotive seating at 85 percent, alongside 28 percent EU-27 recycling progress in 2022 and 12 percent average recycled PU content in Europe in 2023.

Flavors And Fragrances Industry Statistics
Get the competitive snapshot of 2023 and the demand shifts shaping what comes next, from Givaudan’s 11.2% global F and F share and IFF’s USD 11.5 billion revenue to flavors growing faster than synthetics and fragrances gaining traction in fine categories. You will also see where customers are concentrating spend and ingredients, with AI fragrance design adopted by 70% of top firms by 2025 and e commerce projected to reach 25% of sales by 2028, so you can spot which players are positioned for clean label, plant based, and functional growth.
Resins Industry Statistics
Paint and coatings alone used 35 percent of global resins in 2023, reaching 28 million tons, but the surge is not just in bulky chemistries. Across sectors, everything from epoxy prepregs to ion exchange capacity and UV 3D printing photopolymers reshapes demand, and the whole market is already projected to climb from USD 55.2 billion in 2023 to USD 75.8 billion by 2030 with a 4.6 percent CAGR.
Global Chemicals Industry Statistics
Global chemicals moved to $5.0 trillion in 2022 yet the race for volume stays concentrated as the top 50 firms controlled 45% of sales, with BASF at 4.2% and Linde close behind at 3.8%. Specialty already commands 28% of the market, while trade is shifting fast, including China exporting $120 billion in 2023 and Europe pulling 30% of its imports from Asia.
Acrylic Sheet Industry Statistics
From signage revenue hitting USD 900 million in 2023 to recycled and UV stabilized growth trends, this page maps how acrylic sheets are being pulled into new demand pockets while production keeps shifting, with extruded taking 55% of the market by 2025. You will see the full split across sectors and regions, including Asia Pacific’s 42% share in 2022 and Europe’s 25% in 2023, so it is clear where the next pricing and capacity pressure will come from.
Enzyme Industry Statistics
Food and beverage already consume 38% of global industrial enzyme output, yet detergents still account for 29% of worldwide enzyme use and textile enzymes can cut denim water needs by 40%. Learn how newer pressure points, from 12% pharma biocatalysis share to wastewater plants degrading 85% of azo dyes in 24 hours, are reshaping demand across major enzyme families.
Flavor Fragrance Industry Statistics
Clean label and natural ingredients are reshaping flavor and fragrance launches, with 45% of new F and F introductions in 2023 tied to “natural” demand and sustainability adding 2.1% extra growth potential through 2030. At the same time, digital and AI flavor creation is expected to cut development time by 30% by 2028, while EU recycling rules could lift packaging costs on fragrances by 20%.
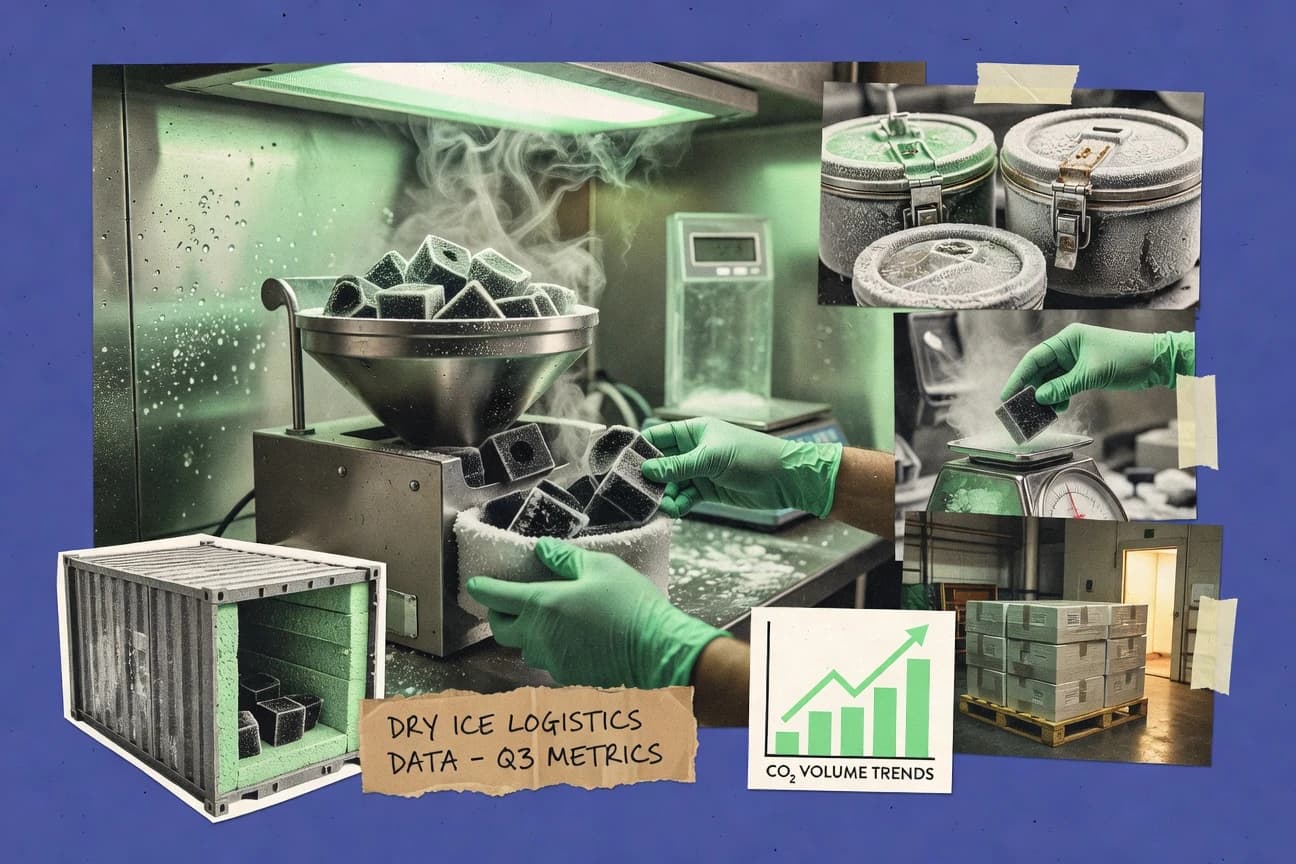
Dry Ice Industry Statistics
Dry ice moves far beyond cooling alone with 45 million pharmaceutical packages in the U.S. in 2023, while food preservation still takes 520,000 metric tons worldwide, the same year it represented 38.5% of demand. Expect a page where sustainability progress and operational efficiency show up in hard figures, from CO2 recapture and 95% lower water use in dry ice blasting to a market forecast toward USD 850 million by 2030 driven by cold chain and food and beverage logistics.
South Korea Petrochemical Industry Statistics
South Korea still ranks among the global ethylene leaders with 11.2 MTPA capacity in 2023 and a cluster footprint that concentrates scale, including Yeosu holding about 25% of national petrochemical capacity, yet utilization and feedstock economics quietly decide who stays profitable as margins and emissions targets tighten. Use this page to connect capacity, production, trade, and sustainability signals such as 45 million tons of petrochemical CO2 in 2022 and a 2022 export surplus of $13.3 billion, and understand where capacity additions like the planned 0.5 MTPA ethylene by 2025 at Seosan could shift the next competitive balance.

Epoxy Resin Industry Statistics
Demand is still being pulled by coatings but the picture is shifting toward electrification, with global epoxy resin consumption hitting 3.1 million tons in 2023 and the coatings segment taking 38 percent at 1.2 million tons. From wind blades and aerospace composites to anticorrosion in oil and gas, these end use and company capacity snapshots clarify where growth is most likely to concentrate next.

Chemicals Industry Statistics
Safety and sustainability are shifting fast, with global chemical companies reporting zero lost-time injuries in 2023 surveys and renewable energy climbing to 12% in 2023. Yet scale still dwarfs the headlines with a workforce near 10 million worldwide by 2023 and CO2 emissions at 1.2 gigatons in 2022, making it clear why process safety performance and climate pressure are now inseparable metrics for the sector.
Paint Coatings Industry Statistics
With the global paints and coatings market reaching USD 164.67 billion in 2023 and set to grow at a 5.1% CAGR through 2030, this statistics page connects the dots from architectural dominance, at 52.3% of consumption, to faster rising segments like powder coatings and UV-curable breakthroughs. You will see exactly where demand concentrates by end use and application, including the 40% construction pull and the surprising split across floors, roofs, marine, and protective oil and gas coatings.
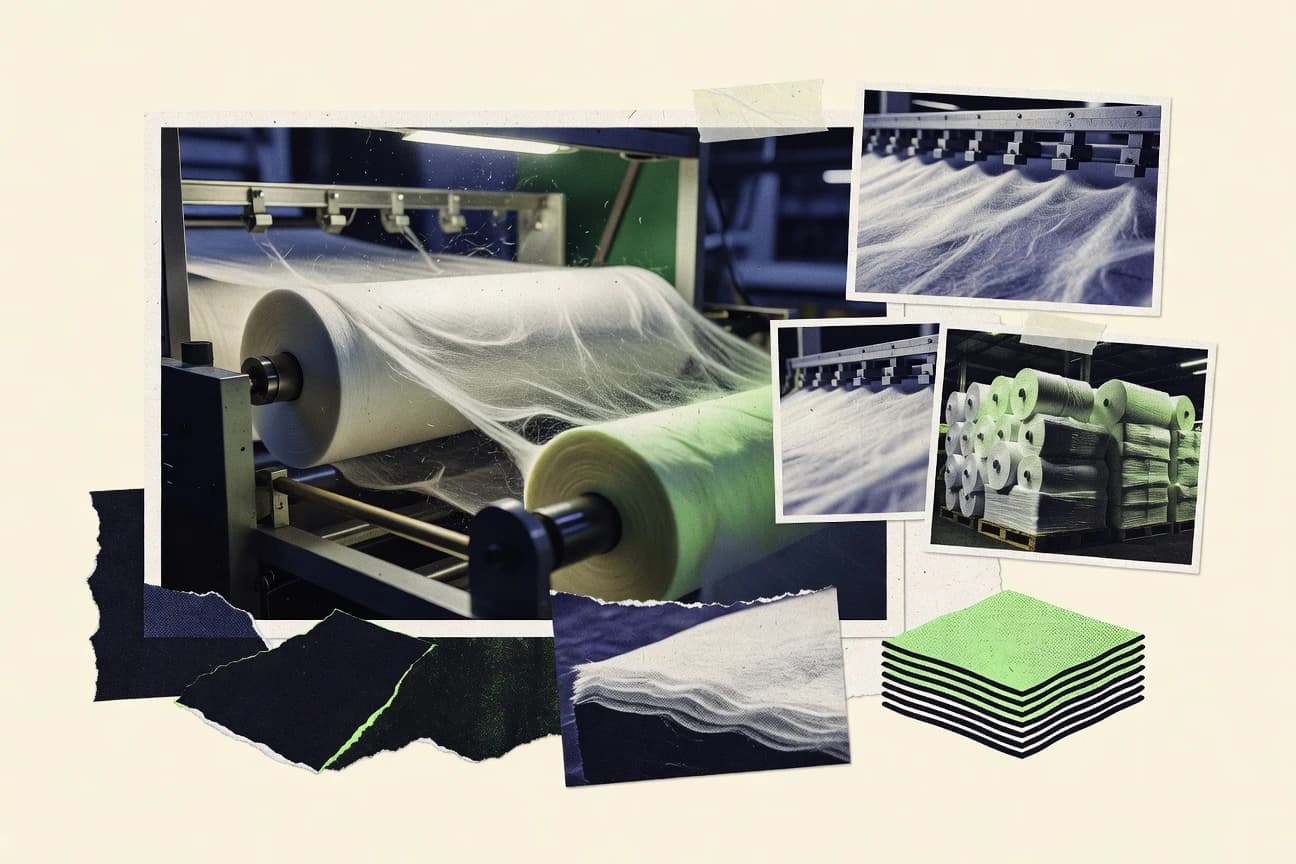
Nonwovens Industry Statistics
Hygiene nonwovens alone drew 4.8 million tons in 2023, while medical and filtration applications pulled the market in different directions with 2.1 million tons of medical nonwovens in 2022 and 0.89 million tons used for air and liquid filters in 2023. Alongside a global market value of USD 52.4 billion in 2022 projected to reach USD 74.2 billion by 2028, this Nonwovens Industry statistics page pairs end use by sector with production, capacity, trade, and the sustainability shift that saw the recycling rate hit 18% in 2023.

Silicone Rubber Industry Statistics
With the global silicone rubber market reaching USD 17.82 billion by 2030 and a production base that hit 2.1 million metric tons in 2022, this page pins down exactly where demand is concentrating and who is winning it. From automotive consumption of 550,000 tons to healthcare’s 15 percent share of use in 2023 and top producers controlling 75 percent of capacity, you get a practical, sector by sector view plus market share signals that are hard to spot anywhere else.
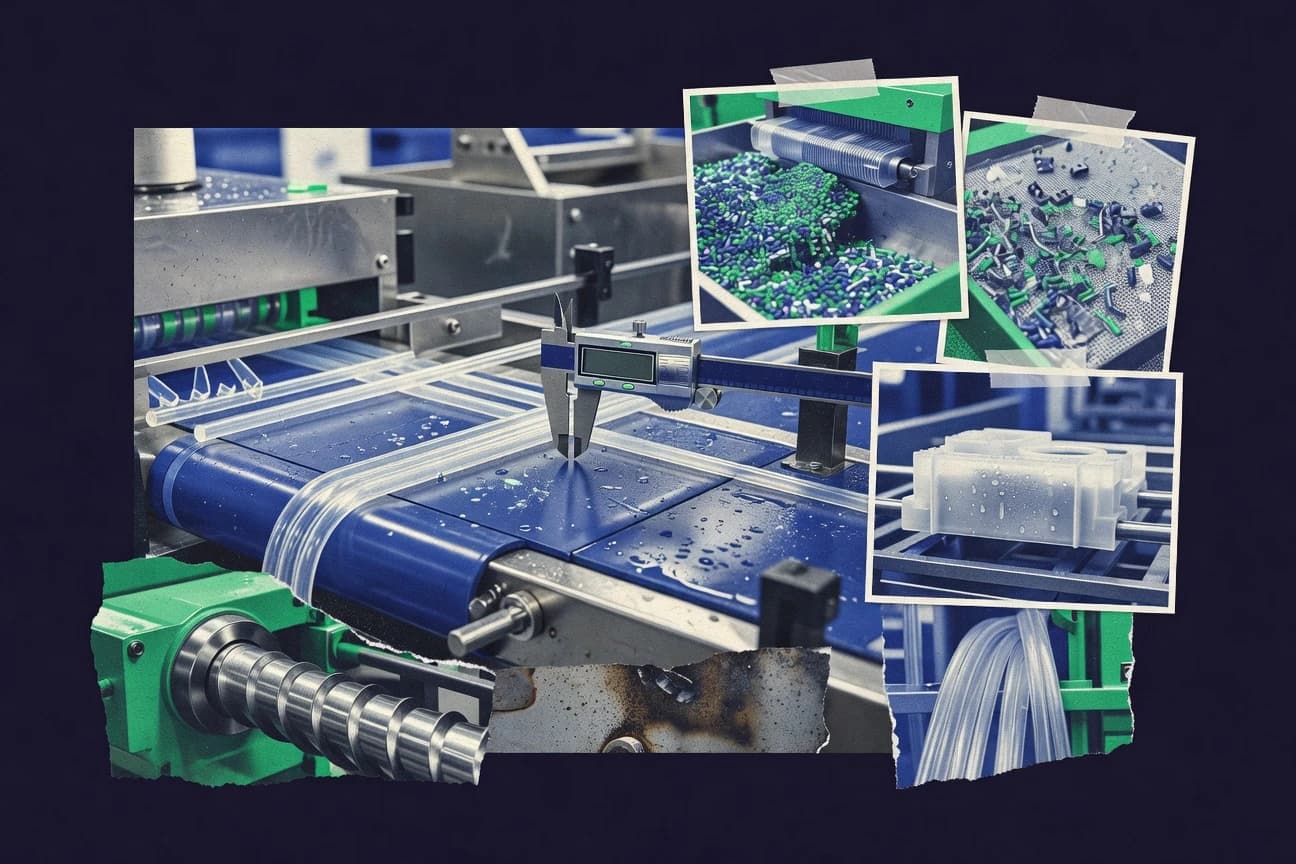
Plastic Production Statistics
Projections place global plastics production at about 600 million tonnes by 2030, then climb sharply toward 800 million tons by 2040 and 1.1 billion tonnes by 2050 as demand keeps rising. Track how major producers and feedstock demand shift this climb, from China’s capacity up 20% to 160 million tons by 2025 to recycling volumes that may triple to 30 million tons by 2030.